Free Statistics

of Irreproducible Research!

Author's title

Author*Unverified author*
R Software Modulerwasp_autocorrelation.wasp
Title produced by software(Partial) Autocorrelation Function
Date of computationTue, 15 Nov 2011 06:23:03 -0500
Cite this page as followsStatistical Computations at FreeStatistics.org, Office for Research Development and Education, URL https://freestatistics.org/blog/index.php?v=date/2011/Nov/15/t13213562325x6gwg1hwg9jy0d.htm/, Retrieved Thu, 25 Apr 2024 23:26:20 +0000
Statistical Computations at FreeStatistics.org, Office for Research Development and Education, URL https://freestatistics.org/blog/index.php?pk=142739, Retrieved Thu, 25 Apr 2024 23:26:20 +0000
QR Codes:

Original text written by user:
IsPrivate?No (this computation is public)
User-defined keywords KDGP2W12
Estimated Impact88
Family? (F = Feedback message, R = changed R code, M = changed R Module, P = changed Parameters, D = changed Data)
-     [(Partial) Autocorrelation Function] [opdracht 2 opgave...] [2011-11-15 11:19:49] [226376a35b8869827dc57271384c00a4]
- R P     [(Partial) Autocorrelation Function] [opdracht 2 opgave...] [2011-11-15 11:23:03] [480fcaba71e70207c3e0ad7177944aa6] [Current]
Feedback Forum

Post a new message
Dataseries X:
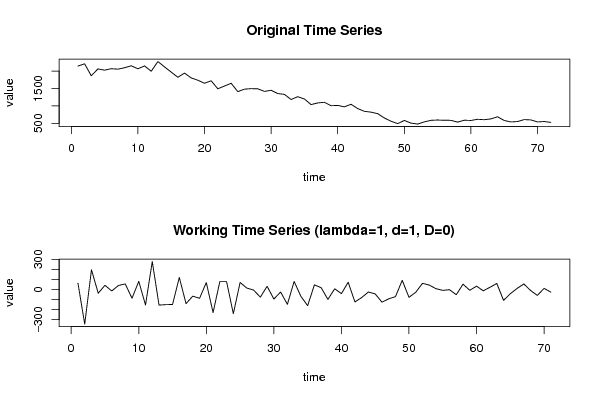
2144
2207
1864
2061
2025
2068
2054
2095
2151
2065
2147
1994
2273
2119
1969
1821
1942
1802
1737
1650
1720
1491
1570
1649
1409
1480
1495
1490
1415
1448
1354
1330
1183
1264
1197
1037
1084
1103
1005
1013
973
1046
923
844
820
777
652
560
490
582
505
478
540
585
594
586
585
534
588
581
615
603
626
687
580
539
550
606
597
539
551
526


Summary of computational transaction
Raw Inputview raw input (R code)
Raw Outputview raw output of R engine
Computing time1 seconds
R Server'Herman Ole Andreas Wold' @ wold.wessa.net

\begin{tabular}{lllllllll}
\hline
Summary of computational transaction \tabularnewline
Raw Input & view raw input (R code)  \tabularnewline
Raw Output & view raw output of R engine  \tabularnewline
Computing time & 1 seconds \tabularnewline
R Server & 'Herman Ole Andreas Wold' @ wold.wessa.net \tabularnewline
\hline
\end{tabular}
%Source: https://freestatistics.org/blog/index.php?pk=142739&T=0

[TABLE]
[ROW][C]Summary of computational transaction[/C][/ROW]
[ROW][C]Raw Input[/C][C]view raw input (R code) [/C][/ROW]
[ROW][C]Raw Output[/C][C]view raw output of R engine [/C][/ROW]
[ROW][C]Computing time[/C][C]1 seconds[/C][/ROW]
[ROW][C]R Server[/C][C]'Herman Ole Andreas Wold' @ wold.wessa.net[/C][/ROW]
[/TABLE]
Source: https://freestatistics.org/blog/index.php?pk=142739&T=0

Globally Unique Identifier (entire table): ba.freestatistics.org/blog/index.php?pk=142739&T=0

As an alternative you can also use a QR Code:  

The GUIDs for individual cells are displayed in the table below:

Summary of computational transaction
Raw Inputview raw input (R code)
Raw Outputview raw output of R engine
Computing time1 seconds
R Server'Herman Ole Andreas Wold' @ wold.wessa.net


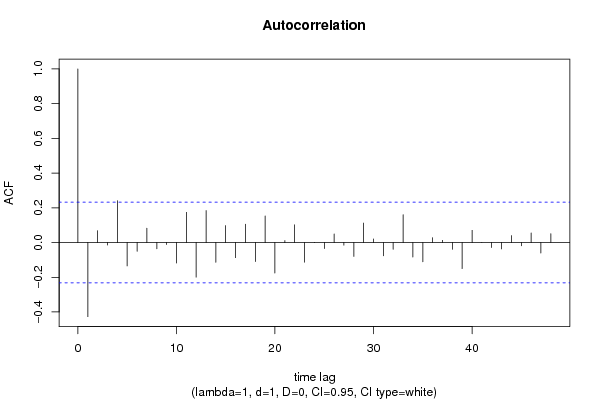
Autocorrelation Function
Time lag kACF(k)T-STATP-value
1-0.4269-3.59710.000295
20.0680370.57330.28413
3-0.014089-0.11870.452918
40.2408982.02980.023061
5-0.134539-1.13360.130377
6-0.049913-0.42060.337668
70.0827490.69730.24396
8-0.035632-0.30020.382434
9-0.011327-0.09540.462117
10-0.117865-0.99310.162006
110.1740531.46660.07345
12-0.199158-1.67810.048859
130.1839961.55040.062749
14-0.113608-0.95730.170838
150.0973570.82030.207383
16-0.087113-0.7340.232674
170.1051830.88630.189228
18-0.109263-0.92070.180172
190.1529461.28870.100835
20-0.175585-1.47950.071715
210.0112550.09480.462355
220.1019090.85870.196697
23-0.112733-0.94990.172692
24-8.6e-05-7e-040.499713
25-0.034702-0.29240.385416
260.0493320.41570.339449
27-0.015055-0.12690.449707
28-0.079895-0.67320.251501
290.1121080.94460.174024
300.0201420.16970.432857
31-0.075723-0.63810.262746
32-0.038244-0.32220.374105
330.1601431.34940.090749
34-0.083579-0.70430.24179
35-0.110698-0.93280.177053
360.0281160.23690.406705
370.0126340.10650.457761
38-0.039093-0.32940.37141
39-0.15009-1.26470.105061
400.0700240.590.278521
410.0002240.00190.499248
42-0.028933-0.24380.404047
43-0.036587-0.30830.379385
440.0396930.33450.369509
45-0.018337-0.15450.438822
460.0554030.46680.321024
47-0.060596-0.51060.30561
480.0506930.42710.335282

\begin{tabular}{lllllllll}
\hline
Autocorrelation Function \tabularnewline
Time lag k & ACF(k) & T-STAT & P-value \tabularnewline
1 & -0.4269 & -3.5971 & 0.000295 \tabularnewline
2 & 0.068037 & 0.5733 & 0.28413 \tabularnewline
3 & -0.014089 & -0.1187 & 0.452918 \tabularnewline
4 & 0.240898 & 2.0298 & 0.023061 \tabularnewline
5 & -0.134539 & -1.1336 & 0.130377 \tabularnewline
6 & -0.049913 & -0.4206 & 0.337668 \tabularnewline
7 & 0.082749 & 0.6973 & 0.24396 \tabularnewline
8 & -0.035632 & -0.3002 & 0.382434 \tabularnewline
9 & -0.011327 & -0.0954 & 0.462117 \tabularnewline
10 & -0.117865 & -0.9931 & 0.162006 \tabularnewline
11 & 0.174053 & 1.4666 & 0.07345 \tabularnewline
12 & -0.199158 & -1.6781 & 0.048859 \tabularnewline
13 & 0.183996 & 1.5504 & 0.062749 \tabularnewline
14 & -0.113608 & -0.9573 & 0.170838 \tabularnewline
15 & 0.097357 & 0.8203 & 0.207383 \tabularnewline
16 & -0.087113 & -0.734 & 0.232674 \tabularnewline
17 & 0.105183 & 0.8863 & 0.189228 \tabularnewline
18 & -0.109263 & -0.9207 & 0.180172 \tabularnewline
19 & 0.152946 & 1.2887 & 0.100835 \tabularnewline
20 & -0.175585 & -1.4795 & 0.071715 \tabularnewline
21 & 0.011255 & 0.0948 & 0.462355 \tabularnewline
22 & 0.101909 & 0.8587 & 0.196697 \tabularnewline
23 & -0.112733 & -0.9499 & 0.172692 \tabularnewline
24 & -8.6e-05 & -7e-04 & 0.499713 \tabularnewline
25 & -0.034702 & -0.2924 & 0.385416 \tabularnewline
26 & 0.049332 & 0.4157 & 0.339449 \tabularnewline
27 & -0.015055 & -0.1269 & 0.449707 \tabularnewline
28 & -0.079895 & -0.6732 & 0.251501 \tabularnewline
29 & 0.112108 & 0.9446 & 0.174024 \tabularnewline
30 & 0.020142 & 0.1697 & 0.432857 \tabularnewline
31 & -0.075723 & -0.6381 & 0.262746 \tabularnewline
32 & -0.038244 & -0.3222 & 0.374105 \tabularnewline
33 & 0.160143 & 1.3494 & 0.090749 \tabularnewline
34 & -0.083579 & -0.7043 & 0.24179 \tabularnewline
35 & -0.110698 & -0.9328 & 0.177053 \tabularnewline
36 & 0.028116 & 0.2369 & 0.406705 \tabularnewline
37 & 0.012634 & 0.1065 & 0.457761 \tabularnewline
38 & -0.039093 & -0.3294 & 0.37141 \tabularnewline
39 & -0.15009 & -1.2647 & 0.105061 \tabularnewline
40 & 0.070024 & 0.59 & 0.278521 \tabularnewline
41 & 0.000224 & 0.0019 & 0.499248 \tabularnewline
42 & -0.028933 & -0.2438 & 0.404047 \tabularnewline
43 & -0.036587 & -0.3083 & 0.379385 \tabularnewline
44 & 0.039693 & 0.3345 & 0.369509 \tabularnewline
45 & -0.018337 & -0.1545 & 0.438822 \tabularnewline
46 & 0.055403 & 0.4668 & 0.321024 \tabularnewline
47 & -0.060596 & -0.5106 & 0.30561 \tabularnewline
48 & 0.050693 & 0.4271 & 0.335282 \tabularnewline
\hline
\end{tabular}
%Source: https://freestatistics.org/blog/index.php?pk=142739&T=1

[TABLE]
[ROW][C]Autocorrelation Function[/C][/ROW]
[ROW][C]Time lag k[/C][C]ACF(k)[/C][C]T-STAT[/C][C]P-value[/C][/ROW]
[ROW][C]1[/C][C]-0.4269[/C][C]-3.5971[/C][C]0.000295[/C][/ROW]
[ROW][C]2[/C][C]0.068037[/C][C]0.5733[/C][C]0.28413[/C][/ROW]
[ROW][C]3[/C][C]-0.014089[/C][C]-0.1187[/C][C]0.452918[/C][/ROW]
[ROW][C]4[/C][C]0.240898[/C][C]2.0298[/C][C]0.023061[/C][/ROW]
[ROW][C]5[/C][C]-0.134539[/C][C]-1.1336[/C][C]0.130377[/C][/ROW]
[ROW][C]6[/C][C]-0.049913[/C][C]-0.4206[/C][C]0.337668[/C][/ROW]
[ROW][C]7[/C][C]0.082749[/C][C]0.6973[/C][C]0.24396[/C][/ROW]
[ROW][C]8[/C][C]-0.035632[/C][C]-0.3002[/C][C]0.382434[/C][/ROW]
[ROW][C]9[/C][C]-0.011327[/C][C]-0.0954[/C][C]0.462117[/C][/ROW]
[ROW][C]10[/C][C]-0.117865[/C][C]-0.9931[/C][C]0.162006[/C][/ROW]
[ROW][C]11[/C][C]0.174053[/C][C]1.4666[/C][C]0.07345[/C][/ROW]
[ROW][C]12[/C][C]-0.199158[/C][C]-1.6781[/C][C]0.048859[/C][/ROW]
[ROW][C]13[/C][C]0.183996[/C][C]1.5504[/C][C]0.062749[/C][/ROW]
[ROW][C]14[/C][C]-0.113608[/C][C]-0.9573[/C][C]0.170838[/C][/ROW]
[ROW][C]15[/C][C]0.097357[/C][C]0.8203[/C][C]0.207383[/C][/ROW]
[ROW][C]16[/C][C]-0.087113[/C][C]-0.734[/C][C]0.232674[/C][/ROW]
[ROW][C]17[/C][C]0.105183[/C][C]0.8863[/C][C]0.189228[/C][/ROW]
[ROW][C]18[/C][C]-0.109263[/C][C]-0.9207[/C][C]0.180172[/C][/ROW]
[ROW][C]19[/C][C]0.152946[/C][C]1.2887[/C][C]0.100835[/C][/ROW]
[ROW][C]20[/C][C]-0.175585[/C][C]-1.4795[/C][C]0.071715[/C][/ROW]
[ROW][C]21[/C][C]0.011255[/C][C]0.0948[/C][C]0.462355[/C][/ROW]
[ROW][C]22[/C][C]0.101909[/C][C]0.8587[/C][C]0.196697[/C][/ROW]
[ROW][C]23[/C][C]-0.112733[/C][C]-0.9499[/C][C]0.172692[/C][/ROW]
[ROW][C]24[/C][C]-8.6e-05[/C][C]-7e-04[/C][C]0.499713[/C][/ROW]
[ROW][C]25[/C][C]-0.034702[/C][C]-0.2924[/C][C]0.385416[/C][/ROW]
[ROW][C]26[/C][C]0.049332[/C][C]0.4157[/C][C]0.339449[/C][/ROW]
[ROW][C]27[/C][C]-0.015055[/C][C]-0.1269[/C][C]0.449707[/C][/ROW]
[ROW][C]28[/C][C]-0.079895[/C][C]-0.6732[/C][C]0.251501[/C][/ROW]
[ROW][C]29[/C][C]0.112108[/C][C]0.9446[/C][C]0.174024[/C][/ROW]
[ROW][C]30[/C][C]0.020142[/C][C]0.1697[/C][C]0.432857[/C][/ROW]
[ROW][C]31[/C][C]-0.075723[/C][C]-0.6381[/C][C]0.262746[/C][/ROW]
[ROW][C]32[/C][C]-0.038244[/C][C]-0.3222[/C][C]0.374105[/C][/ROW]
[ROW][C]33[/C][C]0.160143[/C][C]1.3494[/C][C]0.090749[/C][/ROW]
[ROW][C]34[/C][C]-0.083579[/C][C]-0.7043[/C][C]0.24179[/C][/ROW]
[ROW][C]35[/C][C]-0.110698[/C][C]-0.9328[/C][C]0.177053[/C][/ROW]
[ROW][C]36[/C][C]0.028116[/C][C]0.2369[/C][C]0.406705[/C][/ROW]
[ROW][C]37[/C][C]0.012634[/C][C]0.1065[/C][C]0.457761[/C][/ROW]
[ROW][C]38[/C][C]-0.039093[/C][C]-0.3294[/C][C]0.37141[/C][/ROW]
[ROW][C]39[/C][C]-0.15009[/C][C]-1.2647[/C][C]0.105061[/C][/ROW]
[ROW][C]40[/C][C]0.070024[/C][C]0.59[/C][C]0.278521[/C][/ROW]
[ROW][C]41[/C][C]0.000224[/C][C]0.0019[/C][C]0.499248[/C][/ROW]
[ROW][C]42[/C][C]-0.028933[/C][C]-0.2438[/C][C]0.404047[/C][/ROW]
[ROW][C]43[/C][C]-0.036587[/C][C]-0.3083[/C][C]0.379385[/C][/ROW]
[ROW][C]44[/C][C]0.039693[/C][C]0.3345[/C][C]0.369509[/C][/ROW]
[ROW][C]45[/C][C]-0.018337[/C][C]-0.1545[/C][C]0.438822[/C][/ROW]
[ROW][C]46[/C][C]0.055403[/C][C]0.4668[/C][C]0.321024[/C][/ROW]
[ROW][C]47[/C][C]-0.060596[/C][C]-0.5106[/C][C]0.30561[/C][/ROW]
[ROW][C]48[/C][C]0.050693[/C][C]0.4271[/C][C]0.335282[/C][/ROW]
[/TABLE]
Source: https://freestatistics.org/blog/index.php?pk=142739&T=1

Globally Unique Identifier (entire table): ba.freestatistics.org/blog/index.php?pk=142739&T=1

As an alternative you can also use a QR Code:  

The GUIDs for individual cells are displayed in the table below:

Autocorrelation Function
Time lag kACF(k)T-STATP-value
1-0.4269-3.59710.000295
20.0680370.57330.28413
3-0.014089-0.11870.452918
40.2408982.02980.023061
5-0.134539-1.13360.130377
6-0.049913-0.42060.337668
70.0827490.69730.24396
8-0.035632-0.30020.382434
9-0.011327-0.09540.462117
10-0.117865-0.99310.162006
110.1740531.46660.07345
12-0.199158-1.67810.048859
130.1839961.55040.062749
14-0.113608-0.95730.170838
150.0973570.82030.207383
16-0.087113-0.7340.232674
170.1051830.88630.189228
18-0.109263-0.92070.180172
190.1529461.28870.100835
20-0.175585-1.47950.071715
210.0112550.09480.462355
220.1019090.85870.196697
23-0.112733-0.94990.172692
24-8.6e-05-7e-040.499713
25-0.034702-0.29240.385416
260.0493320.41570.339449
27-0.015055-0.12690.449707
28-0.079895-0.67320.251501
290.1121080.94460.174024
300.0201420.16970.432857
31-0.075723-0.63810.262746
32-0.038244-0.32220.374105
330.1601431.34940.090749
34-0.083579-0.70430.24179
35-0.110698-0.93280.177053
360.0281160.23690.406705
370.0126340.10650.457761
38-0.039093-0.32940.37141
39-0.15009-1.26470.105061
400.0700240.590.278521
410.0002240.00190.499248
42-0.028933-0.24380.404047
43-0.036587-0.30830.379385
440.0396930.33450.369509
45-0.018337-0.15450.438822
460.0554030.46680.321024
47-0.060596-0.51060.30561
480.0506930.42710.335282


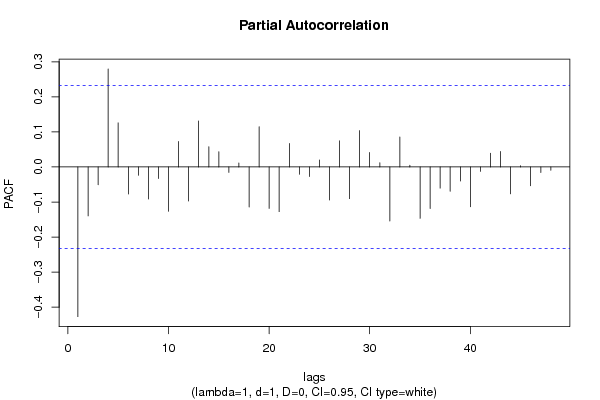
Partial Autocorrelation Function
Time lag kPACF(k)T-STATP-value
1-0.4269-3.59710.000295
2-0.139659-1.17680.121605
3-0.050646-0.42670.335427
40.2794642.35480.01065
50.1256671.05890.14662
6-0.077182-0.65040.258783
7-0.023554-0.19850.421621
8-0.091236-0.76880.222291
9-0.033099-0.27890.390568
10-0.12648-1.06570.145075
110.0725570.61140.271452
12-0.096992-0.81730.208254
130.1309531.10340.136783
140.0577950.4870.313884
150.0433220.3650.358084
16-0.015578-0.13130.447969
170.0111540.0940.462692
18-0.114374-0.96370.169226
190.1145630.96530.168828
20-0.11812-0.99530.161486
21-0.127534-1.07460.143091
220.0669180.56390.287313
23-0.020897-0.17610.430365
24-0.027023-0.22770.410268
250.0199350.1680.433539
26-0.094405-0.79550.214497
270.0744850.62760.266134
28-0.090334-0.76120.224539
290.1035640.87260.192898
300.0414030.34890.364111
310.0120050.10120.459855
32-0.153998-1.29760.099311
330.0853790.71940.237123
340.0046620.03930.484387
35-0.146587-1.23520.11042
36-0.118643-0.99970.160424
37-0.060486-0.50970.305934
38-0.069237-0.58340.280736
39-0.040165-0.33840.368016
40-0.113489-0.95630.17109
41-0.012664-0.10670.45766
420.0392090.33040.371043
430.0441440.3720.355514
44-0.076712-0.64640.260055
450.0033080.02790.488922
46-0.053577-0.45140.326522
47-0.015873-0.13370.44699
48-0.009481-0.07990.468276

\begin{tabular}{lllllllll}
\hline
Partial Autocorrelation Function \tabularnewline
Time lag k & PACF(k) & T-STAT & P-value \tabularnewline
1 & -0.4269 & -3.5971 & 0.000295 \tabularnewline
2 & -0.139659 & -1.1768 & 0.121605 \tabularnewline
3 & -0.050646 & -0.4267 & 0.335427 \tabularnewline
4 & 0.279464 & 2.3548 & 0.01065 \tabularnewline
5 & 0.125667 & 1.0589 & 0.14662 \tabularnewline
6 & -0.077182 & -0.6504 & 0.258783 \tabularnewline
7 & -0.023554 & -0.1985 & 0.421621 \tabularnewline
8 & -0.091236 & -0.7688 & 0.222291 \tabularnewline
9 & -0.033099 & -0.2789 & 0.390568 \tabularnewline
10 & -0.12648 & -1.0657 & 0.145075 \tabularnewline
11 & 0.072557 & 0.6114 & 0.271452 \tabularnewline
12 & -0.096992 & -0.8173 & 0.208254 \tabularnewline
13 & 0.130953 & 1.1034 & 0.136783 \tabularnewline
14 & 0.057795 & 0.487 & 0.313884 \tabularnewline
15 & 0.043322 & 0.365 & 0.358084 \tabularnewline
16 & -0.015578 & -0.1313 & 0.447969 \tabularnewline
17 & 0.011154 & 0.094 & 0.462692 \tabularnewline
18 & -0.114374 & -0.9637 & 0.169226 \tabularnewline
19 & 0.114563 & 0.9653 & 0.168828 \tabularnewline
20 & -0.11812 & -0.9953 & 0.161486 \tabularnewline
21 & -0.127534 & -1.0746 & 0.143091 \tabularnewline
22 & 0.066918 & 0.5639 & 0.287313 \tabularnewline
23 & -0.020897 & -0.1761 & 0.430365 \tabularnewline
24 & -0.027023 & -0.2277 & 0.410268 \tabularnewline
25 & 0.019935 & 0.168 & 0.433539 \tabularnewline
26 & -0.094405 & -0.7955 & 0.214497 \tabularnewline
27 & 0.074485 & 0.6276 & 0.266134 \tabularnewline
28 & -0.090334 & -0.7612 & 0.224539 \tabularnewline
29 & 0.103564 & 0.8726 & 0.192898 \tabularnewline
30 & 0.041403 & 0.3489 & 0.364111 \tabularnewline
31 & 0.012005 & 0.1012 & 0.459855 \tabularnewline
32 & -0.153998 & -1.2976 & 0.099311 \tabularnewline
33 & 0.085379 & 0.7194 & 0.237123 \tabularnewline
34 & 0.004662 & 0.0393 & 0.484387 \tabularnewline
35 & -0.146587 & -1.2352 & 0.11042 \tabularnewline
36 & -0.118643 & -0.9997 & 0.160424 \tabularnewline
37 & -0.060486 & -0.5097 & 0.305934 \tabularnewline
38 & -0.069237 & -0.5834 & 0.280736 \tabularnewline
39 & -0.040165 & -0.3384 & 0.368016 \tabularnewline
40 & -0.113489 & -0.9563 & 0.17109 \tabularnewline
41 & -0.012664 & -0.1067 & 0.45766 \tabularnewline
42 & 0.039209 & 0.3304 & 0.371043 \tabularnewline
43 & 0.044144 & 0.372 & 0.355514 \tabularnewline
44 & -0.076712 & -0.6464 & 0.260055 \tabularnewline
45 & 0.003308 & 0.0279 & 0.488922 \tabularnewline
46 & -0.053577 & -0.4514 & 0.326522 \tabularnewline
47 & -0.015873 & -0.1337 & 0.44699 \tabularnewline
48 & -0.009481 & -0.0799 & 0.468276 \tabularnewline
\hline
\end{tabular}
%Source: https://freestatistics.org/blog/index.php?pk=142739&T=2

[TABLE]
[ROW][C]Partial Autocorrelation Function[/C][/ROW]
[ROW][C]Time lag k[/C][C]PACF(k)[/C][C]T-STAT[/C][C]P-value[/C][/ROW]
[ROW][C]1[/C][C]-0.4269[/C][C]-3.5971[/C][C]0.000295[/C][/ROW]
[ROW][C]2[/C][C]-0.139659[/C][C]-1.1768[/C][C]0.121605[/C][/ROW]
[ROW][C]3[/C][C]-0.050646[/C][C]-0.4267[/C][C]0.335427[/C][/ROW]
[ROW][C]4[/C][C]0.279464[/C][C]2.3548[/C][C]0.01065[/C][/ROW]
[ROW][C]5[/C][C]0.125667[/C][C]1.0589[/C][C]0.14662[/C][/ROW]
[ROW][C]6[/C][C]-0.077182[/C][C]-0.6504[/C][C]0.258783[/C][/ROW]
[ROW][C]7[/C][C]-0.023554[/C][C]-0.1985[/C][C]0.421621[/C][/ROW]
[ROW][C]8[/C][C]-0.091236[/C][C]-0.7688[/C][C]0.222291[/C][/ROW]
[ROW][C]9[/C][C]-0.033099[/C][C]-0.2789[/C][C]0.390568[/C][/ROW]
[ROW][C]10[/C][C]-0.12648[/C][C]-1.0657[/C][C]0.145075[/C][/ROW]
[ROW][C]11[/C][C]0.072557[/C][C]0.6114[/C][C]0.271452[/C][/ROW]
[ROW][C]12[/C][C]-0.096992[/C][C]-0.8173[/C][C]0.208254[/C][/ROW]
[ROW][C]13[/C][C]0.130953[/C][C]1.1034[/C][C]0.136783[/C][/ROW]
[ROW][C]14[/C][C]0.057795[/C][C]0.487[/C][C]0.313884[/C][/ROW]
[ROW][C]15[/C][C]0.043322[/C][C]0.365[/C][C]0.358084[/C][/ROW]
[ROW][C]16[/C][C]-0.015578[/C][C]-0.1313[/C][C]0.447969[/C][/ROW]
[ROW][C]17[/C][C]0.011154[/C][C]0.094[/C][C]0.462692[/C][/ROW]
[ROW][C]18[/C][C]-0.114374[/C][C]-0.9637[/C][C]0.169226[/C][/ROW]
[ROW][C]19[/C][C]0.114563[/C][C]0.9653[/C][C]0.168828[/C][/ROW]
[ROW][C]20[/C][C]-0.11812[/C][C]-0.9953[/C][C]0.161486[/C][/ROW]
[ROW][C]21[/C][C]-0.127534[/C][C]-1.0746[/C][C]0.143091[/C][/ROW]
[ROW][C]22[/C][C]0.066918[/C][C]0.5639[/C][C]0.287313[/C][/ROW]
[ROW][C]23[/C][C]-0.020897[/C][C]-0.1761[/C][C]0.430365[/C][/ROW]
[ROW][C]24[/C][C]-0.027023[/C][C]-0.2277[/C][C]0.410268[/C][/ROW]
[ROW][C]25[/C][C]0.019935[/C][C]0.168[/C][C]0.433539[/C][/ROW]
[ROW][C]26[/C][C]-0.094405[/C][C]-0.7955[/C][C]0.214497[/C][/ROW]
[ROW][C]27[/C][C]0.074485[/C][C]0.6276[/C][C]0.266134[/C][/ROW]
[ROW][C]28[/C][C]-0.090334[/C][C]-0.7612[/C][C]0.224539[/C][/ROW]
[ROW][C]29[/C][C]0.103564[/C][C]0.8726[/C][C]0.192898[/C][/ROW]
[ROW][C]30[/C][C]0.041403[/C][C]0.3489[/C][C]0.364111[/C][/ROW]
[ROW][C]31[/C][C]0.012005[/C][C]0.1012[/C][C]0.459855[/C][/ROW]
[ROW][C]32[/C][C]-0.153998[/C][C]-1.2976[/C][C]0.099311[/C][/ROW]
[ROW][C]33[/C][C]0.085379[/C][C]0.7194[/C][C]0.237123[/C][/ROW]
[ROW][C]34[/C][C]0.004662[/C][C]0.0393[/C][C]0.484387[/C][/ROW]
[ROW][C]35[/C][C]-0.146587[/C][C]-1.2352[/C][C]0.11042[/C][/ROW]
[ROW][C]36[/C][C]-0.118643[/C][C]-0.9997[/C][C]0.160424[/C][/ROW]
[ROW][C]37[/C][C]-0.060486[/C][C]-0.5097[/C][C]0.305934[/C][/ROW]
[ROW][C]38[/C][C]-0.069237[/C][C]-0.5834[/C][C]0.280736[/C][/ROW]
[ROW][C]39[/C][C]-0.040165[/C][C]-0.3384[/C][C]0.368016[/C][/ROW]
[ROW][C]40[/C][C]-0.113489[/C][C]-0.9563[/C][C]0.17109[/C][/ROW]
[ROW][C]41[/C][C]-0.012664[/C][C]-0.1067[/C][C]0.45766[/C][/ROW]
[ROW][C]42[/C][C]0.039209[/C][C]0.3304[/C][C]0.371043[/C][/ROW]
[ROW][C]43[/C][C]0.044144[/C][C]0.372[/C][C]0.355514[/C][/ROW]
[ROW][C]44[/C][C]-0.076712[/C][C]-0.6464[/C][C]0.260055[/C][/ROW]
[ROW][C]45[/C][C]0.003308[/C][C]0.0279[/C][C]0.488922[/C][/ROW]
[ROW][C]46[/C][C]-0.053577[/C][C]-0.4514[/C][C]0.326522[/C][/ROW]
[ROW][C]47[/C][C]-0.015873[/C][C]-0.1337[/C][C]0.44699[/C][/ROW]
[ROW][C]48[/C][C]-0.009481[/C][C]-0.0799[/C][C]0.468276[/C][/ROW]
[/TABLE]
Source: https://freestatistics.org/blog/index.php?pk=142739&T=2

Globally Unique Identifier (entire table): ba.freestatistics.org/blog/index.php?pk=142739&T=2

As an alternative you can also use a QR Code:  

The GUIDs for individual cells are displayed in the table below:

Partial Autocorrelation Function
Time lag kPACF(k)T-STATP-value
1-0.4269-3.59710.000295
2-0.139659-1.17680.121605
3-0.050646-0.42670.335427
40.2794642.35480.01065
50.1256671.05890.14662
6-0.077182-0.65040.258783
7-0.023554-0.19850.421621
8-0.091236-0.76880.222291
9-0.033099-0.27890.390568
10-0.12648-1.06570.145075
110.0725570.61140.271452
12-0.096992-0.81730.208254
130.1309531.10340.136783
140.0577950.4870.313884
150.0433220.3650.358084
16-0.015578-0.13130.447969
170.0111540.0940.462692
18-0.114374-0.96370.169226
190.1145630.96530.168828
20-0.11812-0.99530.161486
21-0.127534-1.07460.143091
220.0669180.56390.287313
23-0.020897-0.17610.430365
24-0.027023-0.22770.410268
250.0199350.1680.433539
26-0.094405-0.79550.214497
270.0744850.62760.266134
28-0.090334-0.76120.224539
290.1035640.87260.192898
300.0414030.34890.364111
310.0120050.10120.459855
32-0.153998-1.29760.099311
330.0853790.71940.237123
340.0046620.03930.484387
35-0.146587-1.23520.11042
36-0.118643-0.99970.160424
37-0.060486-0.50970.305934
38-0.069237-0.58340.280736
39-0.040165-0.33840.368016
40-0.113489-0.95630.17109
41-0.012664-0.10670.45766
420.0392090.33040.371043
430.0441440.3720.355514
44-0.076712-0.64640.260055
450.0033080.02790.488922
46-0.053577-0.45140.326522
47-0.015873-0.13370.44699
48-0.009481-0.07990.468276


Parameters (Session):
par1 = 48 ; par2 = 1 ; par3 = 1 ; par4 = 0 ; par5 = 12 ; par6 = White Noise ; par7 = 0.95 ;
Parameters (R input):
par1 = 48 ; par2 = 1 ; par3 = 1 ; par4 = 0 ; par5 = 12 ; par6 = White Noise ; par7 = 0.95 ; par8 = ;
R code (references can be found in the software module):
if (par1 == 'Default') {
par1 = 10*log10(length(x))
} else {
par1 <- as.numeric(par1)
}
par2 <- as.numeric(par2)
par3 <- as.numeric(par3)
par4 <- as.numeric(par4)
par5 <- as.numeric(par5)
if (par6 == 'White Noise') par6 <- 'white' else par6 <- 'ma'
par7 <- as.numeric(par7)
if (par8 != '') par8 <- as.numeric(par8)
ox <- x
if (par8 == '') {
if (par2 == 0) {
x <- log(x)
} else {
x <- (x ^ par2 - 1) / par2
}
} else {
x <- log(x,base=par8)
}
if (par3 > 0) x <- diff(x,lag=1,difference=par3)
if (par4 > 0) x <- diff(x,lag=par5,difference=par4)
bitmap(file='picts.png')
op <- par(mfrow=c(2,1))
plot(ox,type='l',main='Original Time Series',xlab='time',ylab='value')
if (par8=='') {
mytitle <- paste('Working Time Series (lambda=',par2,', d=',par3,', D=',par4,')',sep='')
mysub <- paste('(lambda=',par2,', d=',par3,', D=',par4,', CI=', par7, ', CI type=',par6,')',sep='')
} else {
mytitle <- paste('Working Time Series (base=',par8,', d=',par3,', D=',par4,')',sep='')
mysub <- paste('(base=',par8,', d=',par3,', D=',par4,', CI=', par7, ', CI type=',par6,')',sep='')
}
plot(x,type='l', main=mytitle,xlab='time',ylab='value')
par(op)
dev.off()
bitmap(file='pic1.png')
racf <- acf(x, par1, main='Autocorrelation', xlab='time lag', ylab='ACF', ci.type=par6, ci=par7, sub=mysub)
dev.off()
bitmap(file='pic2.png')
rpacf <- pacf(x,par1,main='Partial Autocorrelation',xlab='lags',ylab='PACF',sub=mysub)
dev.off()
(myacf <- c(racf$acf))
(mypacf <- c(rpacf$acf))
lengthx <- length(x)
sqrtn <- sqrt(lengthx)
load(file='createtable')
a<-table.start()
a<-table.row.start(a)
a<-table.element(a,'Autocorrelation Function',4,TRUE)
a<-table.row.end(a)
a<-table.row.start(a)
a<-table.element(a,'Time lag k',header=TRUE)
a<-table.element(a,hyperlink('basics.htm','ACF(k)','click here for more information about the Autocorrelation Function'),header=TRUE)
a<-table.element(a,'T-STAT',header=TRUE)
a<-table.element(a,'P-value',header=TRUE)
a<-table.row.end(a)
for (i in 2:(par1+1)) {
a<-table.row.start(a)
a<-table.element(a,i-1,header=TRUE)
a<-table.element(a,round(myacf[i],6))
mytstat <- myacf[i]*sqrtn
a<-table.element(a,round(mytstat,4))
a<-table.element(a,round(1-pt(abs(mytstat),lengthx),6))
a<-table.row.end(a)
}
a<-table.end(a)
table.save(a,file='mytable.tab')
a<-table.start()
a<-table.row.start(a)
a<-table.element(a,'Partial Autocorrelation Function',4,TRUE)
a<-table.row.end(a)
a<-table.row.start(a)
a<-table.element(a,'Time lag k',header=TRUE)
a<-table.element(a,hyperlink('basics.htm','PACF(k)','click here for more information about the Partial Autocorrelation Function'),header=TRUE)
a<-table.element(a,'T-STAT',header=TRUE)
a<-table.element(a,'P-value',header=TRUE)
a<-table.row.end(a)
for (i in 1:par1) {
a<-table.row.start(a)
a<-table.element(a,i,header=TRUE)
a<-table.element(a,round(mypacf[i],6))
mytstat <- mypacf[i]*sqrtn
a<-table.element(a,round(mytstat,4))
a<-table.element(a,round(1-pt(abs(mytstat),lengthx),6))
a<-table.row.end(a)
}
a<-table.end(a)
table.save(a,file='mytable1.tab')