Free Statistics

of Irreproducible Research!

Author's title

Author*Unverified author*
R Software Modulerwasp_autocorrelation.wasp
Title produced by software(Partial) Autocorrelation Function
Date of computationTue, 15 Nov 2011 06:19:49 -0500
Cite this page as followsStatistical Computations at FreeStatistics.org, Office for Research Development and Education, URL https://freestatistics.org/blog/index.php?v=date/2011/Nov/15/t13213560590vf9sjtddi7bxm5.htm/, Retrieved Wed, 24 Apr 2024 22:23:20 +0000
Statistical Computations at FreeStatistics.org, Office for Research Development and Education, URL https://freestatistics.org/blog/index.php?pk=142737, Retrieved Wed, 24 Apr 2024 22:23:20 +0000
QR Codes:

Original text written by user:
IsPrivate?No (this computation is public)
User-defined keywordsKDGP2W12
Estimated Impact112
Family? (F = Feedback message, R = changed R code, M = changed R Module, P = changed Parameters, D = changed Data)
-       [(Partial) Autocorrelation Function] [opdracht 2 opgave...] [2011-11-15 11:19:49] [480fcaba71e70207c3e0ad7177944aa6] [Current]
- R P     [(Partial) Autocorrelation Function] [opdracht 2 opgave...] [2011-11-15 11:23:03] [226376a35b8869827dc57271384c00a4]
Feedback Forum

Post a new message
Dataseries X:
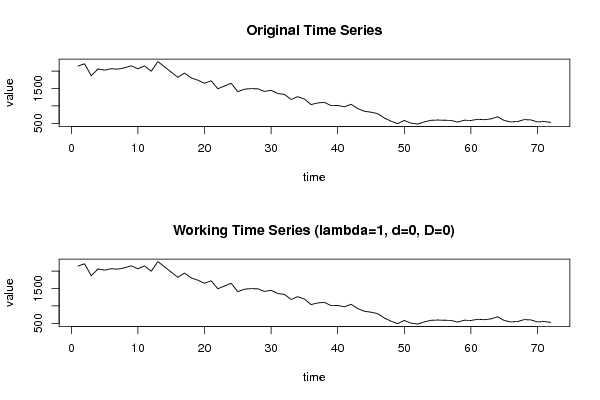
2144
2207
1864
2061
2025
2068
2054
2095
2151
2065
2147
1994
2273
2119
1969
1821
1942
1802
1737
1650
1720
1491
1570
1649
1409
1480
1495
1490
1415
1448
1354
1330
1183
1264
1197
1037
1084
1103
1005
1013
973
1046
923
844
820
777
652
560
490
582
505
478
540
585
594
586
585
534
588
581
615
603
626
687
580
539
550
606
597
539
551
526


Summary of computational transaction
Raw Inputview raw input (R code)
Raw Outputview raw output of R engine
Computing time2 seconds
R Server'AstonUniversity' @ aston.wessa.net

\begin{tabular}{lllllllll}
\hline
Summary of computational transaction \tabularnewline
Raw Input & view raw input (R code)  \tabularnewline
Raw Output & view raw output of R engine  \tabularnewline
Computing time & 2 seconds \tabularnewline
R Server & 'AstonUniversity' @ aston.wessa.net \tabularnewline
\hline
\end{tabular}
%Source: https://freestatistics.org/blog/index.php?pk=142737&T=0

[TABLE]
[ROW][C]Summary of computational transaction[/C][/ROW]
[ROW][C]Raw Input[/C][C]view raw input (R code) [/C][/ROW]
[ROW][C]Raw Output[/C][C]view raw output of R engine [/C][/ROW]
[ROW][C]Computing time[/C][C]2 seconds[/C][/ROW]
[ROW][C]R Server[/C][C]'AstonUniversity' @ aston.wessa.net[/C][/ROW]
[/TABLE]
Source: https://freestatistics.org/blog/index.php?pk=142737&T=0

Globally Unique Identifier (entire table): ba.freestatistics.org/blog/index.php?pk=142737&T=0

As an alternative you can also use a QR Code:  

The GUIDs for individual cells are displayed in the table below:

Summary of computational transaction
Raw Inputview raw input (R code)
Raw Outputview raw output of R engine
Computing time2 seconds
R Server'AstonUniversity' @ aston.wessa.net


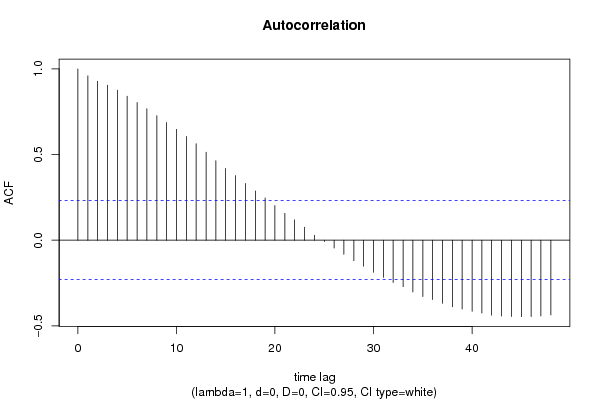
Autocorrelation Function
Time lag kACF(k)T-STATP-value
10.9598358.14450
20.9280527.87480
30.9053297.6820
40.8760387.43340
50.8404737.13160
60.8040386.82250
70.76776.51410
80.727266.1710
90.6871385.83060
100.647365.4930
110.6056055.13871e-06
120.5635854.78224e-06
130.5141784.36292.1e-05
140.4639673.93699.4e-05
150.4192583.55750.000333
160.377253.20110.001019
170.3317082.81460.003147
180.2872082.4370.00864
190.246382.09060.020047
200.2020281.71430.045391
210.1567141.32980.093897
220.1188131.00820.158377
230.0760390.64520.260421
240.0295020.25030.401521
25-0.007714-0.06550.473995
26-0.045359-0.38490.350728
27-0.082711-0.70180.242525
28-0.11947-1.01370.157052
29-0.151795-1.2880.100931
30-0.18728-1.58910.058207
31-0.21751-1.84560.034528
32-0.247715-2.10190.019529
33-0.2713-2.30210.012113
34-0.303233-2.5730.006071
35-0.328654-2.78870.003383
36-0.346473-2.93990.002205
37-0.368766-3.12910.001266
38-0.388497-3.29650.000761
39-0.402382-3.41430.000527
40-0.415309-3.5240.000371
41-0.425254-3.60840.000283
42-0.437764-3.71450.000199
43-0.442925-3.75830.000172
44-0.44548-3.780.00016
45-0.446534-3.7890.000156
46-0.445676-3.78170.000159
47-0.442376-3.75370.000175
48-0.436198-3.70130.000208

\begin{tabular}{lllllllll}
\hline
Autocorrelation Function \tabularnewline
Time lag k & ACF(k) & T-STAT & P-value \tabularnewline
1 & 0.959835 & 8.1445 & 0 \tabularnewline
2 & 0.928052 & 7.8748 & 0 \tabularnewline
3 & 0.905329 & 7.682 & 0 \tabularnewline
4 & 0.876038 & 7.4334 & 0 \tabularnewline
5 & 0.840473 & 7.1316 & 0 \tabularnewline
6 & 0.804038 & 6.8225 & 0 \tabularnewline
7 & 0.7677 & 6.5141 & 0 \tabularnewline
8 & 0.72726 & 6.171 & 0 \tabularnewline
9 & 0.687138 & 5.8306 & 0 \tabularnewline
10 & 0.64736 & 5.493 & 0 \tabularnewline
11 & 0.605605 & 5.1387 & 1e-06 \tabularnewline
12 & 0.563585 & 4.7822 & 4e-06 \tabularnewline
13 & 0.514178 & 4.3629 & 2.1e-05 \tabularnewline
14 & 0.463967 & 3.9369 & 9.4e-05 \tabularnewline
15 & 0.419258 & 3.5575 & 0.000333 \tabularnewline
16 & 0.37725 & 3.2011 & 0.001019 \tabularnewline
17 & 0.331708 & 2.8146 & 0.003147 \tabularnewline
18 & 0.287208 & 2.437 & 0.00864 \tabularnewline
19 & 0.24638 & 2.0906 & 0.020047 \tabularnewline
20 & 0.202028 & 1.7143 & 0.045391 \tabularnewline
21 & 0.156714 & 1.3298 & 0.093897 \tabularnewline
22 & 0.118813 & 1.0082 & 0.158377 \tabularnewline
23 & 0.076039 & 0.6452 & 0.260421 \tabularnewline
24 & 0.029502 & 0.2503 & 0.401521 \tabularnewline
25 & -0.007714 & -0.0655 & 0.473995 \tabularnewline
26 & -0.045359 & -0.3849 & 0.350728 \tabularnewline
27 & -0.082711 & -0.7018 & 0.242525 \tabularnewline
28 & -0.11947 & -1.0137 & 0.157052 \tabularnewline
29 & -0.151795 & -1.288 & 0.100931 \tabularnewline
30 & -0.18728 & -1.5891 & 0.058207 \tabularnewline
31 & -0.21751 & -1.8456 & 0.034528 \tabularnewline
32 & -0.247715 & -2.1019 & 0.019529 \tabularnewline
33 & -0.2713 & -2.3021 & 0.012113 \tabularnewline
34 & -0.303233 & -2.573 & 0.006071 \tabularnewline
35 & -0.328654 & -2.7887 & 0.003383 \tabularnewline
36 & -0.346473 & -2.9399 & 0.002205 \tabularnewline
37 & -0.368766 & -3.1291 & 0.001266 \tabularnewline
38 & -0.388497 & -3.2965 & 0.000761 \tabularnewline
39 & -0.402382 & -3.4143 & 0.000527 \tabularnewline
40 & -0.415309 & -3.524 & 0.000371 \tabularnewline
41 & -0.425254 & -3.6084 & 0.000283 \tabularnewline
42 & -0.437764 & -3.7145 & 0.000199 \tabularnewline
43 & -0.442925 & -3.7583 & 0.000172 \tabularnewline
44 & -0.44548 & -3.78 & 0.00016 \tabularnewline
45 & -0.446534 & -3.789 & 0.000156 \tabularnewline
46 & -0.445676 & -3.7817 & 0.000159 \tabularnewline
47 & -0.442376 & -3.7537 & 0.000175 \tabularnewline
48 & -0.436198 & -3.7013 & 0.000208 \tabularnewline
\hline
\end{tabular}
%Source: https://freestatistics.org/blog/index.php?pk=142737&T=1

[TABLE]
[ROW][C]Autocorrelation Function[/C][/ROW]
[ROW][C]Time lag k[/C][C]ACF(k)[/C][C]T-STAT[/C][C]P-value[/C][/ROW]
[ROW][C]1[/C][C]0.959835[/C][C]8.1445[/C][C]0[/C][/ROW]
[ROW][C]2[/C][C]0.928052[/C][C]7.8748[/C][C]0[/C][/ROW]
[ROW][C]3[/C][C]0.905329[/C][C]7.682[/C][C]0[/C][/ROW]
[ROW][C]4[/C][C]0.876038[/C][C]7.4334[/C][C]0[/C][/ROW]
[ROW][C]5[/C][C]0.840473[/C][C]7.1316[/C][C]0[/C][/ROW]
[ROW][C]6[/C][C]0.804038[/C][C]6.8225[/C][C]0[/C][/ROW]
[ROW][C]7[/C][C]0.7677[/C][C]6.5141[/C][C]0[/C][/ROW]
[ROW][C]8[/C][C]0.72726[/C][C]6.171[/C][C]0[/C][/ROW]
[ROW][C]9[/C][C]0.687138[/C][C]5.8306[/C][C]0[/C][/ROW]
[ROW][C]10[/C][C]0.64736[/C][C]5.493[/C][C]0[/C][/ROW]
[ROW][C]11[/C][C]0.605605[/C][C]5.1387[/C][C]1e-06[/C][/ROW]
[ROW][C]12[/C][C]0.563585[/C][C]4.7822[/C][C]4e-06[/C][/ROW]
[ROW][C]13[/C][C]0.514178[/C][C]4.3629[/C][C]2.1e-05[/C][/ROW]
[ROW][C]14[/C][C]0.463967[/C][C]3.9369[/C][C]9.4e-05[/C][/ROW]
[ROW][C]15[/C][C]0.419258[/C][C]3.5575[/C][C]0.000333[/C][/ROW]
[ROW][C]16[/C][C]0.37725[/C][C]3.2011[/C][C]0.001019[/C][/ROW]
[ROW][C]17[/C][C]0.331708[/C][C]2.8146[/C][C]0.003147[/C][/ROW]
[ROW][C]18[/C][C]0.287208[/C][C]2.437[/C][C]0.00864[/C][/ROW]
[ROW][C]19[/C][C]0.24638[/C][C]2.0906[/C][C]0.020047[/C][/ROW]
[ROW][C]20[/C][C]0.202028[/C][C]1.7143[/C][C]0.045391[/C][/ROW]
[ROW][C]21[/C][C]0.156714[/C][C]1.3298[/C][C]0.093897[/C][/ROW]
[ROW][C]22[/C][C]0.118813[/C][C]1.0082[/C][C]0.158377[/C][/ROW]
[ROW][C]23[/C][C]0.076039[/C][C]0.6452[/C][C]0.260421[/C][/ROW]
[ROW][C]24[/C][C]0.029502[/C][C]0.2503[/C][C]0.401521[/C][/ROW]
[ROW][C]25[/C][C]-0.007714[/C][C]-0.0655[/C][C]0.473995[/C][/ROW]
[ROW][C]26[/C][C]-0.045359[/C][C]-0.3849[/C][C]0.350728[/C][/ROW]
[ROW][C]27[/C][C]-0.082711[/C][C]-0.7018[/C][C]0.242525[/C][/ROW]
[ROW][C]28[/C][C]-0.11947[/C][C]-1.0137[/C][C]0.157052[/C][/ROW]
[ROW][C]29[/C][C]-0.151795[/C][C]-1.288[/C][C]0.100931[/C][/ROW]
[ROW][C]30[/C][C]-0.18728[/C][C]-1.5891[/C][C]0.058207[/C][/ROW]
[ROW][C]31[/C][C]-0.21751[/C][C]-1.8456[/C][C]0.034528[/C][/ROW]
[ROW][C]32[/C][C]-0.247715[/C][C]-2.1019[/C][C]0.019529[/C][/ROW]
[ROW][C]33[/C][C]-0.2713[/C][C]-2.3021[/C][C]0.012113[/C][/ROW]
[ROW][C]34[/C][C]-0.303233[/C][C]-2.573[/C][C]0.006071[/C][/ROW]
[ROW][C]35[/C][C]-0.328654[/C][C]-2.7887[/C][C]0.003383[/C][/ROW]
[ROW][C]36[/C][C]-0.346473[/C][C]-2.9399[/C][C]0.002205[/C][/ROW]
[ROW][C]37[/C][C]-0.368766[/C][C]-3.1291[/C][C]0.001266[/C][/ROW]
[ROW][C]38[/C][C]-0.388497[/C][C]-3.2965[/C][C]0.000761[/C][/ROW]
[ROW][C]39[/C][C]-0.402382[/C][C]-3.4143[/C][C]0.000527[/C][/ROW]
[ROW][C]40[/C][C]-0.415309[/C][C]-3.524[/C][C]0.000371[/C][/ROW]
[ROW][C]41[/C][C]-0.425254[/C][C]-3.6084[/C][C]0.000283[/C][/ROW]
[ROW][C]42[/C][C]-0.437764[/C][C]-3.7145[/C][C]0.000199[/C][/ROW]
[ROW][C]43[/C][C]-0.442925[/C][C]-3.7583[/C][C]0.000172[/C][/ROW]
[ROW][C]44[/C][C]-0.44548[/C][C]-3.78[/C][C]0.00016[/C][/ROW]
[ROW][C]45[/C][C]-0.446534[/C][C]-3.789[/C][C]0.000156[/C][/ROW]
[ROW][C]46[/C][C]-0.445676[/C][C]-3.7817[/C][C]0.000159[/C][/ROW]
[ROW][C]47[/C][C]-0.442376[/C][C]-3.7537[/C][C]0.000175[/C][/ROW]
[ROW][C]48[/C][C]-0.436198[/C][C]-3.7013[/C][C]0.000208[/C][/ROW]
[/TABLE]
Source: https://freestatistics.org/blog/index.php?pk=142737&T=1

Globally Unique Identifier (entire table): ba.freestatistics.org/blog/index.php?pk=142737&T=1

As an alternative you can also use a QR Code:  

The GUIDs for individual cells are displayed in the table below:

Autocorrelation Function
Time lag kACF(k)T-STATP-value
10.9598358.14450
20.9280527.87480
30.9053297.6820
40.8760387.43340
50.8404737.13160
60.8040386.82250
70.76776.51410
80.727266.1710
90.6871385.83060
100.647365.4930
110.6056055.13871e-06
120.5635854.78224e-06
130.5141784.36292.1e-05
140.4639673.93699.4e-05
150.4192583.55750.000333
160.377253.20110.001019
170.3317082.81460.003147
180.2872082.4370.00864
190.246382.09060.020047
200.2020281.71430.045391
210.1567141.32980.093897
220.1188131.00820.158377
230.0760390.64520.260421
240.0295020.25030.401521
25-0.007714-0.06550.473995
26-0.045359-0.38490.350728
27-0.082711-0.70180.242525
28-0.11947-1.01370.157052
29-0.151795-1.2880.100931
30-0.18728-1.58910.058207
31-0.21751-1.84560.034528
32-0.247715-2.10190.019529
33-0.2713-2.30210.012113
34-0.303233-2.5730.006071
35-0.328654-2.78870.003383
36-0.346473-2.93990.002205
37-0.368766-3.12910.001266
38-0.388497-3.29650.000761
39-0.402382-3.41430.000527
40-0.415309-3.5240.000371
41-0.425254-3.60840.000283
42-0.437764-3.71450.000199
43-0.442925-3.75830.000172
44-0.44548-3.780.00016
45-0.446534-3.7890.000156
46-0.445676-3.78170.000159
47-0.442376-3.75370.000175
48-0.436198-3.70130.000208


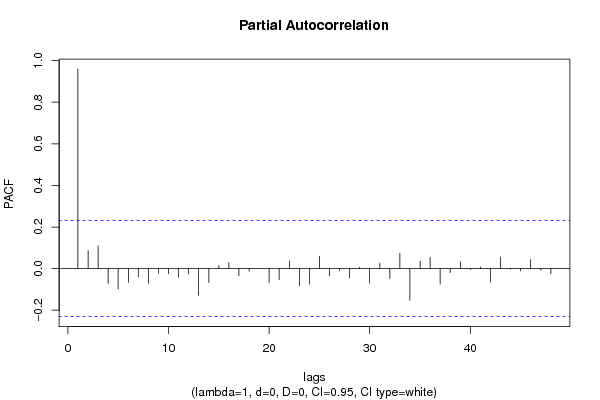
Partial Autocorrelation Function
Time lag kPACF(k)T-STATP-value
10.9598358.14450
20.0859970.72970.233968
30.1102440.93540.176342
4-0.071063-0.6030.274206
5-0.098536-0.83610.202931
6-0.065418-0.55510.290278
7-0.039147-0.33220.370362
8-0.071288-0.60490.273574
9-0.02224-0.18870.425425
10-0.024177-0.20510.419018
11-0.04009-0.34020.367356
12-0.026264-0.22290.412138
13-0.128461-1.090.139668
14-0.066787-0.56670.286339
150.0150490.12770.449372
160.0294210.24960.401785
17-0.033162-0.28140.38961
18-0.012723-0.1080.457166
19-0.000718-0.00610.497577
20-0.066647-0.56550.28674
21-0.052335-0.44410.329161
220.0363380.30830.379357
23-0.081851-0.69450.244792
24-0.074325-0.63070.265128
250.0591390.50180.308666
26-0.0342-0.29020.38625
27-0.010892-0.09240.463309
28-0.044311-0.3760.354014
290.0065110.05520.478048
30-0.068823-0.5840.280528
310.0274190.23270.408343
32-0.046492-0.39450.34719
330.0733330.62220.267872
34-0.152329-1.29260.100148
350.0356480.30250.381579
360.0530340.450.32703
37-0.074729-0.63410.264014
38-0.019281-0.16360.43525
390.0337170.28610.387813
40-0.004859-0.04120.483614
410.0082210.06980.472289
42-0.065216-0.55340.29086
430.0554230.47030.319789
44-0.002886-0.02450.490266
45-0.01106-0.09380.462746
460.0430510.36530.35798
47-0.007709-0.06540.474015
48-0.025303-0.21470.415303

\begin{tabular}{lllllllll}
\hline
Partial Autocorrelation Function \tabularnewline
Time lag k & PACF(k) & T-STAT & P-value \tabularnewline
1 & 0.959835 & 8.1445 & 0 \tabularnewline
2 & 0.085997 & 0.7297 & 0.233968 \tabularnewline
3 & 0.110244 & 0.9354 & 0.176342 \tabularnewline
4 & -0.071063 & -0.603 & 0.274206 \tabularnewline
5 & -0.098536 & -0.8361 & 0.202931 \tabularnewline
6 & -0.065418 & -0.5551 & 0.290278 \tabularnewline
7 & -0.039147 & -0.3322 & 0.370362 \tabularnewline
8 & -0.071288 & -0.6049 & 0.273574 \tabularnewline
9 & -0.02224 & -0.1887 & 0.425425 \tabularnewline
10 & -0.024177 & -0.2051 & 0.419018 \tabularnewline
11 & -0.04009 & -0.3402 & 0.367356 \tabularnewline
12 & -0.026264 & -0.2229 & 0.412138 \tabularnewline
13 & -0.128461 & -1.09 & 0.139668 \tabularnewline
14 & -0.066787 & -0.5667 & 0.286339 \tabularnewline
15 & 0.015049 & 0.1277 & 0.449372 \tabularnewline
16 & 0.029421 & 0.2496 & 0.401785 \tabularnewline
17 & -0.033162 & -0.2814 & 0.38961 \tabularnewline
18 & -0.012723 & -0.108 & 0.457166 \tabularnewline
19 & -0.000718 & -0.0061 & 0.497577 \tabularnewline
20 & -0.066647 & -0.5655 & 0.28674 \tabularnewline
21 & -0.052335 & -0.4441 & 0.329161 \tabularnewline
22 & 0.036338 & 0.3083 & 0.379357 \tabularnewline
23 & -0.081851 & -0.6945 & 0.244792 \tabularnewline
24 & -0.074325 & -0.6307 & 0.265128 \tabularnewline
25 & 0.059139 & 0.5018 & 0.308666 \tabularnewline
26 & -0.0342 & -0.2902 & 0.38625 \tabularnewline
27 & -0.010892 & -0.0924 & 0.463309 \tabularnewline
28 & -0.044311 & -0.376 & 0.354014 \tabularnewline
29 & 0.006511 & 0.0552 & 0.478048 \tabularnewline
30 & -0.068823 & -0.584 & 0.280528 \tabularnewline
31 & 0.027419 & 0.2327 & 0.408343 \tabularnewline
32 & -0.046492 & -0.3945 & 0.34719 \tabularnewline
33 & 0.073333 & 0.6222 & 0.267872 \tabularnewline
34 & -0.152329 & -1.2926 & 0.100148 \tabularnewline
35 & 0.035648 & 0.3025 & 0.381579 \tabularnewline
36 & 0.053034 & 0.45 & 0.32703 \tabularnewline
37 & -0.074729 & -0.6341 & 0.264014 \tabularnewline
38 & -0.019281 & -0.1636 & 0.43525 \tabularnewline
39 & 0.033717 & 0.2861 & 0.387813 \tabularnewline
40 & -0.004859 & -0.0412 & 0.483614 \tabularnewline
41 & 0.008221 & 0.0698 & 0.472289 \tabularnewline
42 & -0.065216 & -0.5534 & 0.29086 \tabularnewline
43 & 0.055423 & 0.4703 & 0.319789 \tabularnewline
44 & -0.002886 & -0.0245 & 0.490266 \tabularnewline
45 & -0.01106 & -0.0938 & 0.462746 \tabularnewline
46 & 0.043051 & 0.3653 & 0.35798 \tabularnewline
47 & -0.007709 & -0.0654 & 0.474015 \tabularnewline
48 & -0.025303 & -0.2147 & 0.415303 \tabularnewline
\hline
\end{tabular}
%Source: https://freestatistics.org/blog/index.php?pk=142737&T=2

[TABLE]
[ROW][C]Partial Autocorrelation Function[/C][/ROW]
[ROW][C]Time lag k[/C][C]PACF(k)[/C][C]T-STAT[/C][C]P-value[/C][/ROW]
[ROW][C]1[/C][C]0.959835[/C][C]8.1445[/C][C]0[/C][/ROW]
[ROW][C]2[/C][C]0.085997[/C][C]0.7297[/C][C]0.233968[/C][/ROW]
[ROW][C]3[/C][C]0.110244[/C][C]0.9354[/C][C]0.176342[/C][/ROW]
[ROW][C]4[/C][C]-0.071063[/C][C]-0.603[/C][C]0.274206[/C][/ROW]
[ROW][C]5[/C][C]-0.098536[/C][C]-0.8361[/C][C]0.202931[/C][/ROW]
[ROW][C]6[/C][C]-0.065418[/C][C]-0.5551[/C][C]0.290278[/C][/ROW]
[ROW][C]7[/C][C]-0.039147[/C][C]-0.3322[/C][C]0.370362[/C][/ROW]
[ROW][C]8[/C][C]-0.071288[/C][C]-0.6049[/C][C]0.273574[/C][/ROW]
[ROW][C]9[/C][C]-0.02224[/C][C]-0.1887[/C][C]0.425425[/C][/ROW]
[ROW][C]10[/C][C]-0.024177[/C][C]-0.2051[/C][C]0.419018[/C][/ROW]
[ROW][C]11[/C][C]-0.04009[/C][C]-0.3402[/C][C]0.367356[/C][/ROW]
[ROW][C]12[/C][C]-0.026264[/C][C]-0.2229[/C][C]0.412138[/C][/ROW]
[ROW][C]13[/C][C]-0.128461[/C][C]-1.09[/C][C]0.139668[/C][/ROW]
[ROW][C]14[/C][C]-0.066787[/C][C]-0.5667[/C][C]0.286339[/C][/ROW]
[ROW][C]15[/C][C]0.015049[/C][C]0.1277[/C][C]0.449372[/C][/ROW]
[ROW][C]16[/C][C]0.029421[/C][C]0.2496[/C][C]0.401785[/C][/ROW]
[ROW][C]17[/C][C]-0.033162[/C][C]-0.2814[/C][C]0.38961[/C][/ROW]
[ROW][C]18[/C][C]-0.012723[/C][C]-0.108[/C][C]0.457166[/C][/ROW]
[ROW][C]19[/C][C]-0.000718[/C][C]-0.0061[/C][C]0.497577[/C][/ROW]
[ROW][C]20[/C][C]-0.066647[/C][C]-0.5655[/C][C]0.28674[/C][/ROW]
[ROW][C]21[/C][C]-0.052335[/C][C]-0.4441[/C][C]0.329161[/C][/ROW]
[ROW][C]22[/C][C]0.036338[/C][C]0.3083[/C][C]0.379357[/C][/ROW]
[ROW][C]23[/C][C]-0.081851[/C][C]-0.6945[/C][C]0.244792[/C][/ROW]
[ROW][C]24[/C][C]-0.074325[/C][C]-0.6307[/C][C]0.265128[/C][/ROW]
[ROW][C]25[/C][C]0.059139[/C][C]0.5018[/C][C]0.308666[/C][/ROW]
[ROW][C]26[/C][C]-0.0342[/C][C]-0.2902[/C][C]0.38625[/C][/ROW]
[ROW][C]27[/C][C]-0.010892[/C][C]-0.0924[/C][C]0.463309[/C][/ROW]
[ROW][C]28[/C][C]-0.044311[/C][C]-0.376[/C][C]0.354014[/C][/ROW]
[ROW][C]29[/C][C]0.006511[/C][C]0.0552[/C][C]0.478048[/C][/ROW]
[ROW][C]30[/C][C]-0.068823[/C][C]-0.584[/C][C]0.280528[/C][/ROW]
[ROW][C]31[/C][C]0.027419[/C][C]0.2327[/C][C]0.408343[/C][/ROW]
[ROW][C]32[/C][C]-0.046492[/C][C]-0.3945[/C][C]0.34719[/C][/ROW]
[ROW][C]33[/C][C]0.073333[/C][C]0.6222[/C][C]0.267872[/C][/ROW]
[ROW][C]34[/C][C]-0.152329[/C][C]-1.2926[/C][C]0.100148[/C][/ROW]
[ROW][C]35[/C][C]0.035648[/C][C]0.3025[/C][C]0.381579[/C][/ROW]
[ROW][C]36[/C][C]0.053034[/C][C]0.45[/C][C]0.32703[/C][/ROW]
[ROW][C]37[/C][C]-0.074729[/C][C]-0.6341[/C][C]0.264014[/C][/ROW]
[ROW][C]38[/C][C]-0.019281[/C][C]-0.1636[/C][C]0.43525[/C][/ROW]
[ROW][C]39[/C][C]0.033717[/C][C]0.2861[/C][C]0.387813[/C][/ROW]
[ROW][C]40[/C][C]-0.004859[/C][C]-0.0412[/C][C]0.483614[/C][/ROW]
[ROW][C]41[/C][C]0.008221[/C][C]0.0698[/C][C]0.472289[/C][/ROW]
[ROW][C]42[/C][C]-0.065216[/C][C]-0.5534[/C][C]0.29086[/C][/ROW]
[ROW][C]43[/C][C]0.055423[/C][C]0.4703[/C][C]0.319789[/C][/ROW]
[ROW][C]44[/C][C]-0.002886[/C][C]-0.0245[/C][C]0.490266[/C][/ROW]
[ROW][C]45[/C][C]-0.01106[/C][C]-0.0938[/C][C]0.462746[/C][/ROW]
[ROW][C]46[/C][C]0.043051[/C][C]0.3653[/C][C]0.35798[/C][/ROW]
[ROW][C]47[/C][C]-0.007709[/C][C]-0.0654[/C][C]0.474015[/C][/ROW]
[ROW][C]48[/C][C]-0.025303[/C][C]-0.2147[/C][C]0.415303[/C][/ROW]
[/TABLE]
Source: https://freestatistics.org/blog/index.php?pk=142737&T=2

Globally Unique Identifier (entire table): ba.freestatistics.org/blog/index.php?pk=142737&T=2

As an alternative you can also use a QR Code:  

The GUIDs for individual cells are displayed in the table below:

Partial Autocorrelation Function
Time lag kPACF(k)T-STATP-value
10.9598358.14450
20.0859970.72970.233968
30.1102440.93540.176342
4-0.071063-0.6030.274206
5-0.098536-0.83610.202931
6-0.065418-0.55510.290278
7-0.039147-0.33220.370362
8-0.071288-0.60490.273574
9-0.02224-0.18870.425425
10-0.024177-0.20510.419018
11-0.04009-0.34020.367356
12-0.026264-0.22290.412138
13-0.128461-1.090.139668
14-0.066787-0.56670.286339
150.0150490.12770.449372
160.0294210.24960.401785
17-0.033162-0.28140.38961
18-0.012723-0.1080.457166
19-0.000718-0.00610.497577
20-0.066647-0.56550.28674
21-0.052335-0.44410.329161
220.0363380.30830.379357
23-0.081851-0.69450.244792
24-0.074325-0.63070.265128
250.0591390.50180.308666
26-0.0342-0.29020.38625
27-0.010892-0.09240.463309
28-0.044311-0.3760.354014
290.0065110.05520.478048
30-0.068823-0.5840.280528
310.0274190.23270.408343
32-0.046492-0.39450.34719
330.0733330.62220.267872
34-0.152329-1.29260.100148
350.0356480.30250.381579
360.0530340.450.32703
37-0.074729-0.63410.264014
38-0.019281-0.16360.43525
390.0337170.28610.387813
40-0.004859-0.04120.483614
410.0082210.06980.472289
42-0.065216-0.55340.29086
430.0554230.47030.319789
44-0.002886-0.02450.490266
45-0.01106-0.09380.462746
460.0430510.36530.35798
47-0.007709-0.06540.474015
48-0.025303-0.21470.415303


Parameters (Session):
par1 = 48 ; par2 = 1 ; par3 = 0 ; par4 = 0 ; par5 = 12 ; par6 = White Noise ; par7 = 0.95 ;
Parameters (R input):
par1 = 48 ; par2 = 1 ; par3 = 0 ; par4 = 0 ; par5 = 12 ; par6 = White Noise ; par7 = 0.95 ; par8 = ;
R code (references can be found in the software module):
if (par1 == 'Default') {
par1 = 10*log10(length(x))
} else {
par1 <- as.numeric(par1)
}
par2 <- as.numeric(par2)
par3 <- as.numeric(par3)
par4 <- as.numeric(par4)
par5 <- as.numeric(par5)
if (par6 == 'White Noise') par6 <- 'white' else par6 <- 'ma'
par7 <- as.numeric(par7)
if (par8 != '') par8 <- as.numeric(par8)
ox <- x
if (par8 == '') {
if (par2 == 0) {
x <- log(x)
} else {
x <- (x ^ par2 - 1) / par2
}
} else {
x <- log(x,base=par8)
}
if (par3 > 0) x <- diff(x,lag=1,difference=par3)
if (par4 > 0) x <- diff(x,lag=par5,difference=par4)
bitmap(file='picts.png')
op <- par(mfrow=c(2,1))
plot(ox,type='l',main='Original Time Series',xlab='time',ylab='value')
if (par8=='') {
mytitle <- paste('Working Time Series (lambda=',par2,', d=',par3,', D=',par4,')',sep='')
mysub <- paste('(lambda=',par2,', d=',par3,', D=',par4,', CI=', par7, ', CI type=',par6,')',sep='')
} else {
mytitle <- paste('Working Time Series (base=',par8,', d=',par3,', D=',par4,')',sep='')
mysub <- paste('(base=',par8,', d=',par3,', D=',par4,', CI=', par7, ', CI type=',par6,')',sep='')
}
plot(x,type='l', main=mytitle,xlab='time',ylab='value')
par(op)
dev.off()
bitmap(file='pic1.png')
racf <- acf(x, par1, main='Autocorrelation', xlab='time lag', ylab='ACF', ci.type=par6, ci=par7, sub=mysub)
dev.off()
bitmap(file='pic2.png')
rpacf <- pacf(x,par1,main='Partial Autocorrelation',xlab='lags',ylab='PACF',sub=mysub)
dev.off()
(myacf <- c(racf$acf))
(mypacf <- c(rpacf$acf))
lengthx <- length(x)
sqrtn <- sqrt(lengthx)
load(file='createtable')
a<-table.start()
a<-table.row.start(a)
a<-table.element(a,'Autocorrelation Function',4,TRUE)
a<-table.row.end(a)
a<-table.row.start(a)
a<-table.element(a,'Time lag k',header=TRUE)
a<-table.element(a,hyperlink('basics.htm','ACF(k)','click here for more information about the Autocorrelation Function'),header=TRUE)
a<-table.element(a,'T-STAT',header=TRUE)
a<-table.element(a,'P-value',header=TRUE)
a<-table.row.end(a)
for (i in 2:(par1+1)) {
a<-table.row.start(a)
a<-table.element(a,i-1,header=TRUE)
a<-table.element(a,round(myacf[i],6))
mytstat <- myacf[i]*sqrtn
a<-table.element(a,round(mytstat,4))
a<-table.element(a,round(1-pt(abs(mytstat),lengthx),6))
a<-table.row.end(a)
}
a<-table.end(a)
table.save(a,file='mytable.tab')
a<-table.start()
a<-table.row.start(a)
a<-table.element(a,'Partial Autocorrelation Function',4,TRUE)
a<-table.row.end(a)
a<-table.row.start(a)
a<-table.element(a,'Time lag k',header=TRUE)
a<-table.element(a,hyperlink('basics.htm','PACF(k)','click here for more information about the Partial Autocorrelation Function'),header=TRUE)
a<-table.element(a,'T-STAT',header=TRUE)
a<-table.element(a,'P-value',header=TRUE)
a<-table.row.end(a)
for (i in 1:par1) {
a<-table.row.start(a)
a<-table.element(a,i,header=TRUE)
a<-table.element(a,round(mypacf[i],6))
mytstat <- mypacf[i]*sqrtn
a<-table.element(a,round(mytstat,4))
a<-table.element(a,round(1-pt(abs(mytstat),lengthx),6))
a<-table.row.end(a)
}
a<-table.end(a)
table.save(a,file='mytable1.tab')