| Tabulation of Results | ||||
| Separate x Depression | ||||
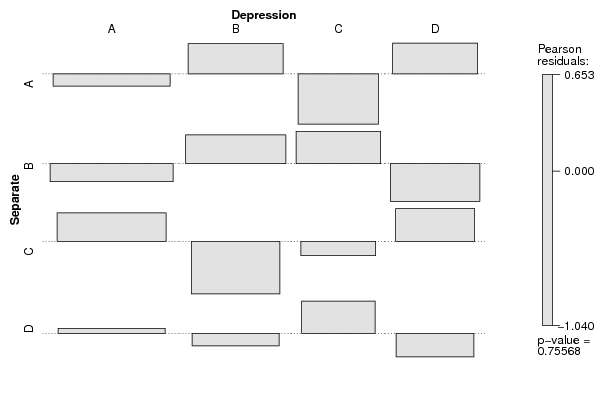
| A | B | C | D | A | 13 | 11 | 4 | 9 | B | 14 | 12 | 9 | 6 | C | 14 | 5 | 5 | 8 | D | 12 | 7 | 7 | 5 |
| Tabulation of Expected Results | ||||
| Separate x Depression | ||||
| A | B | C | D | A | 13.91 | 9.18 | 6.56 | 7.35 | B | 15.41 | 10.18 | 7.27 | 8.14 | C | 12.03 | 7.94 | 5.67 | 6.35 | D | 11.65 | 7.7 | 5.5 | 6.16 |
| Statistical Results | |
| Pearson's Chi-squared test | |
| Pearson Chi Square Statistic | 5.84 |
| Degrees of Freedom | 9 |
| P value | 0.76 |