| Tabulation of Results | ||||
| Depression x belonging | ||||
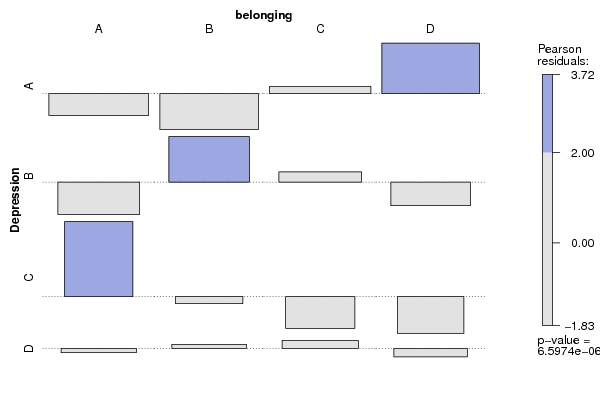
| A | B | C | D | A | 11 | 8 | 17 | 24 | B | 5 | 17 | 12 | 6 | C | 17 | 6 | 3 | 2 | D | 8 | 9 | 10 | 7 |
| Tabulation of Expected Results | ||||
| Depression x belonging | ||||
| A | B | C | D | A | 15.19 | 14.81 | 15.56 | 14.44 | B | 10.12 | 9.88 | 10.37 | 9.63 | C | 7.09 | 6.91 | 7.26 | 6.74 | D | 8.6 | 8.4 | 8.81 | 8.19 |
| Statistical Results | |
| Pearson's Chi-squared test | |
| Pearson Chi Square Statistic | 40.34 |
| Degrees of Freedom | 9 |
| P value | 0 |