| Tabulation of Results | ||
| depression x connected | ||
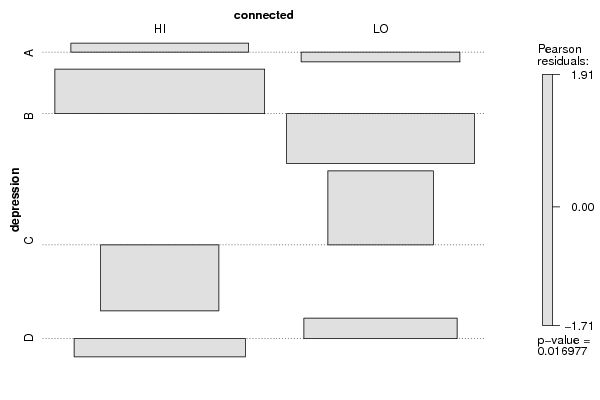
| HI | LO | A | 25 | 18 | B | 40 | 20 | C | 5 | 14 | D | 20 | 20 |
| Tabulation of Expected Results | ||
| depression x connected | ||
| HI | LO | A | 23.89 | 19.11 | B | 33.33 | 26.67 | C | 10.56 | 8.44 | D | 22.22 | 17.78 |
| Statistical Results | |
| Pearson's Chi-squared test with simulated p-value (based on 2000 replicates) | |
| Exact Pearson Chi Square Statistic | 10.2 |
| P value | 0.02 |