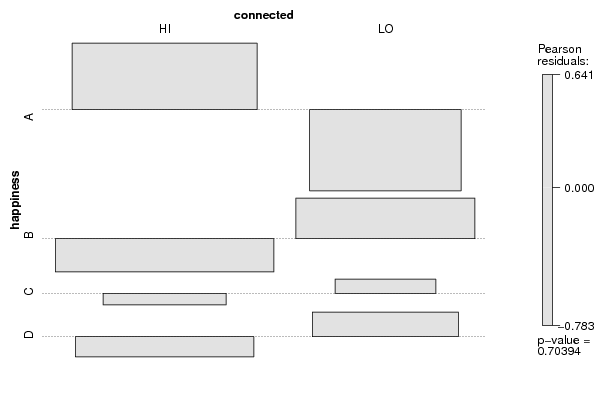
| Tabulation of Results | ||
| happiness x connected | ||
| HI | LO | A | 29 | 14 | B | 34 | 26 | C | 11 | 8 | D | 23 | 17 |
| Tabulation of Expected Results | ||
| happiness x connected | ||
| HI | LO | A | 25.75 | 17.25 | B | 35.93 | 24.07 | C | 11.38 | 7.62 | D | 23.95 | 16.05 |
| Statistical Results | |
| Pearson's Chi-squared test with simulated p-value (based on 2000 replicates) | |
| Exact Pearson Chi Square Statistic | 1.41 |
| P value | 0.7 |