Free Statistics

of Irreproducible Research!

Author's title

Author*Unverified author*
R Software Modulerwasp_autocorrelation.wasp
Title produced by software(Partial) Autocorrelation Function
Date of computationMon, 14 Nov 2011 11:48:44 -0500
Cite this page as followsStatistical Computations at FreeStatistics.org, Office for Research Development and Education, URL https://freestatistics.org/blog/index.php?v=date/2011/Nov/14/t1321289394q3mvdcemfrnuoct.htm/, Retrieved Fri, 19 Apr 2024 15:06:09 +0000
Statistical Computations at FreeStatistics.org, Office for Research Development and Education, URL https://freestatistics.org/blog/index.php?pk=142082, Retrieved Fri, 19 Apr 2024 15:06:09 +0000
QR Codes:

Original text written by user:
IsPrivate?No (this computation is public)
User-defined keywordsKDGP2W12
Estimated Impact74
Family? (F = Feedback message, R = changed R code, M = changed R Module, P = changed Parameters, D = changed Data)
-       [(Partial) Autocorrelation Function] [] [2011-11-14 16:48:44] [e0466c781e396ede6f5f4647349698a6] [Current]
Feedback Forum

Post a new message
Dataseries X:
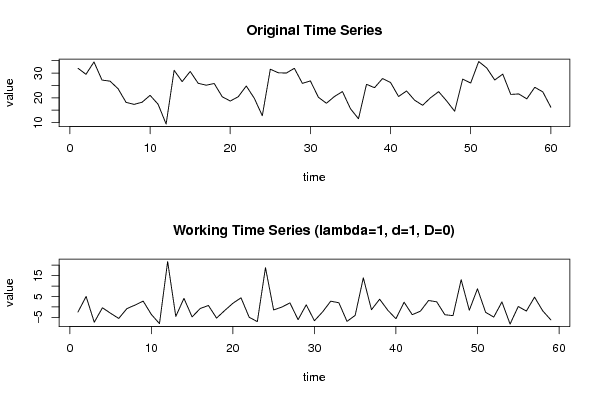
31.956
29.506
34.506
27.165
26.736
23.691
18.157
17.328
18.205
20.995
17.382
9.367
31.124
26.551
30.651
25.859
25.100
25.778
20.418
18.688
20.424
24.776
19.814
12.738
31.566
30.111
30.019
31.934
25.826
26.835
20.205
17.789
20.520
22.518
15.572
11.509
25.447
24.090
27.786
26.195
20.516
22.759
19.028
16.971
20.036
22.485
18.730
14.538
27.561
25.985
34.670
32.066
27.186
29.586
21.359
21.553
19.573
24.256
22.380
16.167


Summary of computational transaction
Raw Inputview raw input (R code)
Raw Outputview raw output of R engine
Computing time1 seconds
R Server'Gertrude Mary Cox' @ cox.wessa.net

\begin{tabular}{lllllllll}
\hline
Summary of computational transaction \tabularnewline
Raw Input & view raw input (R code)  \tabularnewline
Raw Output & view raw output of R engine  \tabularnewline
Computing time & 1 seconds \tabularnewline
R Server & 'Gertrude Mary Cox' @ cox.wessa.net \tabularnewline
\hline
\end{tabular}
%Source: https://freestatistics.org/blog/index.php?pk=142082&T=0

[TABLE]
[ROW][C]Summary of computational transaction[/C][/ROW]
[ROW][C]Raw Input[/C][C]view raw input (R code) [/C][/ROW]
[ROW][C]Raw Output[/C][C]view raw output of R engine [/C][/ROW]
[ROW][C]Computing time[/C][C]1 seconds[/C][/ROW]
[ROW][C]R Server[/C][C]'Gertrude Mary Cox' @ cox.wessa.net[/C][/ROW]
[/TABLE]
Source: https://freestatistics.org/blog/index.php?pk=142082&T=0

Globally Unique Identifier (entire table): ba.freestatistics.org/blog/index.php?pk=142082&T=0

As an alternative you can also use a QR Code:  

The GUIDs for individual cells are displayed in the table below:

Summary of computational transaction
Raw Inputview raw input (R code)
Raw Outputview raw output of R engine
Computing time1 seconds
R Server'Gertrude Mary Cox' @ cox.wessa.net


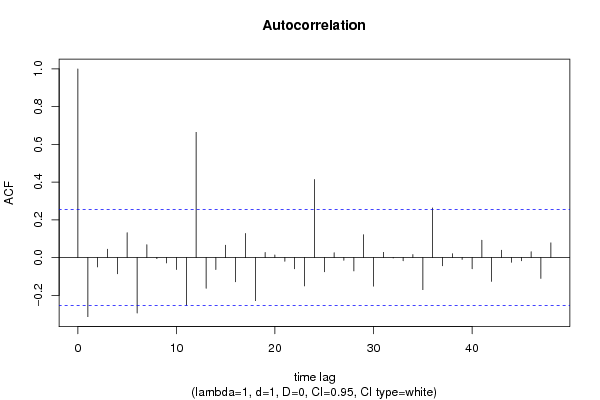
Autocorrelation Function
Time lag kACF(k)T-STATP-value
1-0.313433-2.40750.009604
2-0.049443-0.37980.352736
30.0438110.33650.368837
4-0.085748-0.65860.256344
50.1315141.01020.158268
6-0.293786-2.25660.013875
70.0679510.52190.301831
8-0.005943-0.04570.481871
9-0.028515-0.2190.413691
10-0.063449-0.48740.313904
11-0.253298-1.94560.028235
120.6637075.0982e-06
13-0.163304-1.25440.107329
14-0.063752-0.48970.313085
150.0649010.49850.309989
16-0.128411-0.98630.163995
170.1275580.97980.165594
18-0.228378-1.75420.042294
190.0268220.2060.41874
200.0137030.10530.458264
21-0.019571-0.15030.440509
22-0.059506-0.45710.324649
23-0.150184-1.15360.126661
240.4141223.18090.00117
25-0.075694-0.58140.281586
260.0250220.19220.424123
27-0.014861-0.11410.454753
28-0.070946-0.54490.293923
290.1205370.92590.179146
30-0.1515-1.16370.124616
310.0273430.210.417186
32-0.002813-0.02160.491418
33-0.016659-0.1280.449307
340.0155940.11980.452533
35-0.170248-1.30770.098024
360.262992.02010.023962
37-0.043646-0.33520.369313
380.0201550.15480.43875
39-0.009942-0.07640.469692
40-0.059507-0.45710.324646
410.0918190.70530.241708
42-0.12663-0.97270.167346
430.0387910.2980.383392
44-0.025409-0.19520.422965
45-0.017091-0.13130.448
460.0307620.23630.407013
47-0.110517-0.84890.199685
480.0780170.59930.275648

\begin{tabular}{lllllllll}
\hline
Autocorrelation Function \tabularnewline
Time lag k & ACF(k) & T-STAT & P-value \tabularnewline
1 & -0.313433 & -2.4075 & 0.009604 \tabularnewline
2 & -0.049443 & -0.3798 & 0.352736 \tabularnewline
3 & 0.043811 & 0.3365 & 0.368837 \tabularnewline
4 & -0.085748 & -0.6586 & 0.256344 \tabularnewline
5 & 0.131514 & 1.0102 & 0.158268 \tabularnewline
6 & -0.293786 & -2.2566 & 0.013875 \tabularnewline
7 & 0.067951 & 0.5219 & 0.301831 \tabularnewline
8 & -0.005943 & -0.0457 & 0.481871 \tabularnewline
9 & -0.028515 & -0.219 & 0.413691 \tabularnewline
10 & -0.063449 & -0.4874 & 0.313904 \tabularnewline
11 & -0.253298 & -1.9456 & 0.028235 \tabularnewline
12 & 0.663707 & 5.098 & 2e-06 \tabularnewline
13 & -0.163304 & -1.2544 & 0.107329 \tabularnewline
14 & -0.063752 & -0.4897 & 0.313085 \tabularnewline
15 & 0.064901 & 0.4985 & 0.309989 \tabularnewline
16 & -0.128411 & -0.9863 & 0.163995 \tabularnewline
17 & 0.127558 & 0.9798 & 0.165594 \tabularnewline
18 & -0.228378 & -1.7542 & 0.042294 \tabularnewline
19 & 0.026822 & 0.206 & 0.41874 \tabularnewline
20 & 0.013703 & 0.1053 & 0.458264 \tabularnewline
21 & -0.019571 & -0.1503 & 0.440509 \tabularnewline
22 & -0.059506 & -0.4571 & 0.324649 \tabularnewline
23 & -0.150184 & -1.1536 & 0.126661 \tabularnewline
24 & 0.414122 & 3.1809 & 0.00117 \tabularnewline
25 & -0.075694 & -0.5814 & 0.281586 \tabularnewline
26 & 0.025022 & 0.1922 & 0.424123 \tabularnewline
27 & -0.014861 & -0.1141 & 0.454753 \tabularnewline
28 & -0.070946 & -0.5449 & 0.293923 \tabularnewline
29 & 0.120537 & 0.9259 & 0.179146 \tabularnewline
30 & -0.1515 & -1.1637 & 0.124616 \tabularnewline
31 & 0.027343 & 0.21 & 0.417186 \tabularnewline
32 & -0.002813 & -0.0216 & 0.491418 \tabularnewline
33 & -0.016659 & -0.128 & 0.449307 \tabularnewline
34 & 0.015594 & 0.1198 & 0.452533 \tabularnewline
35 & -0.170248 & -1.3077 & 0.098024 \tabularnewline
36 & 0.26299 & 2.0201 & 0.023962 \tabularnewline
37 & -0.043646 & -0.3352 & 0.369313 \tabularnewline
38 & 0.020155 & 0.1548 & 0.43875 \tabularnewline
39 & -0.009942 & -0.0764 & 0.469692 \tabularnewline
40 & -0.059507 & -0.4571 & 0.324646 \tabularnewline
41 & 0.091819 & 0.7053 & 0.241708 \tabularnewline
42 & -0.12663 & -0.9727 & 0.167346 \tabularnewline
43 & 0.038791 & 0.298 & 0.383392 \tabularnewline
44 & -0.025409 & -0.1952 & 0.422965 \tabularnewline
45 & -0.017091 & -0.1313 & 0.448 \tabularnewline
46 & 0.030762 & 0.2363 & 0.407013 \tabularnewline
47 & -0.110517 & -0.8489 & 0.199685 \tabularnewline
48 & 0.078017 & 0.5993 & 0.275648 \tabularnewline
\hline
\end{tabular}
%Source: https://freestatistics.org/blog/index.php?pk=142082&T=1

[TABLE]
[ROW][C]Autocorrelation Function[/C][/ROW]
[ROW][C]Time lag k[/C][C]ACF(k)[/C][C]T-STAT[/C][C]P-value[/C][/ROW]
[ROW][C]1[/C][C]-0.313433[/C][C]-2.4075[/C][C]0.009604[/C][/ROW]
[ROW][C]2[/C][C]-0.049443[/C][C]-0.3798[/C][C]0.352736[/C][/ROW]
[ROW][C]3[/C][C]0.043811[/C][C]0.3365[/C][C]0.368837[/C][/ROW]
[ROW][C]4[/C][C]-0.085748[/C][C]-0.6586[/C][C]0.256344[/C][/ROW]
[ROW][C]5[/C][C]0.131514[/C][C]1.0102[/C][C]0.158268[/C][/ROW]
[ROW][C]6[/C][C]-0.293786[/C][C]-2.2566[/C][C]0.013875[/C][/ROW]
[ROW][C]7[/C][C]0.067951[/C][C]0.5219[/C][C]0.301831[/C][/ROW]
[ROW][C]8[/C][C]-0.005943[/C][C]-0.0457[/C][C]0.481871[/C][/ROW]
[ROW][C]9[/C][C]-0.028515[/C][C]-0.219[/C][C]0.413691[/C][/ROW]
[ROW][C]10[/C][C]-0.063449[/C][C]-0.4874[/C][C]0.313904[/C][/ROW]
[ROW][C]11[/C][C]-0.253298[/C][C]-1.9456[/C][C]0.028235[/C][/ROW]
[ROW][C]12[/C][C]0.663707[/C][C]5.098[/C][C]2e-06[/C][/ROW]
[ROW][C]13[/C][C]-0.163304[/C][C]-1.2544[/C][C]0.107329[/C][/ROW]
[ROW][C]14[/C][C]-0.063752[/C][C]-0.4897[/C][C]0.313085[/C][/ROW]
[ROW][C]15[/C][C]0.064901[/C][C]0.4985[/C][C]0.309989[/C][/ROW]
[ROW][C]16[/C][C]-0.128411[/C][C]-0.9863[/C][C]0.163995[/C][/ROW]
[ROW][C]17[/C][C]0.127558[/C][C]0.9798[/C][C]0.165594[/C][/ROW]
[ROW][C]18[/C][C]-0.228378[/C][C]-1.7542[/C][C]0.042294[/C][/ROW]
[ROW][C]19[/C][C]0.026822[/C][C]0.206[/C][C]0.41874[/C][/ROW]
[ROW][C]20[/C][C]0.013703[/C][C]0.1053[/C][C]0.458264[/C][/ROW]
[ROW][C]21[/C][C]-0.019571[/C][C]-0.1503[/C][C]0.440509[/C][/ROW]
[ROW][C]22[/C][C]-0.059506[/C][C]-0.4571[/C][C]0.324649[/C][/ROW]
[ROW][C]23[/C][C]-0.150184[/C][C]-1.1536[/C][C]0.126661[/C][/ROW]
[ROW][C]24[/C][C]0.414122[/C][C]3.1809[/C][C]0.00117[/C][/ROW]
[ROW][C]25[/C][C]-0.075694[/C][C]-0.5814[/C][C]0.281586[/C][/ROW]
[ROW][C]26[/C][C]0.025022[/C][C]0.1922[/C][C]0.424123[/C][/ROW]
[ROW][C]27[/C][C]-0.014861[/C][C]-0.1141[/C][C]0.454753[/C][/ROW]
[ROW][C]28[/C][C]-0.070946[/C][C]-0.5449[/C][C]0.293923[/C][/ROW]
[ROW][C]29[/C][C]0.120537[/C][C]0.9259[/C][C]0.179146[/C][/ROW]
[ROW][C]30[/C][C]-0.1515[/C][C]-1.1637[/C][C]0.124616[/C][/ROW]
[ROW][C]31[/C][C]0.027343[/C][C]0.21[/C][C]0.417186[/C][/ROW]
[ROW][C]32[/C][C]-0.002813[/C][C]-0.0216[/C][C]0.491418[/C][/ROW]
[ROW][C]33[/C][C]-0.016659[/C][C]-0.128[/C][C]0.449307[/C][/ROW]
[ROW][C]34[/C][C]0.015594[/C][C]0.1198[/C][C]0.452533[/C][/ROW]
[ROW][C]35[/C][C]-0.170248[/C][C]-1.3077[/C][C]0.098024[/C][/ROW]
[ROW][C]36[/C][C]0.26299[/C][C]2.0201[/C][C]0.023962[/C][/ROW]
[ROW][C]37[/C][C]-0.043646[/C][C]-0.3352[/C][C]0.369313[/C][/ROW]
[ROW][C]38[/C][C]0.020155[/C][C]0.1548[/C][C]0.43875[/C][/ROW]
[ROW][C]39[/C][C]-0.009942[/C][C]-0.0764[/C][C]0.469692[/C][/ROW]
[ROW][C]40[/C][C]-0.059507[/C][C]-0.4571[/C][C]0.324646[/C][/ROW]
[ROW][C]41[/C][C]0.091819[/C][C]0.7053[/C][C]0.241708[/C][/ROW]
[ROW][C]42[/C][C]-0.12663[/C][C]-0.9727[/C][C]0.167346[/C][/ROW]
[ROW][C]43[/C][C]0.038791[/C][C]0.298[/C][C]0.383392[/C][/ROW]
[ROW][C]44[/C][C]-0.025409[/C][C]-0.1952[/C][C]0.422965[/C][/ROW]
[ROW][C]45[/C][C]-0.017091[/C][C]-0.1313[/C][C]0.448[/C][/ROW]
[ROW][C]46[/C][C]0.030762[/C][C]0.2363[/C][C]0.407013[/C][/ROW]
[ROW][C]47[/C][C]-0.110517[/C][C]-0.8489[/C][C]0.199685[/C][/ROW]
[ROW][C]48[/C][C]0.078017[/C][C]0.5993[/C][C]0.275648[/C][/ROW]
[/TABLE]
Source: https://freestatistics.org/blog/index.php?pk=142082&T=1

Globally Unique Identifier (entire table): ba.freestatistics.org/blog/index.php?pk=142082&T=1

As an alternative you can also use a QR Code:  

The GUIDs for individual cells are displayed in the table below:

Autocorrelation Function
Time lag kACF(k)T-STATP-value
1-0.313433-2.40750.009604
2-0.049443-0.37980.352736
30.0438110.33650.368837
4-0.085748-0.65860.256344
50.1315141.01020.158268
6-0.293786-2.25660.013875
70.0679510.52190.301831
8-0.005943-0.04570.481871
9-0.028515-0.2190.413691
10-0.063449-0.48740.313904
11-0.253298-1.94560.028235
120.6637075.0982e-06
13-0.163304-1.25440.107329
14-0.063752-0.48970.313085
150.0649010.49850.309989
16-0.128411-0.98630.163995
170.1275580.97980.165594
18-0.228378-1.75420.042294
190.0268220.2060.41874
200.0137030.10530.458264
21-0.019571-0.15030.440509
22-0.059506-0.45710.324649
23-0.150184-1.15360.126661
240.4141223.18090.00117
25-0.075694-0.58140.281586
260.0250220.19220.424123
27-0.014861-0.11410.454753
28-0.070946-0.54490.293923
290.1205370.92590.179146
30-0.1515-1.16370.124616
310.0273430.210.417186
32-0.002813-0.02160.491418
33-0.016659-0.1280.449307
340.0155940.11980.452533
35-0.170248-1.30770.098024
360.262992.02010.023962
37-0.043646-0.33520.369313
380.0201550.15480.43875
39-0.009942-0.07640.469692
40-0.059507-0.45710.324646
410.0918190.70530.241708
42-0.12663-0.97270.167346
430.0387910.2980.383392
44-0.025409-0.19520.422965
45-0.017091-0.13130.448
460.0307620.23630.407013
47-0.110517-0.84890.199685
480.0780170.59930.275648


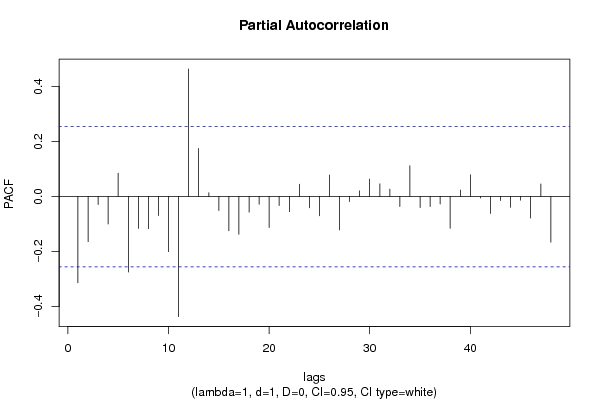
Partial Autocorrelation Function
Time lag kPACF(k)T-STATP-value
1-0.313433-2.40750.009604
2-0.163772-1.2580.106682
3-0.029121-0.22370.411889
4-0.099573-0.76480.22371
50.0846770.65040.258975
6-0.274421-2.10790.01965
7-0.115676-0.88850.188933
8-0.117129-0.89970.185973
9-0.069076-0.53060.29885
10-0.200123-1.53720.064798
11-0.436402-3.35210.000702
120.4635233.56040.00037
130.1743111.33890.092868
140.0135540.10410.458717
15-0.051029-0.3920.34825
16-0.124423-0.95570.171558
17-0.137254-1.05430.14803
18-0.056788-0.43620.332144
19-0.02781-0.21360.415792
20-0.112627-0.86510.195243
21-0.032403-0.24890.402156
22-0.054894-0.42170.337406
230.0444550.34150.366983
24-0.040961-0.31460.377077
25-0.069575-0.53440.297531
260.0780.59910.275689
27-0.121259-0.93140.177718
28-0.018348-0.14090.444201
290.0206710.15880.437193
300.0631880.48540.31461
310.0459350.35280.362736
320.0268360.20610.418699
33-0.036508-0.28040.390066
340.111880.85940.196808
35-0.040048-0.30760.37973
36-0.036296-0.27880.390689
37-0.02736-0.21020.417136
38-0.115572-0.88770.189146
390.0234060.17980.428969
400.0787750.60510.273723
41-0.005401-0.04150.483523
42-0.061159-0.46980.320124
43-0.014271-0.10960.456542
44-0.03878-0.29790.383423
45-0.013149-0.1010.459947
46-0.077794-0.59760.276213
470.0452680.34770.364648
48-0.165677-1.27260.104078

\begin{tabular}{lllllllll}
\hline
Partial Autocorrelation Function \tabularnewline
Time lag k & PACF(k) & T-STAT & P-value \tabularnewline
1 & -0.313433 & -2.4075 & 0.009604 \tabularnewline
2 & -0.163772 & -1.258 & 0.106682 \tabularnewline
3 & -0.029121 & -0.2237 & 0.411889 \tabularnewline
4 & -0.099573 & -0.7648 & 0.22371 \tabularnewline
5 & 0.084677 & 0.6504 & 0.258975 \tabularnewline
6 & -0.274421 & -2.1079 & 0.01965 \tabularnewline
7 & -0.115676 & -0.8885 & 0.188933 \tabularnewline
8 & -0.117129 & -0.8997 & 0.185973 \tabularnewline
9 & -0.069076 & -0.5306 & 0.29885 \tabularnewline
10 & -0.200123 & -1.5372 & 0.064798 \tabularnewline
11 & -0.436402 & -3.3521 & 0.000702 \tabularnewline
12 & 0.463523 & 3.5604 & 0.00037 \tabularnewline
13 & 0.174311 & 1.3389 & 0.092868 \tabularnewline
14 & 0.013554 & 0.1041 & 0.458717 \tabularnewline
15 & -0.051029 & -0.392 & 0.34825 \tabularnewline
16 & -0.124423 & -0.9557 & 0.171558 \tabularnewline
17 & -0.137254 & -1.0543 & 0.14803 \tabularnewline
18 & -0.056788 & -0.4362 & 0.332144 \tabularnewline
19 & -0.02781 & -0.2136 & 0.415792 \tabularnewline
20 & -0.112627 & -0.8651 & 0.195243 \tabularnewline
21 & -0.032403 & -0.2489 & 0.402156 \tabularnewline
22 & -0.054894 & -0.4217 & 0.337406 \tabularnewline
23 & 0.044455 & 0.3415 & 0.366983 \tabularnewline
24 & -0.040961 & -0.3146 & 0.377077 \tabularnewline
25 & -0.069575 & -0.5344 & 0.297531 \tabularnewline
26 & 0.078 & 0.5991 & 0.275689 \tabularnewline
27 & -0.121259 & -0.9314 & 0.177718 \tabularnewline
28 & -0.018348 & -0.1409 & 0.444201 \tabularnewline
29 & 0.020671 & 0.1588 & 0.437193 \tabularnewline
30 & 0.063188 & 0.4854 & 0.31461 \tabularnewline
31 & 0.045935 & 0.3528 & 0.362736 \tabularnewline
32 & 0.026836 & 0.2061 & 0.418699 \tabularnewline
33 & -0.036508 & -0.2804 & 0.390066 \tabularnewline
34 & 0.11188 & 0.8594 & 0.196808 \tabularnewline
35 & -0.040048 & -0.3076 & 0.37973 \tabularnewline
36 & -0.036296 & -0.2788 & 0.390689 \tabularnewline
37 & -0.02736 & -0.2102 & 0.417136 \tabularnewline
38 & -0.115572 & -0.8877 & 0.189146 \tabularnewline
39 & 0.023406 & 0.1798 & 0.428969 \tabularnewline
40 & 0.078775 & 0.6051 & 0.273723 \tabularnewline
41 & -0.005401 & -0.0415 & 0.483523 \tabularnewline
42 & -0.061159 & -0.4698 & 0.320124 \tabularnewline
43 & -0.014271 & -0.1096 & 0.456542 \tabularnewline
44 & -0.03878 & -0.2979 & 0.383423 \tabularnewline
45 & -0.013149 & -0.101 & 0.459947 \tabularnewline
46 & -0.077794 & -0.5976 & 0.276213 \tabularnewline
47 & 0.045268 & 0.3477 & 0.364648 \tabularnewline
48 & -0.165677 & -1.2726 & 0.104078 \tabularnewline
\hline
\end{tabular}
%Source: https://freestatistics.org/blog/index.php?pk=142082&T=2

[TABLE]
[ROW][C]Partial Autocorrelation Function[/C][/ROW]
[ROW][C]Time lag k[/C][C]PACF(k)[/C][C]T-STAT[/C][C]P-value[/C][/ROW]
[ROW][C]1[/C][C]-0.313433[/C][C]-2.4075[/C][C]0.009604[/C][/ROW]
[ROW][C]2[/C][C]-0.163772[/C][C]-1.258[/C][C]0.106682[/C][/ROW]
[ROW][C]3[/C][C]-0.029121[/C][C]-0.2237[/C][C]0.411889[/C][/ROW]
[ROW][C]4[/C][C]-0.099573[/C][C]-0.7648[/C][C]0.22371[/C][/ROW]
[ROW][C]5[/C][C]0.084677[/C][C]0.6504[/C][C]0.258975[/C][/ROW]
[ROW][C]6[/C][C]-0.274421[/C][C]-2.1079[/C][C]0.01965[/C][/ROW]
[ROW][C]7[/C][C]-0.115676[/C][C]-0.8885[/C][C]0.188933[/C][/ROW]
[ROW][C]8[/C][C]-0.117129[/C][C]-0.8997[/C][C]0.185973[/C][/ROW]
[ROW][C]9[/C][C]-0.069076[/C][C]-0.5306[/C][C]0.29885[/C][/ROW]
[ROW][C]10[/C][C]-0.200123[/C][C]-1.5372[/C][C]0.064798[/C][/ROW]
[ROW][C]11[/C][C]-0.436402[/C][C]-3.3521[/C][C]0.000702[/C][/ROW]
[ROW][C]12[/C][C]0.463523[/C][C]3.5604[/C][C]0.00037[/C][/ROW]
[ROW][C]13[/C][C]0.174311[/C][C]1.3389[/C][C]0.092868[/C][/ROW]
[ROW][C]14[/C][C]0.013554[/C][C]0.1041[/C][C]0.458717[/C][/ROW]
[ROW][C]15[/C][C]-0.051029[/C][C]-0.392[/C][C]0.34825[/C][/ROW]
[ROW][C]16[/C][C]-0.124423[/C][C]-0.9557[/C][C]0.171558[/C][/ROW]
[ROW][C]17[/C][C]-0.137254[/C][C]-1.0543[/C][C]0.14803[/C][/ROW]
[ROW][C]18[/C][C]-0.056788[/C][C]-0.4362[/C][C]0.332144[/C][/ROW]
[ROW][C]19[/C][C]-0.02781[/C][C]-0.2136[/C][C]0.415792[/C][/ROW]
[ROW][C]20[/C][C]-0.112627[/C][C]-0.8651[/C][C]0.195243[/C][/ROW]
[ROW][C]21[/C][C]-0.032403[/C][C]-0.2489[/C][C]0.402156[/C][/ROW]
[ROW][C]22[/C][C]-0.054894[/C][C]-0.4217[/C][C]0.337406[/C][/ROW]
[ROW][C]23[/C][C]0.044455[/C][C]0.3415[/C][C]0.366983[/C][/ROW]
[ROW][C]24[/C][C]-0.040961[/C][C]-0.3146[/C][C]0.377077[/C][/ROW]
[ROW][C]25[/C][C]-0.069575[/C][C]-0.5344[/C][C]0.297531[/C][/ROW]
[ROW][C]26[/C][C]0.078[/C][C]0.5991[/C][C]0.275689[/C][/ROW]
[ROW][C]27[/C][C]-0.121259[/C][C]-0.9314[/C][C]0.177718[/C][/ROW]
[ROW][C]28[/C][C]-0.018348[/C][C]-0.1409[/C][C]0.444201[/C][/ROW]
[ROW][C]29[/C][C]0.020671[/C][C]0.1588[/C][C]0.437193[/C][/ROW]
[ROW][C]30[/C][C]0.063188[/C][C]0.4854[/C][C]0.31461[/C][/ROW]
[ROW][C]31[/C][C]0.045935[/C][C]0.3528[/C][C]0.362736[/C][/ROW]
[ROW][C]32[/C][C]0.026836[/C][C]0.2061[/C][C]0.418699[/C][/ROW]
[ROW][C]33[/C][C]-0.036508[/C][C]-0.2804[/C][C]0.390066[/C][/ROW]
[ROW][C]34[/C][C]0.11188[/C][C]0.8594[/C][C]0.196808[/C][/ROW]
[ROW][C]35[/C][C]-0.040048[/C][C]-0.3076[/C][C]0.37973[/C][/ROW]
[ROW][C]36[/C][C]-0.036296[/C][C]-0.2788[/C][C]0.390689[/C][/ROW]
[ROW][C]37[/C][C]-0.02736[/C][C]-0.2102[/C][C]0.417136[/C][/ROW]
[ROW][C]38[/C][C]-0.115572[/C][C]-0.8877[/C][C]0.189146[/C][/ROW]
[ROW][C]39[/C][C]0.023406[/C][C]0.1798[/C][C]0.428969[/C][/ROW]
[ROW][C]40[/C][C]0.078775[/C][C]0.6051[/C][C]0.273723[/C][/ROW]
[ROW][C]41[/C][C]-0.005401[/C][C]-0.0415[/C][C]0.483523[/C][/ROW]
[ROW][C]42[/C][C]-0.061159[/C][C]-0.4698[/C][C]0.320124[/C][/ROW]
[ROW][C]43[/C][C]-0.014271[/C][C]-0.1096[/C][C]0.456542[/C][/ROW]
[ROW][C]44[/C][C]-0.03878[/C][C]-0.2979[/C][C]0.383423[/C][/ROW]
[ROW][C]45[/C][C]-0.013149[/C][C]-0.101[/C][C]0.459947[/C][/ROW]
[ROW][C]46[/C][C]-0.077794[/C][C]-0.5976[/C][C]0.276213[/C][/ROW]
[ROW][C]47[/C][C]0.045268[/C][C]0.3477[/C][C]0.364648[/C][/ROW]
[ROW][C]48[/C][C]-0.165677[/C][C]-1.2726[/C][C]0.104078[/C][/ROW]
[/TABLE]
Source: https://freestatistics.org/blog/index.php?pk=142082&T=2

Globally Unique Identifier (entire table): ba.freestatistics.org/blog/index.php?pk=142082&T=2

As an alternative you can also use a QR Code:  

The GUIDs for individual cells are displayed in the table below:

Partial Autocorrelation Function
Time lag kPACF(k)T-STATP-value
1-0.313433-2.40750.009604
2-0.163772-1.2580.106682
3-0.029121-0.22370.411889
4-0.099573-0.76480.22371
50.0846770.65040.258975
6-0.274421-2.10790.01965
7-0.115676-0.88850.188933
8-0.117129-0.89970.185973
9-0.069076-0.53060.29885
10-0.200123-1.53720.064798
11-0.436402-3.35210.000702
120.4635233.56040.00037
130.1743111.33890.092868
140.0135540.10410.458717
15-0.051029-0.3920.34825
16-0.124423-0.95570.171558
17-0.137254-1.05430.14803
18-0.056788-0.43620.332144
19-0.02781-0.21360.415792
20-0.112627-0.86510.195243
21-0.032403-0.24890.402156
22-0.054894-0.42170.337406
230.0444550.34150.366983
24-0.040961-0.31460.377077
25-0.069575-0.53440.297531
260.0780.59910.275689
27-0.121259-0.93140.177718
28-0.018348-0.14090.444201
290.0206710.15880.437193
300.0631880.48540.31461
310.0459350.35280.362736
320.0268360.20610.418699
33-0.036508-0.28040.390066
340.111880.85940.196808
35-0.040048-0.30760.37973
36-0.036296-0.27880.390689
37-0.02736-0.21020.417136
38-0.115572-0.88770.189146
390.0234060.17980.428969
400.0787750.60510.273723
41-0.005401-0.04150.483523
42-0.061159-0.46980.320124
43-0.014271-0.10960.456542
44-0.03878-0.29790.383423
45-0.013149-0.1010.459947
46-0.077794-0.59760.276213
470.0452680.34770.364648
48-0.165677-1.27260.104078


Parameters (Session):
par1 = 48 ; par2 = 1 ; par3 = 1 ; par4 = 0 ; par5 = 12 ; par6 = White Noise ; par7 = 0.95 ;
Parameters (R input):
par1 = 48 ; par2 = 1 ; par3 = 1 ; par4 = 0 ; par5 = 12 ; par6 = White Noise ; par7 = 0.95 ; par8 = ;
R code (references can be found in the software module):
if (par1 == 'Default') {
par1 = 10*log10(length(x))
} else {
par1 <- as.numeric(par1)
}
par2 <- as.numeric(par2)
par3 <- as.numeric(par3)
par4 <- as.numeric(par4)
par5 <- as.numeric(par5)
if (par6 == 'White Noise') par6 <- 'white' else par6 <- 'ma'
par7 <- as.numeric(par7)
if (par8 != '') par8 <- as.numeric(par8)
ox <- x
if (par8 == '') {
if (par2 == 0) {
x <- log(x)
} else {
x <- (x ^ par2 - 1) / par2
}
} else {
x <- log(x,base=par8)
}
if (par3 > 0) x <- diff(x,lag=1,difference=par3)
if (par4 > 0) x <- diff(x,lag=par5,difference=par4)
bitmap(file='picts.png')
op <- par(mfrow=c(2,1))
plot(ox,type='l',main='Original Time Series',xlab='time',ylab='value')
if (par8=='') {
mytitle <- paste('Working Time Series (lambda=',par2,', d=',par3,', D=',par4,')',sep='')
mysub <- paste('(lambda=',par2,', d=',par3,', D=',par4,', CI=', par7, ', CI type=',par6,')',sep='')
} else {
mytitle <- paste('Working Time Series (base=',par8,', d=',par3,', D=',par4,')',sep='')
mysub <- paste('(base=',par8,', d=',par3,', D=',par4,', CI=', par7, ', CI type=',par6,')',sep='')
}
plot(x,type='l', main=mytitle,xlab='time',ylab='value')
par(op)
dev.off()
bitmap(file='pic1.png')
racf <- acf(x, par1, main='Autocorrelation', xlab='time lag', ylab='ACF', ci.type=par6, ci=par7, sub=mysub)
dev.off()
bitmap(file='pic2.png')
rpacf <- pacf(x,par1,main='Partial Autocorrelation',xlab='lags',ylab='PACF',sub=mysub)
dev.off()
(myacf <- c(racf$acf))
(mypacf <- c(rpacf$acf))
lengthx <- length(x)
sqrtn <- sqrt(lengthx)
load(file='createtable')
a<-table.start()
a<-table.row.start(a)
a<-table.element(a,'Autocorrelation Function',4,TRUE)
a<-table.row.end(a)
a<-table.row.start(a)
a<-table.element(a,'Time lag k',header=TRUE)
a<-table.element(a,hyperlink('basics.htm','ACF(k)','click here for more information about the Autocorrelation Function'),header=TRUE)
a<-table.element(a,'T-STAT',header=TRUE)
a<-table.element(a,'P-value',header=TRUE)
a<-table.row.end(a)
for (i in 2:(par1+1)) {
a<-table.row.start(a)
a<-table.element(a,i-1,header=TRUE)
a<-table.element(a,round(myacf[i],6))
mytstat <- myacf[i]*sqrtn
a<-table.element(a,round(mytstat,4))
a<-table.element(a,round(1-pt(abs(mytstat),lengthx),6))
a<-table.row.end(a)
}
a<-table.end(a)
table.save(a,file='mytable.tab')
a<-table.start()
a<-table.row.start(a)
a<-table.element(a,'Partial Autocorrelation Function',4,TRUE)
a<-table.row.end(a)
a<-table.row.start(a)
a<-table.element(a,'Time lag k',header=TRUE)
a<-table.element(a,hyperlink('basics.htm','PACF(k)','click here for more information about the Partial Autocorrelation Function'),header=TRUE)
a<-table.element(a,'T-STAT',header=TRUE)
a<-table.element(a,'P-value',header=TRUE)
a<-table.row.end(a)
for (i in 1:par1) {
a<-table.row.start(a)
a<-table.element(a,i,header=TRUE)
a<-table.element(a,round(mypacf[i],6))
mytstat <- mypacf[i]*sqrtn
a<-table.element(a,round(mytstat,4))
a<-table.element(a,round(1-pt(abs(mytstat),lengthx),6))
a<-table.row.end(a)
}
a<-table.end(a)
table.save(a,file='mytable1.tab')