| Tabulation of Results | ||||
| Behandeling x Score | ||||
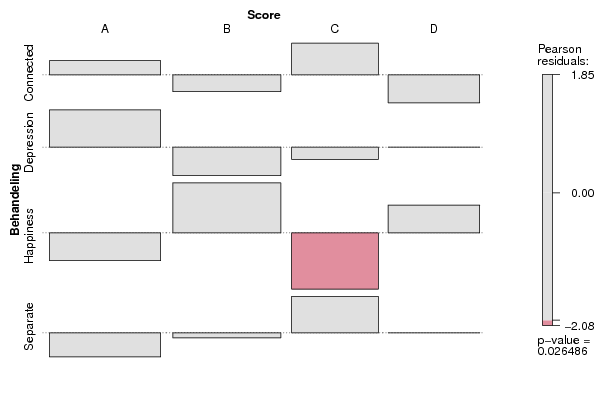
| A | B | C | D | Connected | 54 | 43 | 37 | 28 | Depression | 60 | 40 | 28 | 34 | Happiness | 43 | 60 | 19 | 40 | Separate | 44 | 46 | 38 | 34 |
| Tabulation of Expected Results | ||||
| Behandeling x Score | ||||
| A | B | C | D | Connected | 50.25 | 47.25 | 30.5 | 34 | Depression | 50.25 | 47.25 | 30.5 | 34 | Happiness | 50.25 | 47.25 | 30.5 | 34 | Separate | 50.25 | 47.25 | 30.5 | 34 |
| Statistical Results | |
| Pearson's Chi-squared test | |
| Pearson Chi Square Statistic | 18.85 |
| Degrees of Freedom | 9 |
| P value | 0.03 |