| Tabulation of Results | ||
| Learning x depression | ||
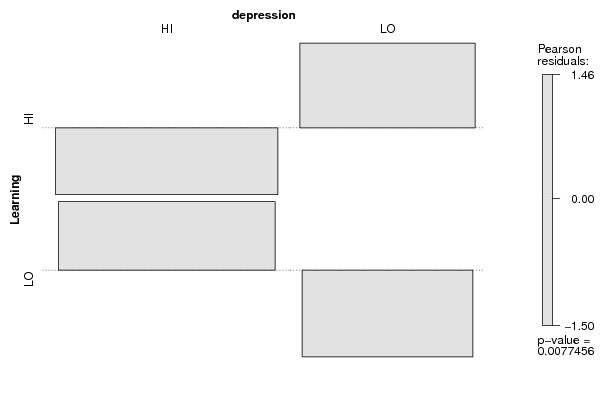
| HI | LO | HI | 43 | 40 | LO | 57 | 22 |
| Tabulation of Expected Results | ||
| Learning x depression | ||
| HI | LO | HI | 51.23 | 31.77 | LO | 48.77 | 30.23 |
| Statistical Results | |
| Pearson's Chi-squared test with Yates' continuity correction | |
| Pearson Chi Square Statistic | 6.26 |
| Degrees of Freedom | 1 |
| P value | 0.01 |