Free Statistics
of Irreproducible Research!
Description of Statistical Computation | |||||||||||||||||||||||||||||||||||||||
|---|---|---|---|---|---|---|---|---|---|---|---|---|---|---|---|---|---|---|---|---|---|---|---|---|---|---|---|---|---|---|---|---|---|---|---|---|---|---|---|
| Author's title | |||||||||||||||||||||||||||||||||||||||
| Author | *The author of this computation has been verified* | ||||||||||||||||||||||||||||||||||||||
| R Software Module | rwasp_fitdistrnorm.wasp | ||||||||||||||||||||||||||||||||||||||
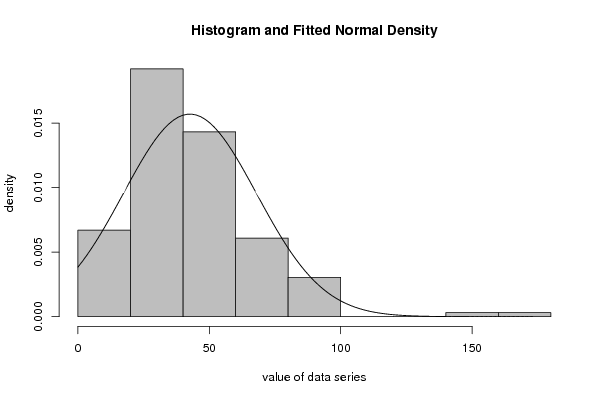
| Title produced by software | Maximum-likelihood Fitting - Normal Distribution | ||||||||||||||||||||||||||||||||||||||
| Date of computation | Mon, 14 Nov 2011 08:58:56 -0500 | ||||||||||||||||||||||||||||||||||||||
| Cite this page as follows | Statistical Computations at FreeStatistics.org, Office for Research Development and Education, URL https://freestatistics.org/blog/index.php?v=date/2011/Nov/14/t1321279167cy8p2ef0ejvggwh.htm/, Retrieved Fri, 18 Jul 2025 23:55:40 +0000 | ||||||||||||||||||||||||||||||||||||||
| Statistical Computations at FreeStatistics.org, Office for Research Development and Education, URL https://freestatistics.org/blog/index.php?pk=141983, Retrieved Fri, 18 Jul 2025 23:55:40 +0000 | |||||||||||||||||||||||||||||||||||||||
| QR Codes: | |||||||||||||||||||||||||||||||||||||||
|
| |||||||||||||||||||||||||||||||||||||||
| Original text written by user: | |||||||||||||||||||||||||||||||||||||||
| IsPrivate? | No (this computation is public) | ||||||||||||||||||||||||||||||||||||||
| User-defined keywords | |||||||||||||||||||||||||||||||||||||||
| Estimated Impact | 225 | ||||||||||||||||||||||||||||||||||||||
Tree of Dependent Computations | |||||||||||||||||||||||||||||||||||||||
| Family? (F = Feedback message, R = changed R code, M = changed R Module, P = changed Parameters, D = changed Data) | |||||||||||||||||||||||||||||||||||||||
| - [Bivariate Data Series] [Bivariate dataset] [2008-01-05 23:51:08] [74be16979710d4c4e7c6647856088456] - RMPD [Blocked Bootstrap Plot - Central Tendency] [Colombia Coffee] [2008-01-07 10:26:26] [74be16979710d4c4e7c6647856088456] - M D [Blocked Bootstrap Plot - Central Tendency] [Notched Boxplots Y] [2011-11-13 10:17:36] [74be16979710d4c4e7c6647856088456] - D [Blocked Bootstrap Plot - Central Tendency] [boxplots X] [2011-11-14 13:57:25] [d9c77998677156eca5bd63e08beb400b] - RMP [Maximum-likelihood Fitting - Normal Distribution] [fitted normal dis...] [2011-11-14 13:58:56] [8432dc408001a08517818ba7ac24bdb0] [Current] | |||||||||||||||||||||||||||||||||||||||
| Feedback Forum | |||||||||||||||||||||||||||||||||||||||
Post a new message | |||||||||||||||||||||||||||||||||||||||
Dataset | |||||||||||||||||||||||||||||||||||||||
| Dataseries X: | |||||||||||||||||||||||||||||||||||||||
39 43 31 62 25 16 68 14 31 22 56 64 36 35 48 95 36 85 33 43 41 49 15 30 71 78 67 47 29 29 49 41 58 18 46 34 75 41 24 93 46 36 39 24 40 83 40 44 58 33 47 23 173 15 54 24 51 86 64 42 76 65 53 47 31 28 72 83 43 25 28 24 35 33 30 40 51 48 33 33 26 56 44 43 25 32 32 92 44 64 40 43 39 47 44 23 25 43 79 65 56 33 94 14 42 85 26 58 28 59 31 49 9 46 23 30 47 16 31 18 64 29 39 25 34 24 39 33 42 57 61 21 24 160 91 12 73 37 25 41 61 66 47 63 60 34 40 60 0 10 1 2 0 0 48 57 0 4 5 20 5 27 2 28 | |||||||||||||||||||||||||||||||||||||||
Tables (Output of Computation) | |||||||||||||||||||||||||||||||||||||||
| |||||||||||||||||||||||||||||||||||||||
Figures (Output of Computation) | |||||||||||||||||||||||||||||||||||||||
Input Parameters & R Code | |||||||||||||||||||||||||||||||||||||||
| Parameters (Session): | |||||||||||||||||||||||||||||||||||||||
| par1 = 8 ; par2 = 0 ; | |||||||||||||||||||||||||||||||||||||||
| Parameters (R input): | |||||||||||||||||||||||||||||||||||||||
| par1 = 8 ; par2 = 0 ; | |||||||||||||||||||||||||||||||||||||||
| R code (references can be found in the software module): | |||||||||||||||||||||||||||||||||||||||
library(MASS) | |||||||||||||||||||||||||||||||||||||||