Free Statistics

of Irreproducible Research!

Author's title

Author*The author of this computation has been verified*
R Software Modulerwasp_linear_regression.wasp
Title produced by softwareLinear Regression Graphical Model Validation
Date of computationSun, 13 Nov 2011 08:00:32 -0500
Cite this page as followsStatistical Computations at FreeStatistics.org, Office for Research Development and Education, URL https://freestatistics.org/blog/index.php?v=date/2011/Nov/13/t1321189243dmxn287901e0jni.htm/, Retrieved Thu, 28 Mar 2024 19:54:17 +0000
Statistical Computations at FreeStatistics.org, Office for Research Development and Education, URL https://freestatistics.org/blog/index.php?pk=141643, Retrieved Thu, 28 Mar 2024 19:54:17 +0000
QR Codes:

Original text written by user:
IsPrivate?No (this computation is public)
User-defined keywords
Estimated Impact76
Family? (F = Feedback message, R = changed R code, M = changed R Module, P = changed Parameters, D = changed Data)
-     [Linear Regression Graphical Model Validation] [Colombia Coffee -...] [2008-02-26 10:22:06] [74be16979710d4c4e7c6647856088456]
-  M D  [Linear Regression Graphical Model Validation] [hypothese test 1 ...] [2011-11-13 12:41:29] [b1eb71d4db1ceb5d347df987feb4a25e]
-    D      [Linear Regression Graphical Model Validation] [] [2011-11-13 13:00:32] [f8ac047da1b1db86cbd9837decfb2b34] [Current]
Feedback Forum

Post a new message
Dataseries X:
38
32
35
33
37
29
31
36
35
38
31
34
35
38
37
33
32
38
38
32
33
31
38
39
32
32
35
37
33
33
28
32
31
37
30
33
31
33
31
33
32
33
32
33
28
35
39
34
38
32
38
30
33
38
32
32
34
34
36
34
28
34
35
35
31
37
35
27
40
37
36
38
39
41
27
30
37
31
31
27
36
38
37
33
34
31
39
34
32
33
36
32
41
28
30
36
35
31
34
36
36
35
37
28
39
32
35
39
35
42
34
33
41
33
34
32
40
40
35
36
37
27
39
38
31
33
32
39
36
33
33
32
37
30
38
29
22
35
35
34
35
34
34
35
23
31
27
36
31
32
39
37
38
39
34
31
32
37
36
32
35
36
Dataseries Y:
12
11
14
12
21
12
22
11
10
13
10
8
15
14
10
14
14
11
10
13
7
14
12
14
11
9
11
15
14
13
9
15
10
11
13
8
20
12
10
10
9
14
8
14
11
13
9
11
15
11
10
14
18
14
11
12
13
9
10
15
20
12
12
14
13
11
17
12
13
14
13
15
13
10
11
19
13
17
13
9
11
10
9
12
12
13
13
12
15
22
13
15
13
15
10
11
16
11
11
10
10
16
12
11
16
19
11
16
15
24
14
15
11
15
12
10
14
13
9
15
15
14
11
8
11
11
8
10
11
13
11
20
10
15
12
14
23
14
16
11
12
10
14
12
12
11
12
13
11
19
12
17
9
12
19
18
15
14
11
9
18
16


Summary of computational transaction
Raw Inputview raw input (R code)
Raw Outputview raw output of R engine
Computing time4 seconds
R Server'Gwilym Jenkins' @ jenkins.wessa.net

\begin{tabular}{lllllllll}
\hline
Summary of computational transaction \tabularnewline
Raw Input & view raw input (R code)  \tabularnewline
Raw Output & view raw output of R engine  \tabularnewline
Computing time & 4 seconds \tabularnewline
R Server & 'Gwilym Jenkins' @ jenkins.wessa.net \tabularnewline
\hline
\end{tabular}
%Source: https://freestatistics.org/blog/index.php?pk=141643&T=0

[TABLE]
[ROW][C]Summary of computational transaction[/C][/ROW]
[ROW][C]Raw Input[/C][C]view raw input (R code) [/C][/ROW]
[ROW][C]Raw Output[/C][C]view raw output of R engine [/C][/ROW]
[ROW][C]Computing time[/C][C]4 seconds[/C][/ROW]
[ROW][C]R Server[/C][C]'Gwilym Jenkins' @ jenkins.wessa.net[/C][/ROW]
[/TABLE]
Source: https://freestatistics.org/blog/index.php?pk=141643&T=0

Globally Unique Identifier (entire table): ba.freestatistics.org/blog/index.php?pk=141643&T=0

As an alternative you can also use a QR Code:  

The GUIDs for individual cells are displayed in the table below:

Summary of computational transaction
Raw Inputview raw input (R code)
Raw Outputview raw output of R engine
Computing time4 seconds
R Server'Gwilym Jenkins' @ jenkins.wessa.net


Simple Linear Regression
StatisticsEstimateS.D.T-STAT (H0: coeff=0)P-value (two-sided)
constant term15.29924556622032.407800228990226.354034434425032.08619876929106e-09
slope-0.06979499940751280.0702473651770115-0.9935603880891640.321937144246452

\begin{tabular}{lllllllll}
\hline
Simple Linear Regression \tabularnewline
Statistics & Estimate & S.D. & T-STAT (H0: coeff=0) & P-value (two-sided) \tabularnewline
constant term & 15.2992455662203 & 2.40780022899022 & 6.35403443442503 & 2.08619876929106e-09 \tabularnewline
slope & -0.0697949994075128 & 0.0702473651770115 & -0.993560388089164 & 0.321937144246452 \tabularnewline
\hline
\end{tabular}
%Source: https://freestatistics.org/blog/index.php?pk=141643&T=1

[TABLE]
[ROW][C]Simple Linear Regression[/C][/ROW]
[ROW][C]Statistics[/C][C]Estimate[/C][C]S.D.[/C][C]T-STAT (H0: coeff=0)[/C][C]P-value (two-sided)[/C][/ROW]
[ROW][C]constant term[/C][C]15.2992455662203[/C][C]2.40780022899022[/C][C]6.35403443442503[/C][C]2.08619876929106e-09[/C][/ROW]
[ROW][C]slope[/C][C]-0.0697949994075128[/C][C]0.0702473651770115[/C][C]-0.993560388089164[/C][C]0.321937144246452[/C][/ROW]
[/TABLE]
Source: https://freestatistics.org/blog/index.php?pk=141643&T=1

Globally Unique Identifier (entire table): ba.freestatistics.org/blog/index.php?pk=141643&T=1

As an alternative you can also use a QR Code:  

The GUIDs for individual cells are displayed in the table below:

Simple Linear Regression
StatisticsEstimateS.D.T-STAT (H0: coeff=0)P-value (two-sided)
constant term15.29924556622032.407800228990226.354034434425032.08619876929106e-09
slope-0.06979499940751280.0702473651770115-0.9935603880891640.321937144246452


Parameters (Session):
par1 = 0 ;
Parameters (R input):
par1 = 0 ;
R code (references can be found in the software module):
par1 <- as.numeric(par1)
library(lattice)
z <- as.data.frame(cbind(x,y))
m <- lm(y~x)
summary(m)
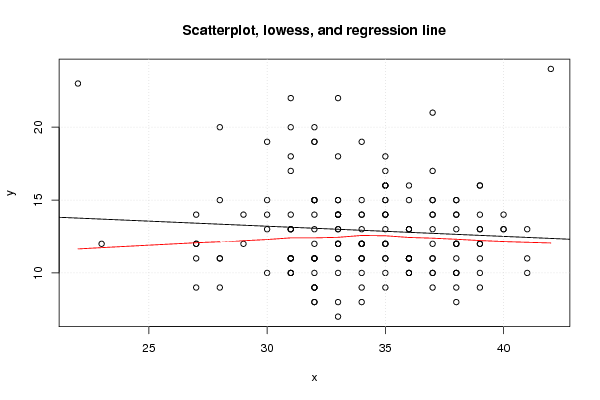
bitmap(file='test1.png')
plot(z,main='Scatterplot, lowess, and regression line')
lines(lowess(z),col='red')
abline(m)
grid()
dev.off()
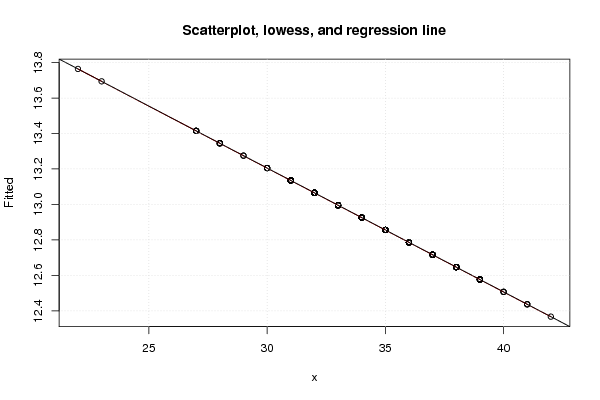
bitmap(file='test2.png')
m2 <- lm(m$fitted.values ~ x)
summary(m2)
z2 <- as.data.frame(cbind(x,m$fitted.values))
names(z2) <- list('x','Fitted')
plot(z2,main='Scatterplot, lowess, and regression line')
lines(lowess(z2),col='red')
abline(m2)
grid()
dev.off()
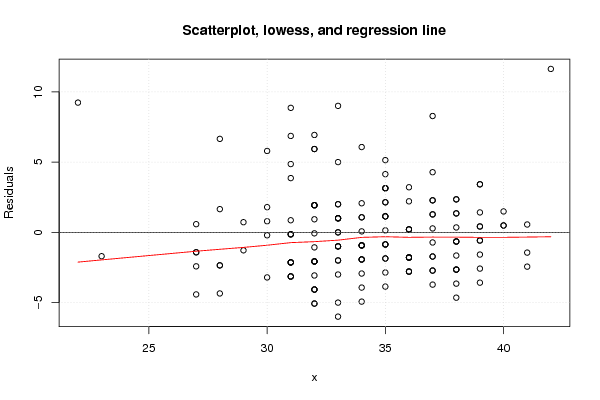
bitmap(file='test3.png')
m3 <- lm(m$residuals ~ x)
summary(m3)
z3 <- as.data.frame(cbind(x,m$residuals))
names(z3) <- list('x','Residuals')
plot(z3,main='Scatterplot, lowess, and regression line')
lines(lowess(z3),col='red')
abline(m3)
grid()
dev.off()
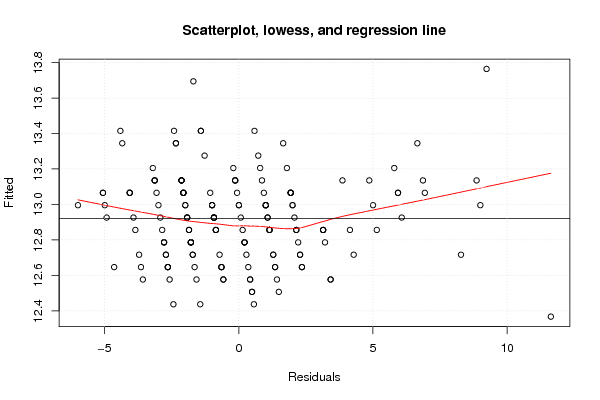
bitmap(file='test4.png')
m4 <- lm(m$fitted.values ~ m$residuals)
summary(m4)
z4 <- as.data.frame(cbind(m$residuals,m$fitted.values))
names(z4) <- list('Residuals','Fitted')
plot(z4,main='Scatterplot, lowess, and regression line')
lines(lowess(z4),col='red')
abline(m4)
grid()
dev.off()
bitmap(file='test5.png')
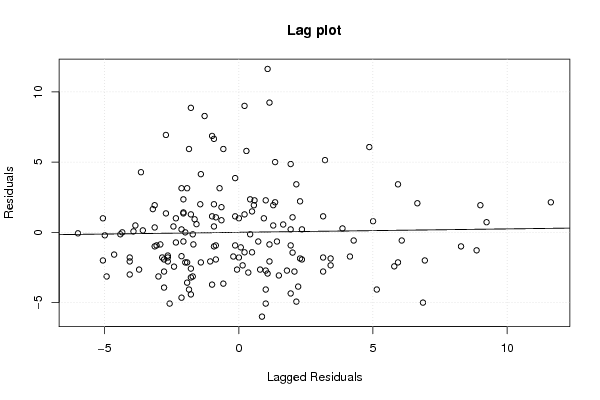
myr <- as.ts(m$residuals)
z5 <- as.data.frame(cbind(lag(myr,1),myr))
names(z5) <- list('Lagged Residuals','Residuals')
plot(z5,main='Lag plot')
m5 <- lm(z5)
summary(m5)
abline(m5)
grid()
dev.off()
bitmap(file='test6.png')
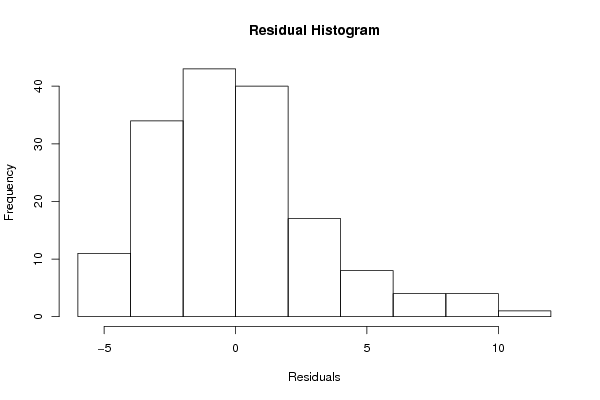
hist(m$residuals,main='Residual Histogram',xlab='Residuals')
dev.off()
bitmap(file='test7.png')
if (par1 > 0)
{
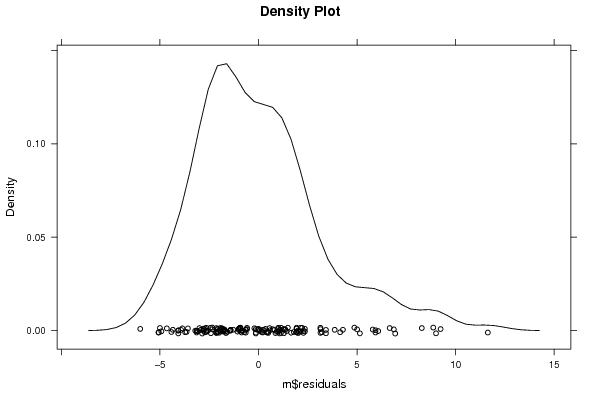
densityplot(~m$residuals,col='black',main=paste('Density Plot bw = ',par1),bw=par1)
} else {
densityplot(~m$residuals,col='black',main='Density Plot')
}
dev.off()
bitmap(file='test8.png')
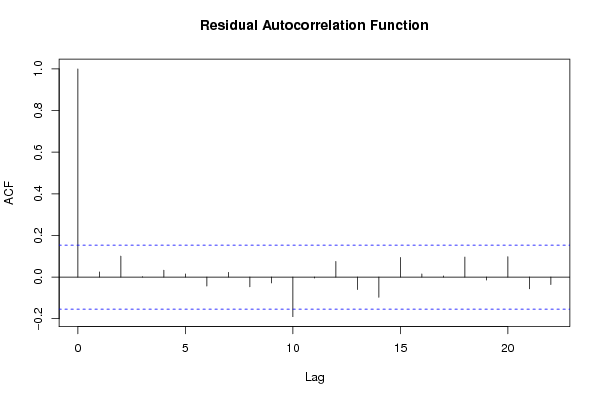
acf(m$residuals,main='Residual Autocorrelation Function')
dev.off()
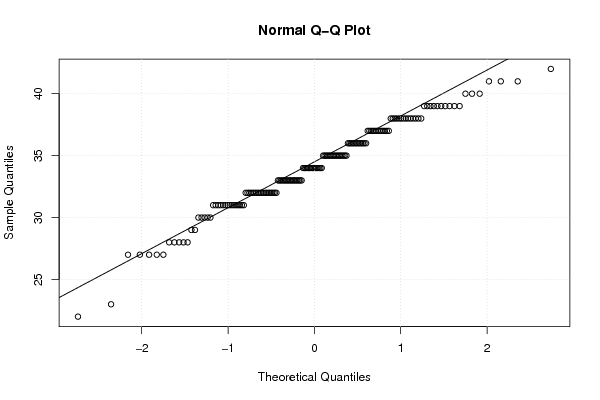
bitmap(file='test9.png')
qqnorm(x)
qqline(x)
grid()
dev.off()
load(file='createtable')
a<-table.start()
a<-table.row.start(a)
a<-table.element(a,'Simple Linear Regression',5,TRUE)
a<-table.row.end(a)
a<-table.row.start(a)
a<-table.element(a,'Statistics',1,TRUE)
a<-table.element(a,'Estimate',1,TRUE)
a<-table.element(a,'S.D.',1,TRUE)
a<-table.element(a,'T-STAT (H0: coeff=0)',1,TRUE)
a<-table.element(a,'P-value (two-sided)',1,TRUE)
a<-table.row.end(a)
a<-table.row.start(a)
a<-table.element(a,'constant term',header=TRUE)
a<-table.element(a,m$coefficients[[1]])
sd <- sqrt(vcov(m)[1,1])
a<-table.element(a,sd)
tstat <- m$coefficients[[1]]/sd
a<-table.element(a,tstat)
pval <- 2*(1-pt(abs(tstat),length(x)-2))
a<-table.element(a,pval)
a<-table.row.end(a)
a<-table.row.start(a)
a<-table.element(a,'slope',header=TRUE)
a<-table.element(a,m$coefficients[[2]])
sd <- sqrt(vcov(m)[2,2])
a<-table.element(a,sd)
tstat <- m$coefficients[[2]]/sd
a<-table.element(a,tstat)
pval <- 2*(1-pt(abs(tstat),length(x)-2))
a<-table.element(a,pval)
a<-table.row.end(a)
a<-table.end(a)
table.save(a,file='mytable.tab')