| Tabulation of Results | ||
| Score x Treatment | ||
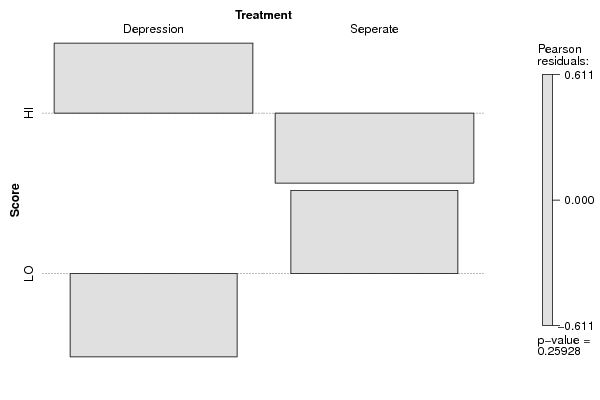
| Depression | Seperate | HI | 100 | 90 | LO | 62 | 72 |
| Tabulation of Expected Results | ||
| Score x Treatment | ||
| Depression | Seperate | HI | 95 | 95 | LO | 67 | 67 |
| Statistical Results | |
| Pearson's Chi-squared test with Yates' continuity correction | |
| Pearson Chi Square Statistic | 1.03 |
| Degrees of Freedom | 1 |
| P value | 0.31 |