Free Statistics

of Irreproducible Research!

Author's title

Author*The author of this computation has been verified*
R Software Modulerwasp_histogram.wasp
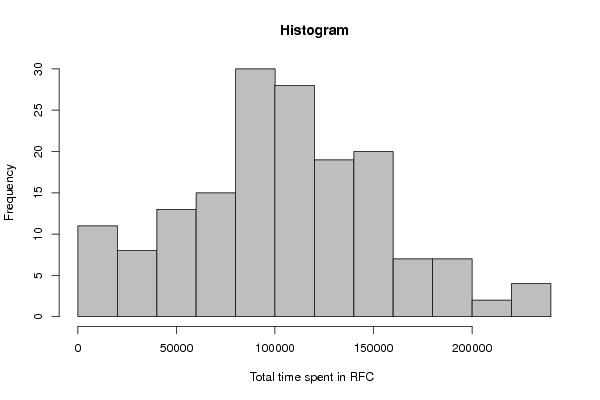
Title produced by softwareHistogram
Date of computationFri, 11 Nov 2011 10:56:27 -0500
Cite this page as followsStatistical Computations at FreeStatistics.org, Office for Research Development and Education, URL https://freestatistics.org/blog/index.php?v=date/2011/Nov/11/t1321027001f0awh9wany4kcig.htm/, Retrieved Thu, 28 Mar 2024 08:49:23 +0000
Statistical Computations at FreeStatistics.org, Office for Research Development and Education, URL https://freestatistics.org/blog/index.php?pk=141373, Retrieved Thu, 28 Mar 2024 08:49:23 +0000
QR Codes:

Original text written by user:
IsPrivate?No (this computation is public)
User-defined keywords
Estimated Impact133
Family? (F = Feedback message, R = changed R code, M = changed R Module, P = changed Parameters, D = changed Data)
-     [Two-Way ANOVA] [] [2010-11-02 14:42:14] [b98453cac15ba1066b407e146608df68]
-   PD  [Two-Way ANOVA] [vraag 8] [2011-10-30 14:00:47] [c26e829f03d42da3805b9c4b60f90f25]
- RMPD      [Histogram] [Histogram] [2011-11-11 15:56:27] [e1aba6efa0fba8dc2a9839c208d0186e] [Current]
Feedback Forum

Post a new message
Dataseries X:
127269
75620
88255
104300
53891
23637
239665
26847
82376
108063
130696
106111
77157
156938
111186
193991
137623
129655
90067
118206
128389
226536
67073
89947
101451
121691
147649
101001
88745
145509
158310
82934
144300
50968
169102
129402
197808
102540
76806
135028
158063
97980
99862
49417
79864
238236
66613
133589
179955
104416
88737
24019
178249
64672
85913
149157
136059
147863
157786
97096
194551
166067
107928
136136
105283
74153
95612
108093
118089
51000
97034
52125
96331
106760
82657
159858
161402
90287
74853
87661
85840
224167
107905
82275
80953
90496
67181
155920
124542
84443
93028
106264
84922
132246
145658
106443
108558
138044
136773
183992
114968
126632
80456
39948
108674
101041
114400
153398
57427
78870
127197
119023
20764
99305
61675
72554
168643
21054
151340
23175
157461
103303
48355
51536
38214
86725
159468
90604
183334
137626
204060
114015
51227
147342
210790
41227
198679
81901
130930
82730
50656
195126
115032
173260
144766
57297
112567
142346
0
14688
98
455
0
0
111354
148268
0
203
7199
46660
17547
73567
969
76925


Summary of computational transaction
Raw Inputview raw input (R code)
Raw Outputview raw output of R engine
Computing time1 seconds
R Server'Herman Ole Andreas Wold' @ wold.wessa.net

\begin{tabular}{lllllllll}
\hline
Summary of computational transaction \tabularnewline
Raw Input & view raw input (R code)  \tabularnewline
Raw Output & view raw output of R engine  \tabularnewline
Computing time & 1 seconds \tabularnewline
R Server & 'Herman Ole Andreas Wold' @ wold.wessa.net \tabularnewline
\hline
\end{tabular}
%Source: https://freestatistics.org/blog/index.php?pk=141373&T=0

[TABLE]
[ROW][C]Summary of computational transaction[/C][/ROW]
[ROW][C]Raw Input[/C][C]view raw input (R code) [/C][/ROW]
[ROW][C]Raw Output[/C][C]view raw output of R engine [/C][/ROW]
[ROW][C]Computing time[/C][C]1 seconds[/C][/ROW]
[ROW][C]R Server[/C][C]'Herman Ole Andreas Wold' @ wold.wessa.net[/C][/ROW]
[/TABLE]
Source: https://freestatistics.org/blog/index.php?pk=141373&T=0

Globally Unique Identifier (entire table): ba.freestatistics.org/blog/index.php?pk=141373&T=0

As an alternative you can also use a QR Code:  

The GUIDs for individual cells are displayed in the table below:

Summary of computational transaction
Raw Inputview raw input (R code)
Raw Outputview raw output of R engine
Computing time1 seconds
R Server'Herman Ole Andreas Wold' @ wold.wessa.net


Frequency Table (Histogram)
BinsMidpointAbs. FrequencyRel. FrequencyCumul. Rel. Freq.Density
[0,20000[10000110.0670730.0670733e-06
[20000,40000[3000080.048780.1158542e-06
[40000,60000[50000130.0792680.1951224e-06
[60000,80000[70000150.0914630.2865855e-06
[80000,1e+05[90000300.1829270.4695129e-06
[1e+05,120000[110000280.1707320.6402449e-06
[120000,140000[130000190.1158540.7560986e-06
[140000,160000[150000200.1219510.8780496e-06
[160000,180000[17000070.0426830.9207322e-06
[180000,2e+05[19000070.0426830.9634152e-06
[2e+05,220000[21000020.0121950.975611e-06
[220000,240000]23000040.0243911e-06

\begin{tabular}{lllllllll}
\hline
Frequency Table (Histogram) \tabularnewline
Bins & Midpoint & Abs. Frequency & Rel. Frequency & Cumul. Rel. Freq. & Density \tabularnewline
[0,20000[ & 10000 & 11 & 0.067073 & 0.067073 & 3e-06 \tabularnewline
[20000,40000[ & 30000 & 8 & 0.04878 & 0.115854 & 2e-06 \tabularnewline
[40000,60000[ & 50000 & 13 & 0.079268 & 0.195122 & 4e-06 \tabularnewline
[60000,80000[ & 70000 & 15 & 0.091463 & 0.286585 & 5e-06 \tabularnewline
[80000,1e+05[ & 90000 & 30 & 0.182927 & 0.469512 & 9e-06 \tabularnewline
[1e+05,120000[ & 110000 & 28 & 0.170732 & 0.640244 & 9e-06 \tabularnewline
[120000,140000[ & 130000 & 19 & 0.115854 & 0.756098 & 6e-06 \tabularnewline
[140000,160000[ & 150000 & 20 & 0.121951 & 0.878049 & 6e-06 \tabularnewline
[160000,180000[ & 170000 & 7 & 0.042683 & 0.920732 & 2e-06 \tabularnewline
[180000,2e+05[ & 190000 & 7 & 0.042683 & 0.963415 & 2e-06 \tabularnewline
[2e+05,220000[ & 210000 & 2 & 0.012195 & 0.97561 & 1e-06 \tabularnewline
[220000,240000] & 230000 & 4 & 0.02439 & 1 & 1e-06 \tabularnewline
\hline
\end{tabular}
%Source: https://freestatistics.org/blog/index.php?pk=141373&T=1

[TABLE]
[ROW][C]Frequency Table (Histogram)[/C][/ROW]
[ROW][C]Bins[/C][C]Midpoint[/C][C]Abs. Frequency[/C][C]Rel. Frequency[/C][C]Cumul. Rel. Freq.[/C][C]Density[/C][/ROW]
[ROW][C][0,20000[[/C][C]10000[/C][C]11[/C][C]0.067073[/C][C]0.067073[/C][C]3e-06[/C][/ROW]
[ROW][C][20000,40000[[/C][C]30000[/C][C]8[/C][C]0.04878[/C][C]0.115854[/C][C]2e-06[/C][/ROW]
[ROW][C][40000,60000[[/C][C]50000[/C][C]13[/C][C]0.079268[/C][C]0.195122[/C][C]4e-06[/C][/ROW]
[ROW][C][60000,80000[[/C][C]70000[/C][C]15[/C][C]0.091463[/C][C]0.286585[/C][C]5e-06[/C][/ROW]
[ROW][C][80000,1e+05[[/C][C]90000[/C][C]30[/C][C]0.182927[/C][C]0.469512[/C][C]9e-06[/C][/ROW]
[ROW][C][1e+05,120000[[/C][C]110000[/C][C]28[/C][C]0.170732[/C][C]0.640244[/C][C]9e-06[/C][/ROW]
[ROW][C][120000,140000[[/C][C]130000[/C][C]19[/C][C]0.115854[/C][C]0.756098[/C][C]6e-06[/C][/ROW]
[ROW][C][140000,160000[[/C][C]150000[/C][C]20[/C][C]0.121951[/C][C]0.878049[/C][C]6e-06[/C][/ROW]
[ROW][C][160000,180000[[/C][C]170000[/C][C]7[/C][C]0.042683[/C][C]0.920732[/C][C]2e-06[/C][/ROW]
[ROW][C][180000,2e+05[[/C][C]190000[/C][C]7[/C][C]0.042683[/C][C]0.963415[/C][C]2e-06[/C][/ROW]
[ROW][C][2e+05,220000[[/C][C]210000[/C][C]2[/C][C]0.012195[/C][C]0.97561[/C][C]1e-06[/C][/ROW]
[ROW][C][220000,240000][/C][C]230000[/C][C]4[/C][C]0.02439[/C][C]1[/C][C]1e-06[/C][/ROW]
[/TABLE]
Source: https://freestatistics.org/blog/index.php?pk=141373&T=1

Globally Unique Identifier (entire table): ba.freestatistics.org/blog/index.php?pk=141373&T=1

As an alternative you can also use a QR Code:  

The GUIDs for individual cells are displayed in the table below:

Frequency Table (Histogram)
BinsMidpointAbs. FrequencyRel. FrequencyCumul. Rel. Freq.Density
[0,20000[10000110.0670730.0670733e-06
[20000,40000[3000080.048780.1158542e-06
[40000,60000[50000130.0792680.1951224e-06
[60000,80000[70000150.0914630.2865855e-06
[80000,1e+05[90000300.1829270.4695129e-06
[1e+05,120000[110000280.1707320.6402449e-06
[120000,140000[130000190.1158540.7560986e-06
[140000,160000[150000200.1219510.8780496e-06
[160000,180000[17000070.0426830.9207322e-06
[180000,2e+05[19000070.0426830.9634152e-06
[2e+05,220000[21000020.0121950.975611e-06
[220000,240000]23000040.0243911e-06


Parameters (Session):
par1 = 2 ; par2 = 6 ; par3 = Exact Pearson Chi-Squared by Simulation ;
Parameters (R input):
par1 = ; par2 = grey ; par3 = FALSE ; par4 = Unknown ;
R code (references can be found in the software module):
par1 <- as.numeric(par1)
if (par3 == 'TRUE') par3 <- TRUE
if (par3 == 'FALSE') par3 <- FALSE
if (par4 == 'Unknown') par1 <- as.numeric(par1)
if (par4 == 'Interval/Ratio') par1 <- as.numeric(par1)
if (par4 == '3-point Likert') par1 <- c(1:3 - 0.5, 3.5)
if (par4 == '4-point Likert') par1 <- c(1:4 - 0.5, 4.5)
if (par4 == '5-point Likert') par1 <- c(1:5 - 0.5, 5.5)
if (par4 == '6-point Likert') par1 <- c(1:6 - 0.5, 6.5)
if (par4 == '7-point Likert') par1 <- c(1:7 - 0.5, 7.5)
if (par4 == '8-point Likert') par1 <- c(1:8 - 0.5, 8.5)
if (par4 == '9-point Likert') par1 <- c(1:9 - 0.5, 9.5)
if (par4 == '10-point Likert') par1 <- c(1:10 - 0.5, 10.5)
bitmap(file='test1.png')
if(is.numeric(x[1])) {
if (is.na(par1)) {
myhist<-hist(x,col=par2,main=main,xlab=xlab,right=par3)
} else {
if (par1 < 0) par1 <- 3
if (par1 > 50) par1 <- 50
myhist<-hist(x,breaks=par1,col=par2,main=main,xlab=xlab,right=par3)
}
} else {
plot(mytab <- table(x),col=par2,main='Frequency Plot',xlab=xlab,ylab='Absolute Frequency')
}
dev.off()
if(is.numeric(x[1])) {
myhist
n <- length(x)
load(file='createtable')
a<-table.start()
a<-table.row.start(a)
a<-table.element(a,hyperlink('histogram.htm','Frequency Table (Histogram)',''),6,TRUE)
a<-table.row.end(a)
a<-table.row.start(a)
a<-table.element(a,'Bins',header=TRUE)
a<-table.element(a,'Midpoint',header=TRUE)
a<-table.element(a,'Abs. Frequency',header=TRUE)
a<-table.element(a,'Rel. Frequency',header=TRUE)
a<-table.element(a,'Cumul. Rel. Freq.',header=TRUE)
a<-table.element(a,'Density',header=TRUE)
a<-table.row.end(a)
crf <- 0
if (par3 == FALSE) mybracket <- '[' else mybracket <- ']'
mynumrows <- (length(myhist$breaks)-1)
for (i in 1:mynumrows) {
a<-table.row.start(a)
if (i == 1)
dum <- paste('[',myhist$breaks[i],sep='')
else
dum <- paste(mybracket,myhist$breaks[i],sep='')
dum <- paste(dum,myhist$breaks[i+1],sep=',')
if (i==mynumrows)
dum <- paste(dum,']',sep='')
else
dum <- paste(dum,mybracket,sep='')
a<-table.element(a,dum,header=TRUE)
a<-table.element(a,myhist$mids[i])
a<-table.element(a,myhist$counts[i])
rf <- myhist$counts[i]/n
crf <- crf + rf
a<-table.element(a,round(rf,6))
a<-table.element(a,round(crf,6))
a<-table.element(a,round(myhist$density[i],6))
a<-table.row.end(a)
}
a<-table.end(a)
table.save(a,file='mytable.tab')
} else {
mytab
reltab <- mytab / sum(mytab)
n <- length(mytab)
load(file='createtable')
a<-table.start()
a<-table.row.start(a)
a<-table.element(a,'Frequency Table (Categorical Data)',3,TRUE)
a<-table.row.end(a)
a<-table.row.start(a)
a<-table.element(a,'Category',header=TRUE)
a<-table.element(a,'Abs. Frequency',header=TRUE)
a<-table.element(a,'Rel. Frequency',header=TRUE)
a<-table.row.end(a)
for (i in 1:n) {
a<-table.row.start(a)
a<-table.element(a,labels(mytab)$x[i],header=TRUE)
a<-table.element(a,mytab[i])
a<-table.element(a,round(reltab[i],4))
a<-table.row.end(a)
}
a<-table.end(a)
table.save(a,file='mytable1.tab')
}