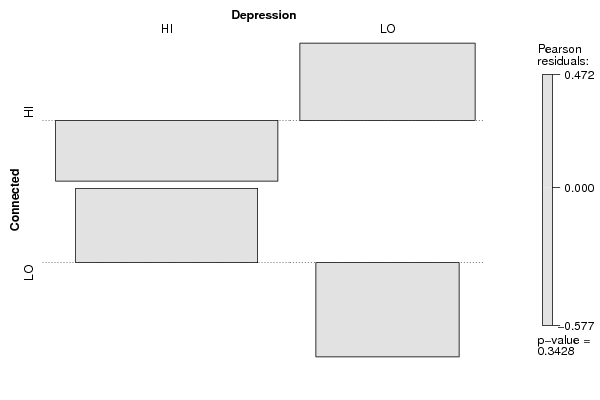
| Tabulation of Results | ||
| Connected x Depression | ||
| HI | LO | HI | 57 | 40 | LO | 43 | 22 |
| Tabulation of Expected Results | ||
| Connected x Depression | ||
| HI | LO | HI | 59.88 | 37.12 | LO | 40.12 | 24.88 |
| Statistical Results | |
| Pearson's Chi-squared test with simulated p-value (based on 2000 replicates) | |
| Exact Pearson Chi Square Statistic | 0.9 |
| P value | 0.41 |