| Tabulation of Results | ||
| Score x Treatment | ||
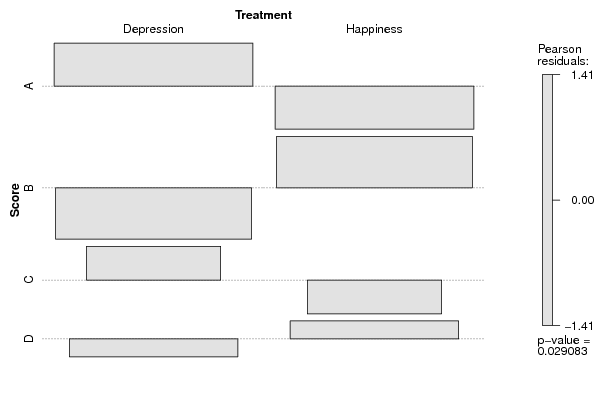
| Depression | Happiness | A | 60 | 43 | B | 40 | 60 | C | 28 | 19 | D | 34 | 40 |
| Tabulation of Expected Results | ||
| Score x Treatment | ||
| Depression | Happiness | A | 51.5 | 51.5 | B | 50 | 50 | C | 23.5 | 23.5 | D | 37 | 37 |
| Statistical Results | |
| Pearson's Chi-squared test | |
| Pearson Chi Square Statistic | 9.02 |
| Degrees of Freedom | 3 |
| P value | 0.03 |