| Tabulation of Results | ||
| Happiness x Connected | ||
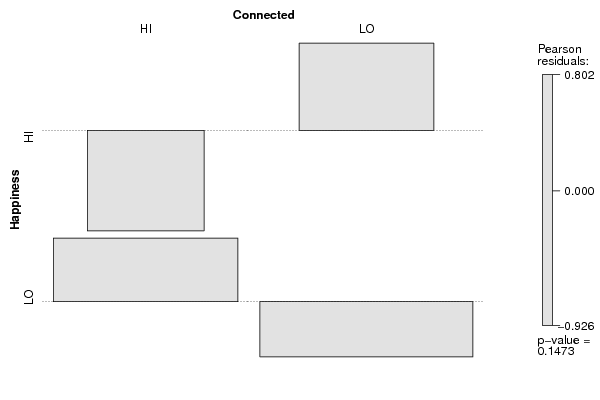
| HI | LO | HI | 0 | 2 | LO | 3 | 2 |
| Tabulation of Expected Results | ||
| Happiness x Connected | ||
| HI | LO | HI | 0.86 | 1.14 | LO | 2.14 | 2.86 |
| Statistical Results | |
| Pearson's Chi-squared test with Yates' continuity correction | |
| Pearson Chi Square Statistic | 0.36 |
| Degrees of Freedom | 1 |
| P value | 0.55 |