| Tabulation of Results | ||
| Separate x Separate | ||
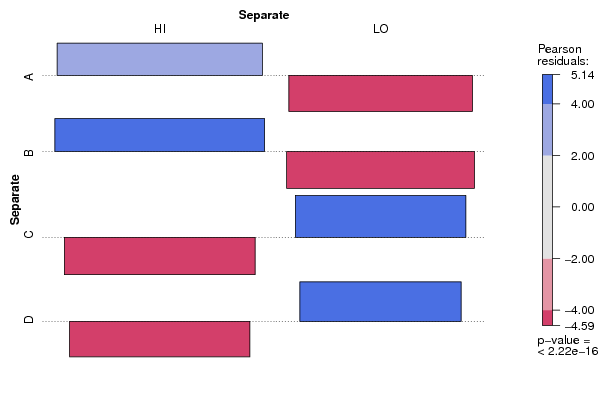
| HI | LO | A | 44 | 0 | B | 46 | 0 | C | 0 | 38 | D | 0 | 34 |
| Tabulation of Expected Results | ||
| Separate x Separate | ||
| HI | LO | A | 24.44 | 19.56 | B | 25.56 | 20.44 | C | 21.11 | 16.89 | D | 18.89 | 15.11 |
| Statistical Results | |
| Pearson's Chi-squared test | |
| Pearson Chi Square Statistic | 162 |
| Degrees of Freedom | 3 |
| P value | 0 |