| Tabulation of Results | ||
| Depression x Depression | ||
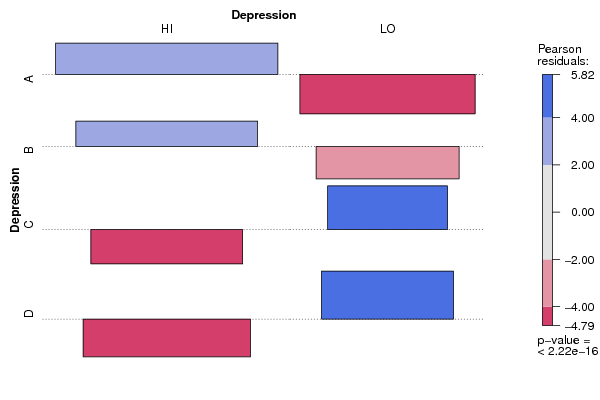
| HI | LO | A | 60 | 0 | B | 40 | 0 | C | 0 | 28 | D | 0 | 34 |
| Tabulation of Expected Results | ||
| Depression x Depression | ||
| HI | LO | A | 37.04 | 22.96 | B | 24.69 | 15.31 | C | 17.28 | 10.72 | D | 20.99 | 13.01 |
| Statistical Results | |
| Pearson's Chi-squared test | |
| Pearson Chi Square Statistic | 162 |
| Degrees of Freedom | 3 |
| P value | 0 |