Free Statistics
of Irreproducible Research!
Description of Statistical Computation | |||||||||||||||||||||||||||||||||||||||||||||||||||||||||||||||||
|---|---|---|---|---|---|---|---|---|---|---|---|---|---|---|---|---|---|---|---|---|---|---|---|---|---|---|---|---|---|---|---|---|---|---|---|---|---|---|---|---|---|---|---|---|---|---|---|---|---|---|---|---|---|---|---|---|---|---|---|---|---|---|---|---|---|
| Author's title | |||||||||||||||||||||||||||||||||||||||||||||||||||||||||||||||||
| Author | *The author of this computation has been verified* | ||||||||||||||||||||||||||||||||||||||||||||||||||||||||||||||||
| R Software Module | rwasp_Tests to Compare Two Means.wasp | ||||||||||||||||||||||||||||||||||||||||||||||||||||||||||||||||
| Title produced by software | T-Tests | ||||||||||||||||||||||||||||||||||||||||||||||||||||||||||||||||
| Date of computation | Mon, 07 Nov 2011 04:34:35 -0500 | ||||||||||||||||||||||||||||||||||||||||||||||||||||||||||||||||
| Cite this page as follows | Statistical Computations at FreeStatistics.org, Office for Research Development and Education, URL https://freestatistics.org/blog/index.php?v=date/2011/Nov/07/t1320658526g458kqup24hiuvo.htm/, Retrieved Sat, 19 Jul 2025 01:26:19 +0000 | ||||||||||||||||||||||||||||||||||||||||||||||||||||||||||||||||
| Statistical Computations at FreeStatistics.org, Office for Research Development and Education, URL https://freestatistics.org/blog/index.php?pk=140082, Retrieved Sat, 19 Jul 2025 01:26:19 +0000 | |||||||||||||||||||||||||||||||||||||||||||||||||||||||||||||||||
| QR Codes: | |||||||||||||||||||||||||||||||||||||||||||||||||||||||||||||||||
|
| |||||||||||||||||||||||||||||||||||||||||||||||||||||||||||||||||
| Original text written by user: | |||||||||||||||||||||||||||||||||||||||||||||||||||||||||||||||||
| IsPrivate? | No (this computation is public) | ||||||||||||||||||||||||||||||||||||||||||||||||||||||||||||||||
| User-defined keywords | t-test | ||||||||||||||||||||||||||||||||||||||||||||||||||||||||||||||||
| Estimated Impact | 1156 | ||||||||||||||||||||||||||||||||||||||||||||||||||||||||||||||||
Tree of Dependent Computations | |||||||||||||||||||||||||||||||||||||||||||||||||||||||||||||||||
| Family? (F = Feedback message, R = changed R code, M = changed R Module, P = changed Parameters, D = changed Data) | |||||||||||||||||||||||||||||||||||||||||||||||||||||||||||||||||
| - [Aston University Statistical Software] [Morning Sickness ...] [2009-11-16 16:26:06] [74be16979710d4c4e7c6647856088456] - R [Aston University Statistical Software] [Morning Sickness ...] [2009-11-16 17:22:16] [74be16979710d4c4e7c6647856088456] - P [T-Tests] [Morning Sickness ...] [2010-11-09 11:12:43] [3fdd735c61ad38cbc9b3393dc997cdb7] - RM [T-Tests] [Morning Sickness ...] [2011-11-07 09:34:35] [a9208f4f8d3b118336aae915785f2bd9] [Current] - R [T-Tests] [Drug Trial Descri...] [2011-11-09 19:35:12] [68da2a3ec537521c4857f5c0bd5ed145] - R [T-Tests] [Drug Trial Descri...] [2011-11-09 19:35:12] [68da2a3ec537521c4857f5c0bd5ed145] - P [T-Tests] [Drugs Trial - one...] [2011-11-10 12:18:13] [68da2a3ec537521c4857f5c0bd5ed145] - RMPD [Histogram, QQplot and Density] [Drugs Trial] [2011-11-09 20:13:45] [68da2a3ec537521c4857f5c0bd5ed145] - D [T-Tests] [Pilot Training] [2011-11-09 20:32:38] [68da2a3ec537521c4857f5c0bd5ed145] - R PD [T-Tests] [Perceptual Experi...] [2011-11-10 09:26:46] [68da2a3ec537521c4857f5c0bd5ed145] - P [T-Tests] [Perceptual Judgem...] [2011-11-10 09:30:31] [68da2a3ec537521c4857f5c0bd5ed145] - P [T-Tests] [Perceptual Judgem...] [2011-11-10 09:37:40] [68da2a3ec537521c4857f5c0bd5ed145] - R [T-Tests] [TTest] [2011-11-10 12:06:49] [803f089ae787812348a044658060aefb] - P [T-Tests] [T-Test Greater] [2011-11-10 12:19:29] [803f089ae787812348a044658060aefb] - PD [T-Tests] [T-Test Scenario 2] [2011-11-10 12:33:55] [803f089ae787812348a044658060aefb] - PD [T-Tests] [T-Test Scenario 3] [2011-11-10 12:41:48] [803f089ae787812348a044658060aefb] - P [T-Tests] [T-Test Lower] [2011-11-10 17:50:10] [74be16979710d4c4e7c6647856088456] - R [T-Tests] [Graph showing res...] [2011-11-10 12:13:34] [c14255f5a914c4d7aab5f6cd60318f9b] - P [T-Tests] [The results of mo...] [2011-11-10 12:18:37] [c14255f5a914c4d7aab5f6cd60318f9b] - D [T-Tests] [Pilot methods] [2011-11-10 12:34:31] [c14255f5a914c4d7aab5f6cd60318f9b] - D [T-Tests] [Pilot methods] [2011-11-10 12:34:31] [c14255f5a914c4d7aab5f6cd60318f9b] - D [T-Tests] [Standard and new ...] [2011-11-10 12:35:27] [c14255f5a914c4d7aab5f6cd60318f9b] - R [T-Tests] [boxplot for drug/...] [2011-11-10 12:14:56] [1a620483555ed9c2c7b5616febb12cf1] - R [T-Tests] [Morning sickenss ...] [2011-11-10 12:16:07] [8b1b3b62029043ad14f9403dfa37ed82] - PD [T-Tests] [Scenario 2] [2011-11-10 12:22:29] [8b1b3b62029043ad14f9403dfa37ed82] - PD [T-Tests] [scenario 3] [2011-11-10 12:54:37] [8b1b3b62029043ad14f9403dfa37ed82] - R [T-Tests] [Two tailed test o...] [2011-11-10 12:17:39] [5ab72825a06ca2a73c828d10c85d14d8] - R P [T-Tests] [One tailed test] [2011-11-10 12:16:06] [8c60ff0ea9ca69d00e25d4c2af5148c1] - R P [T-Tests] [T Test One Tailed] [2011-11-10 12:16:41] [eaa1051df62e3cae1e5cf7c042ac8911] - R PD [T-Tests] [boxplot for pilot...] [2011-11-10 12:24:04] [1a620483555ed9c2c7b5616febb12cf1] - R [T-Tests] [] [2011-11-10 12:26:50] [0e3849a58d2010f680210bfa36dadcb4] - R D [T-Tests] [] [2011-11-10 12:31:00] [0e3849a58d2010f680210bfa36dadcb4] - PD [T-Tests] [] [2011-11-10 12:32:33] [0e3849a58d2010f680210bfa36dadcb4] - R P [T-Tests] [Week 6 Compendium] [2011-11-10 12:31:31] [ed537d185cce52b1ebf7e35bc2be238e] - R [T-Tests] [week 6 compendium...] [2011-11-10 12:31:11] [7f89eac12a05157a4b7c075c574c1c14] - R D [T-Tests] [Week 6 Compendium] [2011-11-10 12:33:12] [ed537d185cce52b1ebf7e35bc2be238e] - R D [T-Tests] [T Test Two Tailed] [2011-11-10 12:33:39] [eaa1051df62e3cae1e5cf7c042ac8911] - R D [T-Tests] [new v old] [2011-11-10 12:33:34] [8c60ff0ea9ca69d00e25d4c2af5148c1] - R [T-Tests] [pregnancy drugs r...] [2011-11-10 12:31:12] [71cac728b89a34ca01732b1dc0bc9099] - R PD [T-Tests] [Week 6 Compendium] [2011-11-10 12:34:28] [ed537d185cce52b1ebf7e35bc2be238e] - R [T-Tests] [wk 6 t test ] [2011-11-10 12:34:27] [2ab645d57af3771f73e43c325a328185] - [T-Tests] [wk 6 scenario 2] [2011-11-13 10:57:02] [74be16979710d4c4e7c6647856088456] - RM [T-Tests] [] [2011-11-10 12:35:19] [6920cf7129d32b5e1d3344311b2c82d4] - R D [T-Tests] [T Test Two Tailed] [2011-11-10 12:35:42] [eaa1051df62e3cae1e5cf7c042ac8911] - R [T-Tests] [Pregnant women, d...] [2011-11-10 12:34:13] [9a61272a736950814aceafb9bfc5e47e] - RM [T-Tests] [week 6 blog - sen. 1] [2011-11-10 12:35:45] [74be16979710d4c4e7c6647856088456] - R [T-Tests] [morning sickness ...] [2011-11-10 12:36:34] [74be16979710d4c4e7c6647856088456] - RM [T-Tests] [T-test for drug u...] [2011-11-10 12:34:00] [09253b89c68efd7a460a267273a9d6e3] - R PD [T-Tests] [T Test One Tailed...] [2011-11-10 12:39:52] [eaa1051df62e3cae1e5cf7c042ac8911] - R PD [T-Tests] [clutter ot not] [2011-11-10 12:40:58] [8c60ff0ea9ca69d00e25d4c2af5148c1] - R P [T-Tests] [ttestscenario] [2011-11-10 12:42:15] [113a1c41b2127daa39468f799d579e88] - RM [T-Tests] [scenario 1] [2011-11-10 12:44:27] [4d6fcff7a029721f667cce838c3bc5ec] [Truncated] | |||||||||||||||||||||||||||||||||||||||||||||||||||||||||||||||||
| Feedback Forum | |||||||||||||||||||||||||||||||||||||||||||||||||||||||||||||||||
Post a new message | |||||||||||||||||||||||||||||||||||||||||||||||||||||||||||||||||
Dataset | |||||||||||||||||||||||||||||||||||||||||||||||||||||||||||||||||
| Dataseries X: | |||||||||||||||||||||||||||||||||||||||||||||||||||||||||||||||||
68.95 70.18 70.84 69.94 70.26 69.61 70.93 71.39 70.71 72.54 70.73 70.48 70.20 70.48 69.76 71.68 71.46 70.59 70.31 71.61 69.24 70.56 70.94 72.74 68.98 72.63 71.16 71.58 69.96 70.14 69.66 71.22 70.20 70.72 69.99 71.37 71.97 69.73 68.29 71.29 67.67 73.19 70.07 70.64 70.89 69.30 69.66 71.76 71.12 70.28 70.60 69.77 70.09 70.37 70.55 71.70 71.63 70.85 69.30 71.07 | |||||||||||||||||||||||||||||||||||||||||||||||||||||||||||||||||
Tables (Output of Computation) | |||||||||||||||||||||||||||||||||||||||||||||||||||||||||||||||||
| |||||||||||||||||||||||||||||||||||||||||||||||||||||||||||||||||
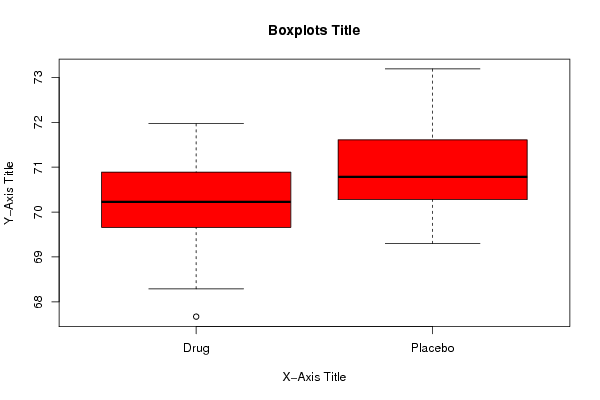
Figures (Output of Computation) | |||||||||||||||||||||||||||||||||||||||||||||||||||||||||||||||||
Input Parameters & R Code | |||||||||||||||||||||||||||||||||||||||||||||||||||||||||||||||||
| Parameters (Session): | |||||||||||||||||||||||||||||||||||||||||||||||||||||||||||||||||
| par1 = two.sided ; par2 = 1 ; par3 = 2 ; par4 = T-Test ; par5 = unpaired ; par6 = 0.0 ; par7 = 0.95 ; par8 = TRUE ; | |||||||||||||||||||||||||||||||||||||||||||||||||||||||||||||||||
| Parameters (R input): | |||||||||||||||||||||||||||||||||||||||||||||||||||||||||||||||||
| par1 = two.sided ; par2 = 1 ; par3 = 2 ; par4 = T-Test ; par5 = unpaired ; par6 = 0.0 ; par7 = 0.95 ; par8 = TRUE ; | |||||||||||||||||||||||||||||||||||||||||||||||||||||||||||||||||
| R code (references can be found in the software module): | |||||||||||||||||||||||||||||||||||||||||||||||||||||||||||||||||
par2 <- as.numeric(par2) | |||||||||||||||||||||||||||||||||||||||||||||||||||||||||||||||||