Free Statistics
of Irreproducible Research!
Description of Statistical Computation | ||||||||||||||||||||||||||||||
|---|---|---|---|---|---|---|---|---|---|---|---|---|---|---|---|---|---|---|---|---|---|---|---|---|---|---|---|---|---|---|
| Author's title | ||||||||||||||||||||||||||||||
| Author | *The author of this computation has been verified* | |||||||||||||||||||||||||||||
| R Software Module | rwasp_Distributional Plots.wasp | |||||||||||||||||||||||||||||
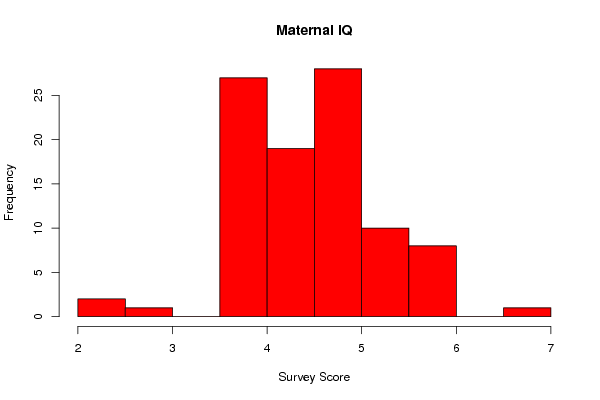
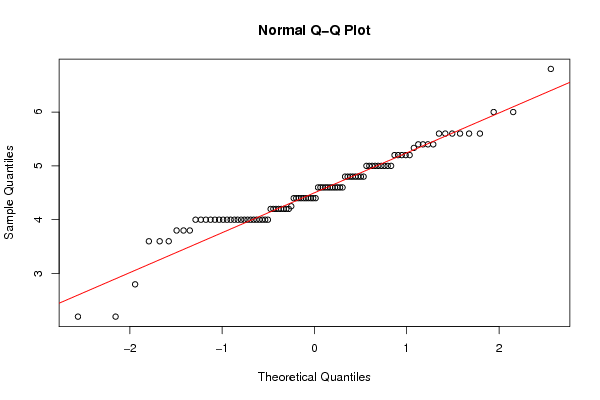
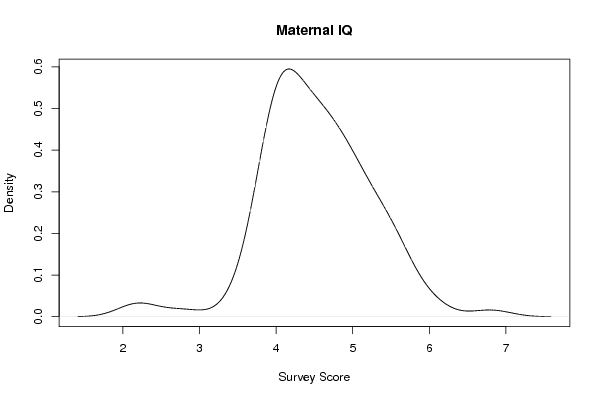
| Title produced by software | Histogram, QQplot and Density | |||||||||||||||||||||||||||||
| Date of computation | Tue, 01 Nov 2011 11:10:48 -0400 | |||||||||||||||||||||||||||||
| Cite this page as follows | Statistical Computations at FreeStatistics.org, Office for Research Development and Education, URL https://freestatistics.org/blog/index.php?v=date/2011/Nov/01/t1320160274kbe0jj2xo732fwv.htm/, Retrieved Tue, 23 Apr 2024 23:47:05 +0000 | |||||||||||||||||||||||||||||
| Statistical Computations at FreeStatistics.org, Office for Research Development and Education, URL https://freestatistics.org/blog/index.php?pk=138924, Retrieved Tue, 23 Apr 2024 23:47:05 +0000 | ||||||||||||||||||||||||||||||
| QR Codes: | ||||||||||||||||||||||||||||||
|
| ||||||||||||||||||||||||||||||
| Original text written by user: | ||||||||||||||||||||||||||||||
| IsPrivate? | No (this computation is public) | |||||||||||||||||||||||||||||
| User-defined keywords | ||||||||||||||||||||||||||||||
| Estimated Impact | 92 | |||||||||||||||||||||||||||||
Tree of Dependent Computations | ||||||||||||||||||||||||||||||
| Family? (F = Feedback message, R = changed R code, M = changed R Module, P = changed Parameters, D = changed Data) | ||||||||||||||||||||||||||||||
| - [Histogram, QQplot and Density] [Compmemory mean] [2011-11-01 15:01:46] [3227e90a3481dfaa189396aafb9ffe80] - R D [Histogram, QQplot and Density] [SpecMemoMean] [2011-11-01 15:10:48] [3a7ca649fc968c09c28de410e4025e81] [Current] | ||||||||||||||||||||||||||||||
| Feedback Forum | ||||||||||||||||||||||||||||||
Post a new message | ||||||||||||||||||||||||||||||
Dataset | ||||||||||||||||||||||||||||||
| Dataseries X: | ||||||||||||||||||||||||||||||
4.6 5.6 4 5 4.4 6 4 4.4 4.6 4 4.8 5.333333333 4.4 5.2 5.2 4 5.2 4.8 4 4.4 5.6 6 4.8 4.2 4 2.8 4.8 4.2 4.8 5.2 4.6 4.4 4 3.6 4.6 4 2.2 4 5.6 3.6 4 5.4 5 4.4 4.6 3.8 4.25 4.6 5.2 4 4.2 4.2 4.6 5.6 5.4 4 3.6 4.4 4.6 4.4 4 5 4.8 4 4.6 4 5 4.2 4.8 6.8 4 4.2 5 5 4.6 4.8 5 4.2 4 4 3.8 4.6 4 4.2 5.6 4 5.6 3.8 5 5.4 5 4.4 4.4 4 5.4 2.2 | ||||||||||||||||||||||||||||||
Tables (Output of Computation) | ||||||||||||||||||||||||||||||
| ||||||||||||||||||||||||||||||
Figures (Output of Computation) | ||||||||||||||||||||||||||||||
Input Parameters & R Code | ||||||||||||||||||||||||||||||
| Parameters (Session): | ||||||||||||||||||||||||||||||
| par1 = 10 ; | ||||||||||||||||||||||||||||||
| Parameters (R input): | ||||||||||||||||||||||||||||||
| par1 = 10 ; | ||||||||||||||||||||||||||||||
| R code (references can be found in the software module): | ||||||||||||||||||||||||||||||
bitmap(file='test1.png') | ||||||||||||||||||||||||||||||