Free Statistics
of Irreproducible Research!
Description of Statistical Computation | |||||||||||||||||||||||||||||||||||||||||
|---|---|---|---|---|---|---|---|---|---|---|---|---|---|---|---|---|---|---|---|---|---|---|---|---|---|---|---|---|---|---|---|---|---|---|---|---|---|---|---|---|---|
| Author's title | |||||||||||||||||||||||||||||||||||||||||
| Author | *The author of this computation has been verified* | ||||||||||||||||||||||||||||||||||||||||
| R Software Module | rwasp_univariatedataseries.wasp | ||||||||||||||||||||||||||||||||||||||||
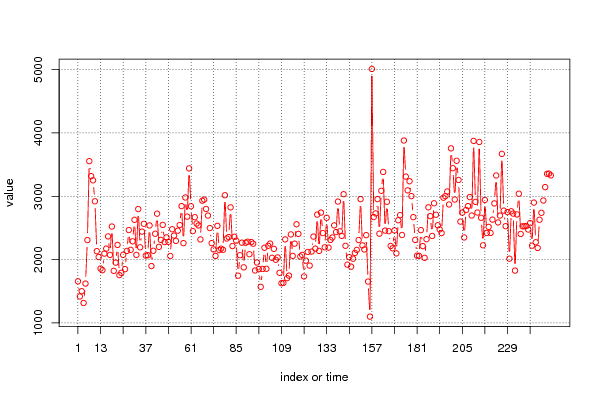
| Title produced by software | Univariate Data Series | ||||||||||||||||||||||||||||||||||||||||
| Date of computation | Fri, 23 Dec 2011 15:24:08 -0500 | ||||||||||||||||||||||||||||||||||||||||
| Cite this page as follows | Statistical Computations at FreeStatistics.org, Office for Research Development and Education, URL https://freestatistics.org/blog/index.php?v=date/2011/Dec/23/t1324671867rsxk1nmgu5o8dv0.htm/, Retrieved Mon, 29 Apr 2024 22:32:28 +0000 | ||||||||||||||||||||||||||||||||||||||||
| Statistical Computations at FreeStatistics.org, Office for Research Development and Education, URL https://freestatistics.org/blog/index.php?pk=160696, Retrieved Mon, 29 Apr 2024 22:32:28 +0000 | |||||||||||||||||||||||||||||||||||||||||
| QR Codes: | |||||||||||||||||||||||||||||||||||||||||
|
| |||||||||||||||||||||||||||||||||||||||||
| Original text written by user: | |||||||||||||||||||||||||||||||||||||||||
| IsPrivate? | No (this computation is public) | ||||||||||||||||||||||||||||||||||||||||
| User-defined keywords | |||||||||||||||||||||||||||||||||||||||||
| Estimated Impact | 97 | ||||||||||||||||||||||||||||||||||||||||
Tree of Dependent Computations | |||||||||||||||||||||||||||||||||||||||||
| Family? (F = Feedback message, R = changed R code, M = changed R Module, P = changed Parameters, D = changed Data) | |||||||||||||||||||||||||||||||||||||||||
| - [Univariate Data Series] [] [2011-12-02 10:23:16] [f1de53e71fac758e9834be8effee591f] - R D [Univariate Data Series] [data] [2011-12-23 20:24:08] [8aedcf735e397266388b06f47fe45218] [Current] | |||||||||||||||||||||||||||||||||||||||||
| Feedback Forum | |||||||||||||||||||||||||||||||||||||||||
Post a new message | |||||||||||||||||||||||||||||||||||||||||
Dataset | |||||||||||||||||||||||||||||||||||||||||
| Dataseries X: | |||||||||||||||||||||||||||||||||||||||||
1657 1418 1501 1315 1621 2308 3554 3318 3252 2921 2133 2040 1858 1833 2094 2173 2366 2074 2522 1822 1952 2232 1755 1791 2075 1850 2137 2467 2154 2289 2628 2074 2798 2194 2442 2565 2063 2070 2539 1898 2139 2408 2725 2201 2311 2548 2276 2351 2280 2057 2479 2379 2295 2456 2546 2844 2260 2981 2678 3440 2842 2450 2669 2570 2540 2318 2930 2947 2799 2695 2498 2260 2160 2058 2533 2150 2172 2155 3016 2333 2355 2825 2214 2360 2299 1746 2069 2267 1878 2266 2282 2085 2277 2251 1828 1954 1851 1570 1852 2187 1855 2218 2253 2028 2169 1997 2034 1791 1627 1631 2319 1707 1747 2397 2059 2251 2558 2406 2049 2074 1734 1983 2121 1905 2126 2363 2173 2710 2137 2742 2419 2194 2660 2189 2310 2349 2540 2434 2916 2446 2375 3032 2218 1920 2039 1889 2014 2105 2153 2309 2955 2225 2160 2386 1653 1099 5010 2672 2729 2955 2409 3086 3384 2458 2913 2448 2215 2179 2461 2098 2621 2703 2388 3880 3310 3093 3237 3002 2670 2311 2062 2059 2465 2213 2028 2322 2825 2687 2373 2889 2708 2542 2477 2419 2977 3001 3075 2870 3756 3443 2948 3560 3257 2600 2741 2349 2783 2845 2987 2696 3874 2912 2743 3857 2660 2226 2942 2420 2516 2421 2631 2887 3328 2587 2695 3669 2773 2527 2750 2014 2763 2726 1826 2713 3040 2405 2526 2526 2529 2474 2576 2219 2900 2274 2184 2629 2739 2933 3144 3354 3357 3329 | |||||||||||||||||||||||||||||||||||||||||
Tables (Output of Computation) | |||||||||||||||||||||||||||||||||||||||||
| |||||||||||||||||||||||||||||||||||||||||
Figures (Output of Computation) | |||||||||||||||||||||||||||||||||||||||||
Input Parameters & R Code | |||||||||||||||||||||||||||||||||||||||||
| Parameters (Session): | |||||||||||||||||||||||||||||||||||||||||
| par4 = 12 ; | |||||||||||||||||||||||||||||||||||||||||
| Parameters (R input): | |||||||||||||||||||||||||||||||||||||||||
| par1 = ; par2 = ; par3 = ; par4 = 12 ; | |||||||||||||||||||||||||||||||||||||||||
| R code (references can be found in the software module): | |||||||||||||||||||||||||||||||||||||||||
if (par4 != 'No season') { | |||||||||||||||||||||||||||||||||||||||||