Free Statistics

of Irreproducible Research!

Author's title

Author*The author of this computation has been verified*
R Software Modulerwasp_exponentialsmoothing.wasp
Title produced by softwareExponential Smoothing
Date of computationFri, 23 Dec 2011 15:08:29 -0500
Cite this page as followsStatistical Computations at FreeStatistics.org, Office for Research Development and Education, URL https://freestatistics.org/blog/index.php?v=date/2011/Dec/23/t1324670940hpwpnu9vdp4xroa.htm/, Retrieved Mon, 29 Apr 2024 23:56:36 +0000
Statistical Computations at FreeStatistics.org, Office for Research Development and Education, URL https://freestatistics.org/blog/index.php?pk=160689, Retrieved Mon, 29 Apr 2024 23:56:36 +0000
QR Codes:

Original text written by user:
IsPrivate?No (this computation is public)
User-defined keywords
Estimated Impact87
Family? (F = Feedback message, R = changed R code, M = changed R Module, P = changed Parameters, D = changed Data)
-     [Spectral Analysis] [] [2011-12-23 18:50:40] [2ba7ee2cbaa966a49160c7cfb7436069]
- RMP     [Exponential Smoothing] [] [2011-12-23 20:08:29] [393d554610c677f923bed472882d0fdb] [Current]
Feedback Forum

Post a new message
Dataseries X:
302
262
218
175
100
77
43
47
49
69
152
205
246
294
242
181
107
56
49
47
47
71
151
244
280
230
185
148
98
61
46
45
55
48
115
185
276
220
181
151
83
55
49
42
46
74
103
200
237
247
215
182
80
46
65
40
44
63
85
185
247
231
167
117
79
45
40
38
41
69
152
232
282
255
161
107
53
40
39
34
35
56
97
210
260
257
210
125
80
42
35
31
32
50
92
189
256
250
198
136
73
39
32
30
31
45


Summary of computational transaction
Raw Inputview raw input (R code)
Raw Outputview raw output of R engine
Computing time2 seconds
R Server'Gwilym Jenkins' @ jenkins.wessa.net

\begin{tabular}{lllllllll}
\hline
Summary of computational transaction \tabularnewline
Raw Input & view raw input (R code)  \tabularnewline
Raw Output & view raw output of R engine  \tabularnewline
Computing time & 2 seconds \tabularnewline
R Server & 'Gwilym Jenkins' @ jenkins.wessa.net \tabularnewline
\hline
\end{tabular}
%Source: https://freestatistics.org/blog/index.php?pk=160689&T=0

[TABLE]
[ROW][C]Summary of computational transaction[/C][/ROW]
[ROW][C]Raw Input[/C][C]view raw input (R code) [/C][/ROW]
[ROW][C]Raw Output[/C][C]view raw output of R engine [/C][/ROW]
[ROW][C]Computing time[/C][C]2 seconds[/C][/ROW]
[ROW][C]R Server[/C][C]'Gwilym Jenkins' @ jenkins.wessa.net[/C][/ROW]
[/TABLE]
Source: https://freestatistics.org/blog/index.php?pk=160689&T=0

Globally Unique Identifier (entire table): ba.freestatistics.org/blog/index.php?pk=160689&T=0

As an alternative you can also use a QR Code:  

The GUIDs for individual cells are displayed in the table below:

Summary of computational transaction
Raw Inputview raw input (R code)
Raw Outputview raw output of R engine
Computing time2 seconds
R Server'Gwilym Jenkins' @ jenkins.wessa.net


Estimated Parameters of Exponential Smoothing
ParameterValue
alpha1
beta1
gammaFALSE

\begin{tabular}{lllllllll}
\hline
Estimated Parameters of Exponential Smoothing \tabularnewline
Parameter & Value \tabularnewline
alpha & 1 \tabularnewline
beta & 1 \tabularnewline
gamma & FALSE \tabularnewline
\hline
\end{tabular}
%Source: https://freestatistics.org/blog/index.php?pk=160689&T=1

[TABLE]
[ROW][C]Estimated Parameters of Exponential Smoothing[/C][/ROW]
[ROW][C]Parameter[/C][C]Value[/C][/ROW]
[ROW][C]alpha[/C][C]1[/C][/ROW]
[ROW][C]beta[/C][C]1[/C][/ROW]
[ROW][C]gamma[/C][C]FALSE[/C][/ROW]
[/TABLE]
Source: https://freestatistics.org/blog/index.php?pk=160689&T=1

Globally Unique Identifier (entire table): ba.freestatistics.org/blog/index.php?pk=160689&T=1

As an alternative you can also use a QR Code:  

The GUIDs for individual cells are displayed in the table below:

Estimated Parameters of Exponential Smoothing
ParameterValue
alpha1
beta1
gammaFALSE


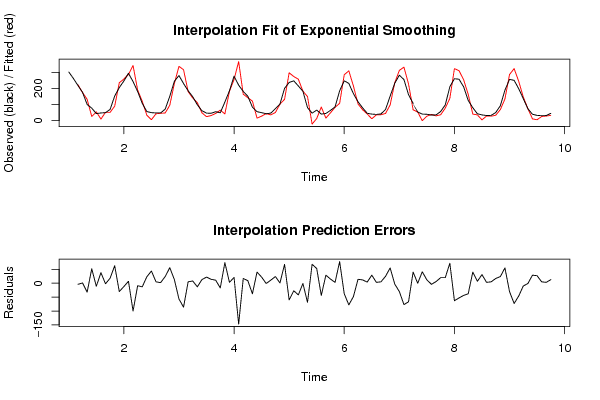
Interpolation Forecasts of Exponential Smoothing
tObservedFittedResiduals
3218222-4
41751741
5100132-32
6772552
74354-11
847938
94951-2
10695118
111528963
12205235-30
13246258-12
142942877
15242342-100
16181190-9
17107120-13
18563323
1949544
2047425
2147452
22714724
231519556
2424423113
25280337-57
26230316-86
271851805
281481408
2998111-13
30614813
31462422
32453114
33554411
344865-17
351154174
361851823
3727625521
38220367-147
3918116417
401511429
4183121-38
42551540
43492722
444243-1
45463511
46745024
471031021
4820013268
49237297-60
50247274-27
51215257-42
52182183-1
5380149-69
5446-2268
55651253
564084-44
57441529
58634815
5985823
6018510778
61247285-38
62231309-78
63167215-48
6411710314
65796712
6645414
67401129
6838353
6941365
70694425
711529755
72232235-3
73282312-30
74255332-77
75161228-67
761076740
7753530
7840-141
79392712
803438-4
8135296
82563620
83977720
8421013872
85260323-63
86257310-53
87210254-44
88125163-38
89804040
9042357
9135431
9231283
9332275
94503317
95926824
9618913455
97256286-30
98250323-73
99198244-46
100136146-10
1017374-1
102391029
10332527
10430255
10531283
106453213

\begin{tabular}{lllllllll}
\hline
Interpolation Forecasts of Exponential Smoothing \tabularnewline
t & Observed & Fitted & Residuals \tabularnewline
3 & 218 & 222 & -4 \tabularnewline
4 & 175 & 174 & 1 \tabularnewline
5 & 100 & 132 & -32 \tabularnewline
6 & 77 & 25 & 52 \tabularnewline
7 & 43 & 54 & -11 \tabularnewline
8 & 47 & 9 & 38 \tabularnewline
9 & 49 & 51 & -2 \tabularnewline
10 & 69 & 51 & 18 \tabularnewline
11 & 152 & 89 & 63 \tabularnewline
12 & 205 & 235 & -30 \tabularnewline
13 & 246 & 258 & -12 \tabularnewline
14 & 294 & 287 & 7 \tabularnewline
15 & 242 & 342 & -100 \tabularnewline
16 & 181 & 190 & -9 \tabularnewline
17 & 107 & 120 & -13 \tabularnewline
18 & 56 & 33 & 23 \tabularnewline
19 & 49 & 5 & 44 \tabularnewline
20 & 47 & 42 & 5 \tabularnewline
21 & 47 & 45 & 2 \tabularnewline
22 & 71 & 47 & 24 \tabularnewline
23 & 151 & 95 & 56 \tabularnewline
24 & 244 & 231 & 13 \tabularnewline
25 & 280 & 337 & -57 \tabularnewline
26 & 230 & 316 & -86 \tabularnewline
27 & 185 & 180 & 5 \tabularnewline
28 & 148 & 140 & 8 \tabularnewline
29 & 98 & 111 & -13 \tabularnewline
30 & 61 & 48 & 13 \tabularnewline
31 & 46 & 24 & 22 \tabularnewline
32 & 45 & 31 & 14 \tabularnewline
33 & 55 & 44 & 11 \tabularnewline
34 & 48 & 65 & -17 \tabularnewline
35 & 115 & 41 & 74 \tabularnewline
36 & 185 & 182 & 3 \tabularnewline
37 & 276 & 255 & 21 \tabularnewline
38 & 220 & 367 & -147 \tabularnewline
39 & 181 & 164 & 17 \tabularnewline
40 & 151 & 142 & 9 \tabularnewline
41 & 83 & 121 & -38 \tabularnewline
42 & 55 & 15 & 40 \tabularnewline
43 & 49 & 27 & 22 \tabularnewline
44 & 42 & 43 & -1 \tabularnewline
45 & 46 & 35 & 11 \tabularnewline
46 & 74 & 50 & 24 \tabularnewline
47 & 103 & 102 & 1 \tabularnewline
48 & 200 & 132 & 68 \tabularnewline
49 & 237 & 297 & -60 \tabularnewline
50 & 247 & 274 & -27 \tabularnewline
51 & 215 & 257 & -42 \tabularnewline
52 & 182 & 183 & -1 \tabularnewline
53 & 80 & 149 & -69 \tabularnewline
54 & 46 & -22 & 68 \tabularnewline
55 & 65 & 12 & 53 \tabularnewline
56 & 40 & 84 & -44 \tabularnewline
57 & 44 & 15 & 29 \tabularnewline
58 & 63 & 48 & 15 \tabularnewline
59 & 85 & 82 & 3 \tabularnewline
60 & 185 & 107 & 78 \tabularnewline
61 & 247 & 285 & -38 \tabularnewline
62 & 231 & 309 & -78 \tabularnewline
63 & 167 & 215 & -48 \tabularnewline
64 & 117 & 103 & 14 \tabularnewline
65 & 79 & 67 & 12 \tabularnewline
66 & 45 & 41 & 4 \tabularnewline
67 & 40 & 11 & 29 \tabularnewline
68 & 38 & 35 & 3 \tabularnewline
69 & 41 & 36 & 5 \tabularnewline
70 & 69 & 44 & 25 \tabularnewline
71 & 152 & 97 & 55 \tabularnewline
72 & 232 & 235 & -3 \tabularnewline
73 & 282 & 312 & -30 \tabularnewline
74 & 255 & 332 & -77 \tabularnewline
75 & 161 & 228 & -67 \tabularnewline
76 & 107 & 67 & 40 \tabularnewline
77 & 53 & 53 & 0 \tabularnewline
78 & 40 & -1 & 41 \tabularnewline
79 & 39 & 27 & 12 \tabularnewline
80 & 34 & 38 & -4 \tabularnewline
81 & 35 & 29 & 6 \tabularnewline
82 & 56 & 36 & 20 \tabularnewline
83 & 97 & 77 & 20 \tabularnewline
84 & 210 & 138 & 72 \tabularnewline
85 & 260 & 323 & -63 \tabularnewline
86 & 257 & 310 & -53 \tabularnewline
87 & 210 & 254 & -44 \tabularnewline
88 & 125 & 163 & -38 \tabularnewline
89 & 80 & 40 & 40 \tabularnewline
90 & 42 & 35 & 7 \tabularnewline
91 & 35 & 4 & 31 \tabularnewline
92 & 31 & 28 & 3 \tabularnewline
93 & 32 & 27 & 5 \tabularnewline
94 & 50 & 33 & 17 \tabularnewline
95 & 92 & 68 & 24 \tabularnewline
96 & 189 & 134 & 55 \tabularnewline
97 & 256 & 286 & -30 \tabularnewline
98 & 250 & 323 & -73 \tabularnewline
99 & 198 & 244 & -46 \tabularnewline
100 & 136 & 146 & -10 \tabularnewline
101 & 73 & 74 & -1 \tabularnewline
102 & 39 & 10 & 29 \tabularnewline
103 & 32 & 5 & 27 \tabularnewline
104 & 30 & 25 & 5 \tabularnewline
105 & 31 & 28 & 3 \tabularnewline
106 & 45 & 32 & 13 \tabularnewline
\hline
\end{tabular}
%Source: https://freestatistics.org/blog/index.php?pk=160689&T=2

[TABLE]
[ROW][C]Interpolation Forecasts of Exponential Smoothing[/C][/ROW]
[ROW][C]t[/C][C]Observed[/C][C]Fitted[/C][C]Residuals[/C][/ROW]
[ROW][C]3[/C][C]218[/C][C]222[/C][C]-4[/C][/ROW]
[ROW][C]4[/C][C]175[/C][C]174[/C][C]1[/C][/ROW]
[ROW][C]5[/C][C]100[/C][C]132[/C][C]-32[/C][/ROW]
[ROW][C]6[/C][C]77[/C][C]25[/C][C]52[/C][/ROW]
[ROW][C]7[/C][C]43[/C][C]54[/C][C]-11[/C][/ROW]
[ROW][C]8[/C][C]47[/C][C]9[/C][C]38[/C][/ROW]
[ROW][C]9[/C][C]49[/C][C]51[/C][C]-2[/C][/ROW]
[ROW][C]10[/C][C]69[/C][C]51[/C][C]18[/C][/ROW]
[ROW][C]11[/C][C]152[/C][C]89[/C][C]63[/C][/ROW]
[ROW][C]12[/C][C]205[/C][C]235[/C][C]-30[/C][/ROW]
[ROW][C]13[/C][C]246[/C][C]258[/C][C]-12[/C][/ROW]
[ROW][C]14[/C][C]294[/C][C]287[/C][C]7[/C][/ROW]
[ROW][C]15[/C][C]242[/C][C]342[/C][C]-100[/C][/ROW]
[ROW][C]16[/C][C]181[/C][C]190[/C][C]-9[/C][/ROW]
[ROW][C]17[/C][C]107[/C][C]120[/C][C]-13[/C][/ROW]
[ROW][C]18[/C][C]56[/C][C]33[/C][C]23[/C][/ROW]
[ROW][C]19[/C][C]49[/C][C]5[/C][C]44[/C][/ROW]
[ROW][C]20[/C][C]47[/C][C]42[/C][C]5[/C][/ROW]
[ROW][C]21[/C][C]47[/C][C]45[/C][C]2[/C][/ROW]
[ROW][C]22[/C][C]71[/C][C]47[/C][C]24[/C][/ROW]
[ROW][C]23[/C][C]151[/C][C]95[/C][C]56[/C][/ROW]
[ROW][C]24[/C][C]244[/C][C]231[/C][C]13[/C][/ROW]
[ROW][C]25[/C][C]280[/C][C]337[/C][C]-57[/C][/ROW]
[ROW][C]26[/C][C]230[/C][C]316[/C][C]-86[/C][/ROW]
[ROW][C]27[/C][C]185[/C][C]180[/C][C]5[/C][/ROW]
[ROW][C]28[/C][C]148[/C][C]140[/C][C]8[/C][/ROW]
[ROW][C]29[/C][C]98[/C][C]111[/C][C]-13[/C][/ROW]
[ROW][C]30[/C][C]61[/C][C]48[/C][C]13[/C][/ROW]
[ROW][C]31[/C][C]46[/C][C]24[/C][C]22[/C][/ROW]
[ROW][C]32[/C][C]45[/C][C]31[/C][C]14[/C][/ROW]
[ROW][C]33[/C][C]55[/C][C]44[/C][C]11[/C][/ROW]
[ROW][C]34[/C][C]48[/C][C]65[/C][C]-17[/C][/ROW]
[ROW][C]35[/C][C]115[/C][C]41[/C][C]74[/C][/ROW]
[ROW][C]36[/C][C]185[/C][C]182[/C][C]3[/C][/ROW]
[ROW][C]37[/C][C]276[/C][C]255[/C][C]21[/C][/ROW]
[ROW][C]38[/C][C]220[/C][C]367[/C][C]-147[/C][/ROW]
[ROW][C]39[/C][C]181[/C][C]164[/C][C]17[/C][/ROW]
[ROW][C]40[/C][C]151[/C][C]142[/C][C]9[/C][/ROW]
[ROW][C]41[/C][C]83[/C][C]121[/C][C]-38[/C][/ROW]
[ROW][C]42[/C][C]55[/C][C]15[/C][C]40[/C][/ROW]
[ROW][C]43[/C][C]49[/C][C]27[/C][C]22[/C][/ROW]
[ROW][C]44[/C][C]42[/C][C]43[/C][C]-1[/C][/ROW]
[ROW][C]45[/C][C]46[/C][C]35[/C][C]11[/C][/ROW]
[ROW][C]46[/C][C]74[/C][C]50[/C][C]24[/C][/ROW]
[ROW][C]47[/C][C]103[/C][C]102[/C][C]1[/C][/ROW]
[ROW][C]48[/C][C]200[/C][C]132[/C][C]68[/C][/ROW]
[ROW][C]49[/C][C]237[/C][C]297[/C][C]-60[/C][/ROW]
[ROW][C]50[/C][C]247[/C][C]274[/C][C]-27[/C][/ROW]
[ROW][C]51[/C][C]215[/C][C]257[/C][C]-42[/C][/ROW]
[ROW][C]52[/C][C]182[/C][C]183[/C][C]-1[/C][/ROW]
[ROW][C]53[/C][C]80[/C][C]149[/C][C]-69[/C][/ROW]
[ROW][C]54[/C][C]46[/C][C]-22[/C][C]68[/C][/ROW]
[ROW][C]55[/C][C]65[/C][C]12[/C][C]53[/C][/ROW]
[ROW][C]56[/C][C]40[/C][C]84[/C][C]-44[/C][/ROW]
[ROW][C]57[/C][C]44[/C][C]15[/C][C]29[/C][/ROW]
[ROW][C]58[/C][C]63[/C][C]48[/C][C]15[/C][/ROW]
[ROW][C]59[/C][C]85[/C][C]82[/C][C]3[/C][/ROW]
[ROW][C]60[/C][C]185[/C][C]107[/C][C]78[/C][/ROW]
[ROW][C]61[/C][C]247[/C][C]285[/C][C]-38[/C][/ROW]
[ROW][C]62[/C][C]231[/C][C]309[/C][C]-78[/C][/ROW]
[ROW][C]63[/C][C]167[/C][C]215[/C][C]-48[/C][/ROW]
[ROW][C]64[/C][C]117[/C][C]103[/C][C]14[/C][/ROW]
[ROW][C]65[/C][C]79[/C][C]67[/C][C]12[/C][/ROW]
[ROW][C]66[/C][C]45[/C][C]41[/C][C]4[/C][/ROW]
[ROW][C]67[/C][C]40[/C][C]11[/C][C]29[/C][/ROW]
[ROW][C]68[/C][C]38[/C][C]35[/C][C]3[/C][/ROW]
[ROW][C]69[/C][C]41[/C][C]36[/C][C]5[/C][/ROW]
[ROW][C]70[/C][C]69[/C][C]44[/C][C]25[/C][/ROW]
[ROW][C]71[/C][C]152[/C][C]97[/C][C]55[/C][/ROW]
[ROW][C]72[/C][C]232[/C][C]235[/C][C]-3[/C][/ROW]
[ROW][C]73[/C][C]282[/C][C]312[/C][C]-30[/C][/ROW]
[ROW][C]74[/C][C]255[/C][C]332[/C][C]-77[/C][/ROW]
[ROW][C]75[/C][C]161[/C][C]228[/C][C]-67[/C][/ROW]
[ROW][C]76[/C][C]107[/C][C]67[/C][C]40[/C][/ROW]
[ROW][C]77[/C][C]53[/C][C]53[/C][C]0[/C][/ROW]
[ROW][C]78[/C][C]40[/C][C]-1[/C][C]41[/C][/ROW]
[ROW][C]79[/C][C]39[/C][C]27[/C][C]12[/C][/ROW]
[ROW][C]80[/C][C]34[/C][C]38[/C][C]-4[/C][/ROW]
[ROW][C]81[/C][C]35[/C][C]29[/C][C]6[/C][/ROW]
[ROW][C]82[/C][C]56[/C][C]36[/C][C]20[/C][/ROW]
[ROW][C]83[/C][C]97[/C][C]77[/C][C]20[/C][/ROW]
[ROW][C]84[/C][C]210[/C][C]138[/C][C]72[/C][/ROW]
[ROW][C]85[/C][C]260[/C][C]323[/C][C]-63[/C][/ROW]
[ROW][C]86[/C][C]257[/C][C]310[/C][C]-53[/C][/ROW]
[ROW][C]87[/C][C]210[/C][C]254[/C][C]-44[/C][/ROW]
[ROW][C]88[/C][C]125[/C][C]163[/C][C]-38[/C][/ROW]
[ROW][C]89[/C][C]80[/C][C]40[/C][C]40[/C][/ROW]
[ROW][C]90[/C][C]42[/C][C]35[/C][C]7[/C][/ROW]
[ROW][C]91[/C][C]35[/C][C]4[/C][C]31[/C][/ROW]
[ROW][C]92[/C][C]31[/C][C]28[/C][C]3[/C][/ROW]
[ROW][C]93[/C][C]32[/C][C]27[/C][C]5[/C][/ROW]
[ROW][C]94[/C][C]50[/C][C]33[/C][C]17[/C][/ROW]
[ROW][C]95[/C][C]92[/C][C]68[/C][C]24[/C][/ROW]
[ROW][C]96[/C][C]189[/C][C]134[/C][C]55[/C][/ROW]
[ROW][C]97[/C][C]256[/C][C]286[/C][C]-30[/C][/ROW]
[ROW][C]98[/C][C]250[/C][C]323[/C][C]-73[/C][/ROW]
[ROW][C]99[/C][C]198[/C][C]244[/C][C]-46[/C][/ROW]
[ROW][C]100[/C][C]136[/C][C]146[/C][C]-10[/C][/ROW]
[ROW][C]101[/C][C]73[/C][C]74[/C][C]-1[/C][/ROW]
[ROW][C]102[/C][C]39[/C][C]10[/C][C]29[/C][/ROW]
[ROW][C]103[/C][C]32[/C][C]5[/C][C]27[/C][/ROW]
[ROW][C]104[/C][C]30[/C][C]25[/C][C]5[/C][/ROW]
[ROW][C]105[/C][C]31[/C][C]28[/C][C]3[/C][/ROW]
[ROW][C]106[/C][C]45[/C][C]32[/C][C]13[/C][/ROW]
[/TABLE]
Source: https://freestatistics.org/blog/index.php?pk=160689&T=2

Globally Unique Identifier (entire table): ba.freestatistics.org/blog/index.php?pk=160689&T=2

As an alternative you can also use a QR Code:  

The GUIDs for individual cells are displayed in the table below:

Interpolation Forecasts of Exponential Smoothing
tObservedFittedResiduals
3218222-4
41751741
5100132-32
6772552
74354-11
847938
94951-2
10695118
111528963
12205235-30
13246258-12
142942877
15242342-100
16181190-9
17107120-13
18563323
1949544
2047425
2147452
22714724
231519556
2424423113
25280337-57
26230316-86
271851805
281481408
2998111-13
30614813
31462422
32453114
33554411
344865-17
351154174
361851823
3727625521
38220367-147
3918116417
401511429
4183121-38
42551540
43492722
444243-1
45463511
46745024
471031021
4820013268
49237297-60
50247274-27
51215257-42
52182183-1
5380149-69
5446-2268
55651253
564084-44
57441529
58634815
5985823
6018510778
61247285-38
62231309-78
63167215-48
6411710314
65796712
6645414
67401129
6838353
6941365
70694425
711529755
72232235-3
73282312-30
74255332-77
75161228-67
761076740
7753530
7840-141
79392712
803438-4
8135296
82563620
83977720
8421013872
85260323-63
86257310-53
87210254-44
88125163-38
89804040
9042357
9135431
9231283
9332275
94503317
95926824
9618913455
97256286-30
98250323-73
99198244-46
100136146-10
1017374-1
102391029
10332527
10430255
10531283
106453213


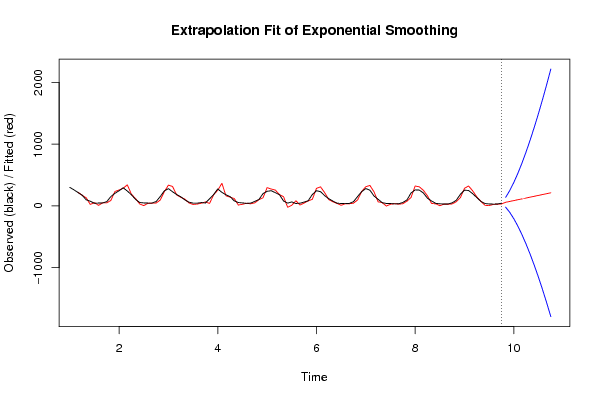
Extrapolation Forecasts of Exponential Smoothing
tForecast95% Lower Bound95% Upper Bound
10759-19.6858341499532137.685834149953
10873-102.94687402557248.94687402557
10987-207.415432581641381.415432581641
110101-329.980063200397531.980063200397
111115-468.549764178743698.549764178743
112129-621.615017918326879.615017918326
113143-788.0233452617341074.02334526173
114157-966.8585058441671280.85850584417
115171-1157.369768296491499.36976829649
116185-1358.927553647341728.92755364734
117199-1570.994070869221968.99407086922
118213-1793.103018869682219.10301886968

\begin{tabular}{lllllllll}
\hline
Extrapolation Forecasts of Exponential Smoothing \tabularnewline
t & Forecast & 95% Lower Bound & 95% Upper Bound \tabularnewline
107 & 59 & -19.6858341499532 & 137.685834149953 \tabularnewline
108 & 73 & -102.94687402557 & 248.94687402557 \tabularnewline
109 & 87 & -207.415432581641 & 381.415432581641 \tabularnewline
110 & 101 & -329.980063200397 & 531.980063200397 \tabularnewline
111 & 115 & -468.549764178743 & 698.549764178743 \tabularnewline
112 & 129 & -621.615017918326 & 879.615017918326 \tabularnewline
113 & 143 & -788.023345261734 & 1074.02334526173 \tabularnewline
114 & 157 & -966.858505844167 & 1280.85850584417 \tabularnewline
115 & 171 & -1157.36976829649 & 1499.36976829649 \tabularnewline
116 & 185 & -1358.92755364734 & 1728.92755364734 \tabularnewline
117 & 199 & -1570.99407086922 & 1968.99407086922 \tabularnewline
118 & 213 & -1793.10301886968 & 2219.10301886968 \tabularnewline
\hline
\end{tabular}
%Source: https://freestatistics.org/blog/index.php?pk=160689&T=3

[TABLE]
[ROW][C]Extrapolation Forecasts of Exponential Smoothing[/C][/ROW]
[ROW][C]t[/C][C]Forecast[/C][C]95% Lower Bound[/C][C]95% Upper Bound[/C][/ROW]
[ROW][C]107[/C][C]59[/C][C]-19.6858341499532[/C][C]137.685834149953[/C][/ROW]
[ROW][C]108[/C][C]73[/C][C]-102.94687402557[/C][C]248.94687402557[/C][/ROW]
[ROW][C]109[/C][C]87[/C][C]-207.415432581641[/C][C]381.415432581641[/C][/ROW]
[ROW][C]110[/C][C]101[/C][C]-329.980063200397[/C][C]531.980063200397[/C][/ROW]
[ROW][C]111[/C][C]115[/C][C]-468.549764178743[/C][C]698.549764178743[/C][/ROW]
[ROW][C]112[/C][C]129[/C][C]-621.615017918326[/C][C]879.615017918326[/C][/ROW]
[ROW][C]113[/C][C]143[/C][C]-788.023345261734[/C][C]1074.02334526173[/C][/ROW]
[ROW][C]114[/C][C]157[/C][C]-966.858505844167[/C][C]1280.85850584417[/C][/ROW]
[ROW][C]115[/C][C]171[/C][C]-1157.36976829649[/C][C]1499.36976829649[/C][/ROW]
[ROW][C]116[/C][C]185[/C][C]-1358.92755364734[/C][C]1728.92755364734[/C][/ROW]
[ROW][C]117[/C][C]199[/C][C]-1570.99407086922[/C][C]1968.99407086922[/C][/ROW]
[ROW][C]118[/C][C]213[/C][C]-1793.10301886968[/C][C]2219.10301886968[/C][/ROW]
[/TABLE]
Source: https://freestatistics.org/blog/index.php?pk=160689&T=3

Globally Unique Identifier (entire table): ba.freestatistics.org/blog/index.php?pk=160689&T=3

As an alternative you can also use a QR Code:  

The GUIDs for individual cells are displayed in the table below:

Extrapolation Forecasts of Exponential Smoothing
tForecast95% Lower Bound95% Upper Bound
10759-19.6858341499532137.685834149953
10873-102.94687402557248.94687402557
10987-207.415432581641381.415432581641
110101-329.980063200397531.980063200397
111115-468.549764178743698.549764178743
112129-621.615017918326879.615017918326
113143-788.0233452617341074.02334526173
114157-966.8585058441671280.85850584417
115171-1157.369768296491499.36976829649
116185-1358.927553647341728.92755364734
117199-1570.994070869221968.99407086922
118213-1793.103018869682219.10301886968


Parameters (Session):
par1 = 12 ; par2 = Double ; par3 = additive ;
Parameters (R input):
par1 = 12 ; par2 = Double ; par3 = additive ;
R code (references can be found in the software module):
par1 <- as.numeric(par1)
if (par2 == 'Single') K <- 1
if (par2 == 'Double') K <- 2
if (par2 == 'Triple') K <- par1
nx <- length(x)
nxmK <- nx - K
x <- ts(x, frequency = par1)
if (par2 == 'Single') fit <- HoltWinters(x, gamma=F, beta=F)
if (par2 == 'Double') fit <- HoltWinters(x, gamma=F)
if (par2 == 'Triple') fit <- HoltWinters(x, seasonal=par3)
fit
myresid <- x - fit$fitted[,'xhat']
bitmap(file='test1.png')
op <- par(mfrow=c(2,1))
plot(fit,ylab='Observed (black) / Fitted (red)',main='Interpolation Fit of Exponential Smoothing')
plot(myresid,ylab='Residuals',main='Interpolation Prediction Errors')
par(op)
dev.off()
bitmap(file='test2.png')
p <- predict(fit, par1, prediction.interval=TRUE)
np <- length(p[,1])
plot(fit,p,ylab='Observed (black) / Fitted (red)',main='Extrapolation Fit of Exponential Smoothing')
dev.off()
bitmap(file='test3.png')
op <- par(mfrow = c(2,2))
acf(as.numeric(myresid),lag.max = nx/2,main='Residual ACF')
spectrum(myresid,main='Residals Periodogram')
cpgram(myresid,main='Residal Cumulative Periodogram')
qqnorm(myresid,main='Residual Normal QQ Plot')
qqline(myresid)
par(op)
dev.off()
load(file='createtable')
a<-table.start()
a<-table.row.start(a)
a<-table.element(a,'Estimated Parameters of Exponential Smoothing',2,TRUE)
a<-table.row.end(a)
a<-table.row.start(a)
a<-table.element(a,'Parameter',header=TRUE)
a<-table.element(a,'Value',header=TRUE)
a<-table.row.end(a)
a<-table.row.start(a)
a<-table.element(a,'alpha',header=TRUE)
a<-table.element(a,fit$alpha)
a<-table.row.end(a)
a<-table.row.start(a)
a<-table.element(a,'beta',header=TRUE)
a<-table.element(a,fit$beta)
a<-table.row.end(a)
a<-table.row.start(a)
a<-table.element(a,'gamma',header=TRUE)
a<-table.element(a,fit$gamma)
a<-table.row.end(a)
a<-table.end(a)
table.save(a,file='mytable.tab')
a<-table.start()
a<-table.row.start(a)
a<-table.element(a,'Interpolation Forecasts of Exponential Smoothing',4,TRUE)
a<-table.row.end(a)
a<-table.row.start(a)
a<-table.element(a,'t',header=TRUE)
a<-table.element(a,'Observed',header=TRUE)
a<-table.element(a,'Fitted',header=TRUE)
a<-table.element(a,'Residuals',header=TRUE)
a<-table.row.end(a)
for (i in 1:nxmK) {
a<-table.row.start(a)
a<-table.element(a,i+K,header=TRUE)
a<-table.element(a,x[i+K])
a<-table.element(a,fit$fitted[i,'xhat'])
a<-table.element(a,myresid[i])
a<-table.row.end(a)
}
a<-table.end(a)
table.save(a,file='mytable1.tab')
a<-table.start()
a<-table.row.start(a)
a<-table.element(a,'Extrapolation Forecasts of Exponential Smoothing',4,TRUE)
a<-table.row.end(a)
a<-table.row.start(a)
a<-table.element(a,'t',header=TRUE)
a<-table.element(a,'Forecast',header=TRUE)
a<-table.element(a,'95% Lower Bound',header=TRUE)
a<-table.element(a,'95% Upper Bound',header=TRUE)
a<-table.row.end(a)
for (i in 1:np) {
a<-table.row.start(a)
a<-table.element(a,nx+i,header=TRUE)
a<-table.element(a,p[i,'fit'])
a<-table.element(a,p[i,'lwr'])
a<-table.element(a,p[i,'upr'])
a<-table.row.end(a)
}
a<-table.end(a)
table.save(a,file='mytable2.tab')