Free Statistics

of Irreproducible Research!

Author's title

Author*The author of this computation has been verified*
R Software Modulerwasp_arimaforecasting.wasp
Title produced by softwareARIMA Forecasting
Date of computationFri, 23 Dec 2011 14:24:36 -0500
Cite this page as followsStatistical Computations at FreeStatistics.org, Office for Research Development and Education, URL https://freestatistics.org/blog/index.php?v=date/2011/Dec/23/t1324668294sewc5d6u84hxis6.htm/, Retrieved Mon, 29 Apr 2024 18:43:35 +0000
Statistical Computations at FreeStatistics.org, Office for Research Development and Education, URL https://freestatistics.org/blog/index.php?pk=160675, Retrieved Mon, 29 Apr 2024 18:43:35 +0000
QR Codes:

Original text written by user:
IsPrivate?No (this computation is public)
User-defined keywords
Estimated Impact61
Family? (F = Feedback message, R = changed R code, M = changed R Module, P = changed Parameters, D = changed Data)
-     [Spectral Analysis] [] [2011-12-23 18:50:40] [2ba7ee2cbaa966a49160c7cfb7436069]
- RMP     [ARIMA Forecasting] [] [2011-12-23 19:24:36] [393d554610c677f923bed472882d0fdb] [Current]
Feedback Forum

Post a new message
Dataseries X:
302
262
218
175
100
77
43
47
49
69
152
205
246
294
242
181
107
56
49
47
47
71
151
244
280
230
185
148
98
61
46
45
55
48
115
185
276
220
181
151
83
55
49
42
46
74
103
200
237
247
215
182
80
46
65
40
44
63
85
185
247
231
167
117
79
45
40
38
41
69
152
232
282
255
161
107
53
40
39
34
35
56
97
210
260
257
210
125
80
42
35
31
32
50
92
189
256
250
198
136
73
39
32
30
31
45


Summary of computational transaction
Raw Inputview raw input (R code)
Raw Outputview raw output of R engine
Computing time1 seconds
R Server'Gwilym Jenkins' @ jenkins.wessa.net

\begin{tabular}{lllllllll}
\hline
Summary of computational transaction \tabularnewline
Raw Input & view raw input (R code)  \tabularnewline
Raw Output & view raw output of R engine  \tabularnewline
Computing time & 1 seconds \tabularnewline
R Server & 'Gwilym Jenkins' @ jenkins.wessa.net \tabularnewline
\hline
\end{tabular}
%Source: https://freestatistics.org/blog/index.php?pk=160675&T=0

[TABLE]
[ROW][C]Summary of computational transaction[/C][/ROW]
[ROW][C]Raw Input[/C][C]view raw input (R code) [/C][/ROW]
[ROW][C]Raw Output[/C][C]view raw output of R engine [/C][/ROW]
[ROW][C]Computing time[/C][C]1 seconds[/C][/ROW]
[ROW][C]R Server[/C][C]'Gwilym Jenkins' @ jenkins.wessa.net[/C][/ROW]
[/TABLE]
Source: https://freestatistics.org/blog/index.php?pk=160675&T=0

Globally Unique Identifier (entire table): ba.freestatistics.org/blog/index.php?pk=160675&T=0

As an alternative you can also use a QR Code:  

The GUIDs for individual cells are displayed in the table below:

Summary of computational transaction
Raw Inputview raw input (R code)
Raw Outputview raw output of R engine
Computing time1 seconds
R Server'Gwilym Jenkins' @ jenkins.wessa.net


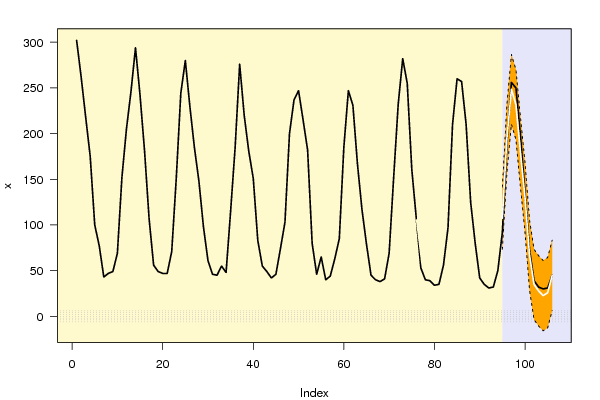
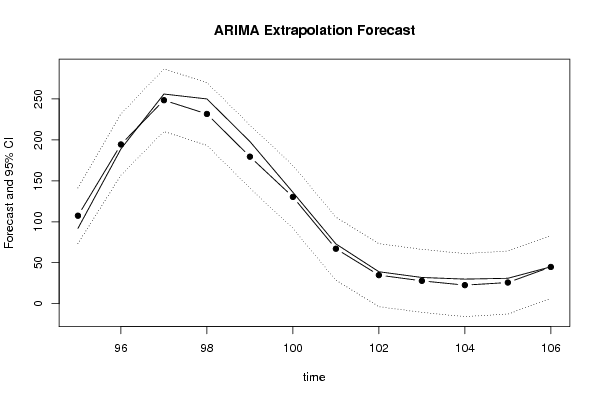
Univariate ARIMA Extrapolation Forecast
timeY[t]F[t]95% LB95% UBp-value(H0: Y[t] = F[t])P(F[t]>Y[t-1])P(F[t]>Y[t-s])P(F[t]>Y[94])
8256-------
8397-------
84210-------
85260-------
86257-------
87210-------
88125-------
8980-------
9042-------
9135-------
9231-------
9332-------
9450-------
9592107.402373.3611141.44340.18760.99950.72540.9995
96189194.4017156.9558231.84770.388710.20711
97256248.4663210.3099286.62260.34940.99890.27681
98250231.6556193.2886270.02260.17430.10680.09771
99198179.5048141.0679217.94160.17282e-040.061
100136130.369391.9061168.83250.38713e-040.60781
1017367.116328.6424105.59030.38222e-040.25580.8084
1023934.8685-3.610473.34730.41670.0260.35820.2204
1033227.8774-10.604566.35920.41680.28550.35840.1299
1043022.6496-15.835661.13480.35410.3170.33530.0818
1053125.8272-12.664264.31870.39610.41590.37660.1092
1064544.82526.320583.32990.49650.75920.39610.3961

\begin{tabular}{lllllllll}
\hline
Univariate ARIMA Extrapolation Forecast \tabularnewline
time & Y[t] & F[t] & 95% LB & 95% UB & p-value(H0: Y[t] = F[t]) & P(F[t]>Y[t-1]) & P(F[t]>Y[t-s]) & P(F[t]>Y[94]) \tabularnewline
82 & 56 & - & - & - & - & - & - & - \tabularnewline
83 & 97 & - & - & - & - & - & - & - \tabularnewline
84 & 210 & - & - & - & - & - & - & - \tabularnewline
85 & 260 & - & - & - & - & - & - & - \tabularnewline
86 & 257 & - & - & - & - & - & - & - \tabularnewline
87 & 210 & - & - & - & - & - & - & - \tabularnewline
88 & 125 & - & - & - & - & - & - & - \tabularnewline
89 & 80 & - & - & - & - & - & - & - \tabularnewline
90 & 42 & - & - & - & - & - & - & - \tabularnewline
91 & 35 & - & - & - & - & - & - & - \tabularnewline
92 & 31 & - & - & - & - & - & - & - \tabularnewline
93 & 32 & - & - & - & - & - & - & - \tabularnewline
94 & 50 & - & - & - & - & - & - & - \tabularnewline
95 & 92 & 107.4023 & 73.3611 & 141.4434 & 0.1876 & 0.9995 & 0.7254 & 0.9995 \tabularnewline
96 & 189 & 194.4017 & 156.9558 & 231.8477 & 0.3887 & 1 & 0.2071 & 1 \tabularnewline
97 & 256 & 248.4663 & 210.3099 & 286.6226 & 0.3494 & 0.9989 & 0.2768 & 1 \tabularnewline
98 & 250 & 231.6556 & 193.2886 & 270.0226 & 0.1743 & 0.1068 & 0.0977 & 1 \tabularnewline
99 & 198 & 179.5048 & 141.0679 & 217.9416 & 0.1728 & 2e-04 & 0.06 & 1 \tabularnewline
100 & 136 & 130.3693 & 91.9061 & 168.8325 & 0.3871 & 3e-04 & 0.6078 & 1 \tabularnewline
101 & 73 & 67.1163 & 28.6424 & 105.5903 & 0.3822 & 2e-04 & 0.2558 & 0.8084 \tabularnewline
102 & 39 & 34.8685 & -3.6104 & 73.3473 & 0.4167 & 0.026 & 0.3582 & 0.2204 \tabularnewline
103 & 32 & 27.8774 & -10.6045 & 66.3592 & 0.4168 & 0.2855 & 0.3584 & 0.1299 \tabularnewline
104 & 30 & 22.6496 & -15.8356 & 61.1348 & 0.3541 & 0.317 & 0.3353 & 0.0818 \tabularnewline
105 & 31 & 25.8272 & -12.6642 & 64.3187 & 0.3961 & 0.4159 & 0.3766 & 0.1092 \tabularnewline
106 & 45 & 44.8252 & 6.3205 & 83.3299 & 0.4965 & 0.7592 & 0.3961 & 0.3961 \tabularnewline
\hline
\end{tabular}
%Source: https://freestatistics.org/blog/index.php?pk=160675&T=1

[TABLE]
[ROW][C]Univariate ARIMA Extrapolation Forecast[/C][/ROW]
[ROW][C]time[/C][C]Y[t][/C][C]F[t][/C][C]95% LB[/C][C]95% UB[/C][C]p-value(H0: Y[t] = F[t])[/C][C]P(F[t]>Y[t-1])[/C][C]P(F[t]>Y[t-s])[/C][C]P(F[t]>Y[94])[/C][/ROW]
[ROW][C]82[/C][C]56[/C][C]-[/C][C]-[/C][C]-[/C][C]-[/C][C]-[/C][C]-[/C][C]-[/C][/ROW]
[ROW][C]83[/C][C]97[/C][C]-[/C][C]-[/C][C]-[/C][C]-[/C][C]-[/C][C]-[/C][C]-[/C][/ROW]
[ROW][C]84[/C][C]210[/C][C]-[/C][C]-[/C][C]-[/C][C]-[/C][C]-[/C][C]-[/C][C]-[/C][/ROW]
[ROW][C]85[/C][C]260[/C][C]-[/C][C]-[/C][C]-[/C][C]-[/C][C]-[/C][C]-[/C][C]-[/C][/ROW]
[ROW][C]86[/C][C]257[/C][C]-[/C][C]-[/C][C]-[/C][C]-[/C][C]-[/C][C]-[/C][C]-[/C][/ROW]
[ROW][C]87[/C][C]210[/C][C]-[/C][C]-[/C][C]-[/C][C]-[/C][C]-[/C][C]-[/C][C]-[/C][/ROW]
[ROW][C]88[/C][C]125[/C][C]-[/C][C]-[/C][C]-[/C][C]-[/C][C]-[/C][C]-[/C][C]-[/C][/ROW]
[ROW][C]89[/C][C]80[/C][C]-[/C][C]-[/C][C]-[/C][C]-[/C][C]-[/C][C]-[/C][C]-[/C][/ROW]
[ROW][C]90[/C][C]42[/C][C]-[/C][C]-[/C][C]-[/C][C]-[/C][C]-[/C][C]-[/C][C]-[/C][/ROW]
[ROW][C]91[/C][C]35[/C][C]-[/C][C]-[/C][C]-[/C][C]-[/C][C]-[/C][C]-[/C][C]-[/C][/ROW]
[ROW][C]92[/C][C]31[/C][C]-[/C][C]-[/C][C]-[/C][C]-[/C][C]-[/C][C]-[/C][C]-[/C][/ROW]
[ROW][C]93[/C][C]32[/C][C]-[/C][C]-[/C][C]-[/C][C]-[/C][C]-[/C][C]-[/C][C]-[/C][/ROW]
[ROW][C]94[/C][C]50[/C][C]-[/C][C]-[/C][C]-[/C][C]-[/C][C]-[/C][C]-[/C][C]-[/C][/ROW]
[ROW][C]95[/C][C]92[/C][C]107.4023[/C][C]73.3611[/C][C]141.4434[/C][C]0.1876[/C][C]0.9995[/C][C]0.7254[/C][C]0.9995[/C][/ROW]
[ROW][C]96[/C][C]189[/C][C]194.4017[/C][C]156.9558[/C][C]231.8477[/C][C]0.3887[/C][C]1[/C][C]0.2071[/C][C]1[/C][/ROW]
[ROW][C]97[/C][C]256[/C][C]248.4663[/C][C]210.3099[/C][C]286.6226[/C][C]0.3494[/C][C]0.9989[/C][C]0.2768[/C][C]1[/C][/ROW]
[ROW][C]98[/C][C]250[/C][C]231.6556[/C][C]193.2886[/C][C]270.0226[/C][C]0.1743[/C][C]0.1068[/C][C]0.0977[/C][C]1[/C][/ROW]
[ROW][C]99[/C][C]198[/C][C]179.5048[/C][C]141.0679[/C][C]217.9416[/C][C]0.1728[/C][C]2e-04[/C][C]0.06[/C][C]1[/C][/ROW]
[ROW][C]100[/C][C]136[/C][C]130.3693[/C][C]91.9061[/C][C]168.8325[/C][C]0.3871[/C][C]3e-04[/C][C]0.6078[/C][C]1[/C][/ROW]
[ROW][C]101[/C][C]73[/C][C]67.1163[/C][C]28.6424[/C][C]105.5903[/C][C]0.3822[/C][C]2e-04[/C][C]0.2558[/C][C]0.8084[/C][/ROW]
[ROW][C]102[/C][C]39[/C][C]34.8685[/C][C]-3.6104[/C][C]73.3473[/C][C]0.4167[/C][C]0.026[/C][C]0.3582[/C][C]0.2204[/C][/ROW]
[ROW][C]103[/C][C]32[/C][C]27.8774[/C][C]-10.6045[/C][C]66.3592[/C][C]0.4168[/C][C]0.2855[/C][C]0.3584[/C][C]0.1299[/C][/ROW]
[ROW][C]104[/C][C]30[/C][C]22.6496[/C][C]-15.8356[/C][C]61.1348[/C][C]0.3541[/C][C]0.317[/C][C]0.3353[/C][C]0.0818[/C][/ROW]
[ROW][C]105[/C][C]31[/C][C]25.8272[/C][C]-12.6642[/C][C]64.3187[/C][C]0.3961[/C][C]0.4159[/C][C]0.3766[/C][C]0.1092[/C][/ROW]
[ROW][C]106[/C][C]45[/C][C]44.8252[/C][C]6.3205[/C][C]83.3299[/C][C]0.4965[/C][C]0.7592[/C][C]0.3961[/C][C]0.3961[/C][/ROW]
[/TABLE]
Source: https://freestatistics.org/blog/index.php?pk=160675&T=1

Globally Unique Identifier (entire table): ba.freestatistics.org/blog/index.php?pk=160675&T=1

As an alternative you can also use a QR Code:  

The GUIDs for individual cells are displayed in the table below:

Univariate ARIMA Extrapolation Forecast
timeY[t]F[t]95% LB95% UBp-value(H0: Y[t] = F[t])P(F[t]>Y[t-1])P(F[t]>Y[t-s])P(F[t]>Y[94])
8256-------
8397-------
84210-------
85260-------
86257-------
87210-------
88125-------
8980-------
9042-------
9135-------
9231-------
9332-------
9450-------
9592107.402373.3611141.44340.18760.99950.72540.9995
96189194.4017156.9558231.84770.388710.20711
97256248.4663210.3099286.62260.34940.99890.27681
98250231.6556193.2886270.02260.17430.10680.09771
99198179.5048141.0679217.94160.17282e-040.061
100136130.369391.9061168.83250.38713e-040.60781
1017367.116328.6424105.59030.38222e-040.25580.8084
1023934.8685-3.610473.34730.41670.0260.35820.2204
1033227.8774-10.604566.35920.41680.28550.35840.1299
1043022.6496-15.835661.13480.35410.3170.33530.0818
1053125.8272-12.664264.31870.39610.41590.37660.1092
1064544.82526.320583.32990.49650.75920.39610.3961


Univariate ARIMA Extrapolation Forecast Performance
time% S.E.PEMAPESq.EMSERMSE
950.1617-0.14340237.230200
960.0983-0.02780.085629.1788133.204511.5414
970.07840.03030.067256.7568107.721910.3789
980.08450.07920.0702336.5169164.920712.8421
990.10920.1030.0767342.0734200.351214.1545
1000.15050.04320.071231.7051172.243513.1242
1010.29250.08770.073534.6174152.582712.3524
1020.5630.11850.079117.0695135.643511.6466
1030.70430.14790.086816.9962122.460511.0662
1040.86690.32450.110554.0281115.617210.7525
1050.76040.20030.118726.7575107.539110.3701
1060.43830.00390.10910.030698.589.9287

\begin{tabular}{lllllllll}
\hline
Univariate ARIMA Extrapolation Forecast Performance \tabularnewline
time & % S.E. & PE & MAPE & Sq.E & MSE & RMSE \tabularnewline
95 & 0.1617 & -0.1434 & 0 & 237.2302 & 0 & 0 \tabularnewline
96 & 0.0983 & -0.0278 & 0.0856 & 29.1788 & 133.2045 & 11.5414 \tabularnewline
97 & 0.0784 & 0.0303 & 0.0672 & 56.7568 & 107.7219 & 10.3789 \tabularnewline
98 & 0.0845 & 0.0792 & 0.0702 & 336.5169 & 164.9207 & 12.8421 \tabularnewline
99 & 0.1092 & 0.103 & 0.0767 & 342.0734 & 200.3512 & 14.1545 \tabularnewline
100 & 0.1505 & 0.0432 & 0.0712 & 31.7051 & 172.2435 & 13.1242 \tabularnewline
101 & 0.2925 & 0.0877 & 0.0735 & 34.6174 & 152.5827 & 12.3524 \tabularnewline
102 & 0.563 & 0.1185 & 0.0791 & 17.0695 & 135.6435 & 11.6466 \tabularnewline
103 & 0.7043 & 0.1479 & 0.0868 & 16.9962 & 122.4605 & 11.0662 \tabularnewline
104 & 0.8669 & 0.3245 & 0.1105 & 54.0281 & 115.6172 & 10.7525 \tabularnewline
105 & 0.7604 & 0.2003 & 0.1187 & 26.7575 & 107.5391 & 10.3701 \tabularnewline
106 & 0.4383 & 0.0039 & 0.1091 & 0.0306 & 98.58 & 9.9287 \tabularnewline
\hline
\end{tabular}
%Source: https://freestatistics.org/blog/index.php?pk=160675&T=2

[TABLE]
[ROW][C]Univariate ARIMA Extrapolation Forecast Performance[/C][/ROW]
[ROW][C]time[/C][C]% S.E.[/C][C]PE[/C][C]MAPE[/C][C]Sq.E[/C][C]MSE[/C][C]RMSE[/C][/ROW]
[ROW][C]95[/C][C]0.1617[/C][C]-0.1434[/C][C]0[/C][C]237.2302[/C][C]0[/C][C]0[/C][/ROW]
[ROW][C]96[/C][C]0.0983[/C][C]-0.0278[/C][C]0.0856[/C][C]29.1788[/C][C]133.2045[/C][C]11.5414[/C][/ROW]
[ROW][C]97[/C][C]0.0784[/C][C]0.0303[/C][C]0.0672[/C][C]56.7568[/C][C]107.7219[/C][C]10.3789[/C][/ROW]
[ROW][C]98[/C][C]0.0845[/C][C]0.0792[/C][C]0.0702[/C][C]336.5169[/C][C]164.9207[/C][C]12.8421[/C][/ROW]
[ROW][C]99[/C][C]0.1092[/C][C]0.103[/C][C]0.0767[/C][C]342.0734[/C][C]200.3512[/C][C]14.1545[/C][/ROW]
[ROW][C]100[/C][C]0.1505[/C][C]0.0432[/C][C]0.0712[/C][C]31.7051[/C][C]172.2435[/C][C]13.1242[/C][/ROW]
[ROW][C]101[/C][C]0.2925[/C][C]0.0877[/C][C]0.0735[/C][C]34.6174[/C][C]152.5827[/C][C]12.3524[/C][/ROW]
[ROW][C]102[/C][C]0.563[/C][C]0.1185[/C][C]0.0791[/C][C]17.0695[/C][C]135.6435[/C][C]11.6466[/C][/ROW]
[ROW][C]103[/C][C]0.7043[/C][C]0.1479[/C][C]0.0868[/C][C]16.9962[/C][C]122.4605[/C][C]11.0662[/C][/ROW]
[ROW][C]104[/C][C]0.8669[/C][C]0.3245[/C][C]0.1105[/C][C]54.0281[/C][C]115.6172[/C][C]10.7525[/C][/ROW]
[ROW][C]105[/C][C]0.7604[/C][C]0.2003[/C][C]0.1187[/C][C]26.7575[/C][C]107.5391[/C][C]10.3701[/C][/ROW]
[ROW][C]106[/C][C]0.4383[/C][C]0.0039[/C][C]0.1091[/C][C]0.0306[/C][C]98.58[/C][C]9.9287[/C][/ROW]
[/TABLE]
Source: https://freestatistics.org/blog/index.php?pk=160675&T=2

Globally Unique Identifier (entire table): ba.freestatistics.org/blog/index.php?pk=160675&T=2

As an alternative you can also use a QR Code:  

The GUIDs for individual cells are displayed in the table below:

Univariate ARIMA Extrapolation Forecast Performance
time% S.E.PEMAPESq.EMSERMSE
950.1617-0.14340237.230200
960.0983-0.02780.085629.1788133.204511.5414
970.07840.03030.067256.7568107.721910.3789
980.08450.07920.0702336.5169164.920712.8421
990.10920.1030.0767342.0734200.351214.1545
1000.15050.04320.071231.7051172.243513.1242
1010.29250.08770.073534.6174152.582712.3524
1020.5630.11850.079117.0695135.643511.6466
1030.70430.14790.086816.9962122.460511.0662
1040.86690.32450.110554.0281115.617210.7525
1050.76040.20030.118726.7575107.539110.3701
1060.43830.00390.10910.030698.589.9287


Parameters (Session):
par1 = 12 ; par2 = 1 ; par3 = 1 ; par4 = 1 ; par5 = 12 ; par6 = 1 ; par7 = 1 ; par8 = 0 ; par9 = 1 ; par10 = FALSE ;
Parameters (R input):
par1 = 12 ; par2 = 1 ; par3 = 1 ; par4 = 1 ; par5 = 12 ; par6 = 1 ; par7 = 1 ; par8 = 0 ; par9 = 1 ; par10 = FALSE ;
R code (references can be found in the software module):
par1 <- as.numeric(par1) #cut off periods
par2 <- as.numeric(par2) #lambda
par3 <- as.numeric(par3) #degree of non-seasonal differencing
par4 <- as.numeric(par4) #degree of seasonal differencing
par5 <- as.numeric(par5) #seasonal period
par6 <- as.numeric(par6) #p
par7 <- as.numeric(par7) #q
par8 <- as.numeric(par8) #P
par9 <- as.numeric(par9) #Q
if (par10 == 'TRUE') par10 <- TRUE
if (par10 == 'FALSE') par10 <- FALSE
if (par2 == 0) x <- log(x)
if (par2 != 0) x <- x^par2
lx <- length(x)
first <- lx - 2*par1
nx <- lx - par1
nx1 <- nx + 1
fx <- lx - nx
if (fx < 1) {
fx <- par5
nx1 <- lx + fx - 1
first <- lx - 2*fx
}
first <- 1
if (fx < 3) fx <- round(lx/10,0)
(arima.out <- arima(x[1:nx], order=c(par6,par3,par7), seasonal=list(order=c(par8,par4,par9), period=par5), include.mean=par10, method='ML'))
(forecast <- predict(arima.out,par1))
(lb <- forecast$pred - 1.96 * forecast$se)
(ub <- forecast$pred + 1.96 * forecast$se)
if (par2 == 0) {
x <- exp(x)
forecast$pred <- exp(forecast$pred)
lb <- exp(lb)
ub <- exp(ub)
}
if (par2 != 0) {
x <- x^(1/par2)
forecast$pred <- forecast$pred^(1/par2)
lb <- lb^(1/par2)
ub <- ub^(1/par2)
}
if (par2 < 0) {
olb <- lb
lb <- ub
ub <- olb
}
(actandfor <- c(x[1:nx], forecast$pred))
(perc.se <- (ub-forecast$pred)/1.96/forecast$pred)
bitmap(file='test1.png')
opar <- par(mar=c(4,4,2,2),las=1)
ylim <- c( min(x[first:nx],lb), max(x[first:nx],ub))
plot(x,ylim=ylim,type='n',xlim=c(first,lx))
usr <- par('usr')
rect(usr[1],usr[3],nx+1,usr[4],border=NA,col='lemonchiffon')
rect(nx1,usr[3],usr[2],usr[4],border=NA,col='lavender')
abline(h= (-3:3)*2 , col ='gray', lty =3)
polygon( c(nx1:lx,lx:nx1), c(lb,rev(ub)), col = 'orange', lty=2,border=NA)
lines(nx1:lx, lb , lty=2)
lines(nx1:lx, ub , lty=2)
lines(x, lwd=2)
lines(nx1:lx, forecast$pred , lwd=2 , col ='white')
box()
par(opar)
dev.off()
prob.dec <- array(NA, dim=fx)
prob.sdec <- array(NA, dim=fx)
prob.ldec <- array(NA, dim=fx)
prob.pval <- array(NA, dim=fx)
perf.pe <- array(0, dim=fx)
perf.mape <- array(0, dim=fx)
perf.mape1 <- array(0, dim=fx)
perf.se <- array(0, dim=fx)
perf.mse <- array(0, dim=fx)
perf.mse1 <- array(0, dim=fx)
perf.rmse <- array(0, dim=fx)
for (i in 1:fx) {
locSD <- (ub[i] - forecast$pred[i]) / 1.96
perf.pe[i] = (x[nx+i] - forecast$pred[i]) / forecast$pred[i]
perf.se[i] = (x[nx+i] - forecast$pred[i])^2
prob.dec[i] = pnorm((x[nx+i-1] - forecast$pred[i]) / locSD)
prob.sdec[i] = pnorm((x[nx+i-par5] - forecast$pred[i]) / locSD)
prob.ldec[i] = pnorm((x[nx] - forecast$pred[i]) / locSD)
prob.pval[i] = pnorm(abs(x[nx+i] - forecast$pred[i]) / locSD)
}
perf.mape[1] = abs(perf.pe[1])
perf.mse[1] = abs(perf.se[1])
for (i in 2:fx) {
perf.mape[i] = perf.mape[i-1] + abs(perf.pe[i])
perf.mape1[i] = perf.mape[i] / i
perf.mse[i] = perf.mse[i-1] + perf.se[i]
perf.mse1[i] = perf.mse[i] / i
}
perf.rmse = sqrt(perf.mse1)
bitmap(file='test2.png')
plot(forecast$pred, pch=19, type='b',main='ARIMA Extrapolation Forecast', ylab='Forecast and 95% CI', xlab='time',ylim=c(min(lb),max(ub)))
dum <- forecast$pred
dum[1:par1] <- x[(nx+1):lx]
lines(dum, lty=1)
lines(ub,lty=3)
lines(lb,lty=3)
dev.off()
load(file='createtable')
a<-table.start()
a<-table.row.start(a)
a<-table.element(a,'Univariate ARIMA Extrapolation Forecast',9,TRUE)
a<-table.row.end(a)
a<-table.row.start(a)
a<-table.element(a,'time',1,header=TRUE)
a<-table.element(a,'Y[t]',1,header=TRUE)
a<-table.element(a,'F[t]',1,header=TRUE)
a<-table.element(a,'95% LB',1,header=TRUE)
a<-table.element(a,'95% UB',1,header=TRUE)
a<-table.element(a,'p-value
(H0: Y[t] = F[t])',1,header=TRUE)
a<-table.element(a,'P(F[t]>Y[t-1])',1,header=TRUE)
a<-table.element(a,'P(F[t]>Y[t-s])',1,header=TRUE)
mylab <- paste('P(F[t]>Y[',nx,sep='')
mylab <- paste(mylab,'])',sep='')
a<-table.element(a,mylab,1,header=TRUE)
a<-table.row.end(a)
for (i in (nx-par5):nx) {
a<-table.row.start(a)
a<-table.element(a,i,header=TRUE)
a<-table.element(a,x[i])
a<-table.element(a,'-')
a<-table.row.end(a)
}
for (i in 1:fx) {
a<-table.row.start(a)
a<-table.element(a,nx+i,header=TRUE)
a<-table.element(a,round(x[nx+i],4))
a<-table.element(a,round(forecast$pred[i],4))
a<-table.element(a,round(lb[i],4))
a<-table.element(a,round(ub[i],4))
a<-table.element(a,round((1-prob.pval[i]),4))
a<-table.element(a,round((1-prob.dec[i]),4))
a<-table.element(a,round((1-prob.sdec[i]),4))
a<-table.element(a,round((1-prob.ldec[i]),4))
a<-table.row.end(a)
}
a<-table.end(a)
table.save(a,file='mytable.tab')
a<-table.start()
a<-table.row.start(a)
a<-table.element(a,'Univariate ARIMA Extrapolation Forecast Performance',7,TRUE)
a<-table.row.end(a)
a<-table.row.start(a)
a<-table.element(a,'time',1,header=TRUE)
a<-table.element(a,'% S.E.',1,header=TRUE)
a<-table.element(a,'PE',1,header=TRUE)
a<-table.element(a,'MAPE',1,header=TRUE)
a<-table.element(a,'Sq.E',1,header=TRUE)
a<-table.element(a,'MSE',1,header=TRUE)
a<-table.element(a,'RMSE',1,header=TRUE)
a<-table.row.end(a)
for (i in 1:fx) {
a<-table.row.start(a)
a<-table.element(a,nx+i,header=TRUE)
a<-table.element(a,round(perc.se[i],4))
a<-table.element(a,round(perf.pe[i],4))
a<-table.element(a,round(perf.mape1[i],4))
a<-table.element(a,round(perf.se[i],4))
a<-table.element(a,round(perf.mse1[i],4))
a<-table.element(a,round(perf.rmse[i],4))
a<-table.row.end(a)
}
a<-table.end(a)
table.save(a,file='mytable1.tab')