Free Statistics
of Irreproducible Research!
Description of Statistical Computation | |||||||||||||||||||||||||||||||||||||||||||||
|---|---|---|---|---|---|---|---|---|---|---|---|---|---|---|---|---|---|---|---|---|---|---|---|---|---|---|---|---|---|---|---|---|---|---|---|---|---|---|---|---|---|---|---|---|---|
| Author's title | |||||||||||||||||||||||||||||||||||||||||||||
| Author | *The author of this computation has been verified* | ||||||||||||||||||||||||||||||||||||||||||||
| R Software Module | rwasp_regression_trees1.wasp | ||||||||||||||||||||||||||||||||||||||||||||
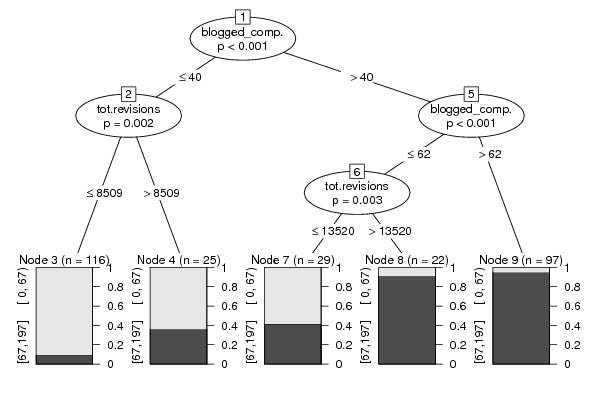
| Title produced by software | Recursive Partitioning (Regression Trees) | ||||||||||||||||||||||||||||||||||||||||||||
| Date of computation | Fri, 23 Dec 2011 14:10:12 -0500 | ||||||||||||||||||||||||||||||||||||||||||||
| Cite this page as follows | Statistical Computations at FreeStatistics.org, Office for Research Development and Education, URL https://freestatistics.org/blog/index.php?v=date/2011/Dec/23/t1324667532jtdfp2y7rqbpvc7.htm/, Retrieved Mon, 29 Apr 2024 19:10:13 +0000 | ||||||||||||||||||||||||||||||||||||||||||||
| Statistical Computations at FreeStatistics.org, Office for Research Development and Education, URL https://freestatistics.org/blog/index.php?pk=160665, Retrieved Mon, 29 Apr 2024 19:10:13 +0000 | |||||||||||||||||||||||||||||||||||||||||||||
| QR Codes: | |||||||||||||||||||||||||||||||||||||||||||||
|
| |||||||||||||||||||||||||||||||||||||||||||||
| Original text written by user: | |||||||||||||||||||||||||||||||||||||||||||||
| IsPrivate? | No (this computation is public) | ||||||||||||||||||||||||||||||||||||||||||||
| User-defined keywords | |||||||||||||||||||||||||||||||||||||||||||||
| Estimated Impact | 67 | ||||||||||||||||||||||||||||||||||||||||||||
Tree of Dependent Computations | |||||||||||||||||||||||||||||||||||||||||||||
| Family? (F = Feedback message, R = changed R code, M = changed R Module, P = changed Parameters, D = changed Data) | |||||||||||||||||||||||||||||||||||||||||||||
| - [Multiple Regression] [] [2010-12-05 18:56:24] [b98453cac15ba1066b407e146608df68] - PD [Multiple Regression] [WS 10 endogene va...] [2011-12-13 18:47:14] [620e5553455d245695b6e856984b13e0] - RMPD [Recursive Partitioning (Regression Trees)] [4.2.3 Reg.tree] [2011-12-23 19:10:12] [5e0d67387daac495c180286b1f543191] [Current] - [Recursive Partitioning (Regression Trees)] [4.2.3.1] [2011-12-23 20:52:23] [e51846b5e808727784baa8d5c183dcd5] - [Recursive Partitioning (Regression Trees)] [4.2.3.2 no catego...] [2011-12-23 21:00:53] [e51846b5e808727784baa8d5c183dcd5] | |||||||||||||||||||||||||||||||||||||||||||||
| Feedback Forum | |||||||||||||||||||||||||||||||||||||||||||||
Post a new message | |||||||||||||||||||||||||||||||||||||||||||||
Dataset | |||||||||||||||||||||||||||||||||||||||||||||
| Dataseries X: | |||||||||||||||||||||||||||||||||||||||||||||
210907 79 94 24188 120982 58 103 18273 176508 60 93 14130 179321 108 103 32287 123185 49 51 8654 52746 0 70 9245 385534 121 91 33251 33170 1 22 1271 101645 20 38 5279 149061 43 93 27101 165446 69 60 16373 237213 78 123 19716 173326 86 148 17753 133131 44 90 9028 258873 104 124 18653 180083 63 70 8828 324799 158 168 29498 230964 102 115 27563 236785 77 71 18293 135473 82 66 22530 202925 115 134 15977 215147 101 117 35082 344297 80 108 16116 153935 50 84 15849 132943 83 156 16026 174724 123 120 26569 174415 73 114 24785 225548 81 94 17569 223632 105 120 23825 124817 47 81 7869 221698 105 110 14975 210767 94 133 37791 170266 44 122 9605 260561 114 158 27295 84853 38 109 2746 294424 107 124 34461 101011 30 39 8098 215641 71 92 4787 325107 84 126 24919 7176 0 0 603 167542 59 70 16329 106408 33 37 12558 96560 42 38 7784 265769 96 120 28522 269651 106 93 22265 149112 56 95 14459 175824 57 77 14526 152871 59 90 22240 111665 39 80 11802 116408 34 31 7623 362301 76 110 11912 78800 20 66 7935 183167 91 138 18220 277965 115 133 19199 150629 85 113 19918 168809 76 100 21884 24188 8 7 2694 329267 79 140 15808 65029 21 61 3597 101097 30 41 5296 218946 76 96 25239 244052 101 164 29801 341570 94 78 18450 103597 27 49 7132 233328 92 102 34861 256462 123 124 35940 206161 75 99 16688 311473 128 129 24683 235800 105 62 46230 177939 55 73 10387 207176 56 114 21436 196553 41 99 30546 174184 72 70 19746 143246 67 104 15977 187559 75 116 22583 187681 114 91 17274 119016 118 74 16469 182192 77 138 14251 73566 22 67 3007 194979 66 151 16851 167488 69 72 21113 143756 105 120 17401 275541 116 115 23958 243199 88 105 23567 182999 73 104 13065 135649 99 108 15358 152299 62 98 14587 120221 53 69 12770 346485 118 111 24021 145790 30 99 9648 193339 100 71 20537 80953 49 27 7905 122774 24 69 4527 130585 67 107 30495 112611 46 73 7117 286468 57 107 17719 241066 75 93 27056 148446 135 129 33473 204713 68 69 9758 182079 124 118 21115 140344 33 73 7236 220516 98 119 13790 243060 58 104 32902 162765 68 107 25131 182613 81 99 30910 232138 131 90 35947 265318 110 197 29848 85574 37 36 6943 310839 130 85 42705 225060 93 139 31808 232317 118 106 26675 144966 39 50 8435 43287 13 64 7409 155754 74 31 14993 164709 81 63 36867 201940 109 92 33835 235454 151 106 24164 220801 51 63 12607 99466 28 69 22609 92661 40 41 5892 133328 56 56 17014 61361 27 25 5394 125930 37 65 9178 100750 83 93 6440 224549 54 114 21916 82316 27 38 4011 102010 28 44 5818 101523 59 87 18647 243511 133 110 20556 22938 12 0 238 41566 0 27 70 152474 106 83 22392 61857 23 30 3913 99923 44 80 12237 132487 71 98 8388 317394 116 82 22120 21054 4 0 338 209641 62 60 11727 22648 12 28 3704 31414 18 9 3988 46698 14 33 3030 131698 60 59 13520 91735 7 49 1421 244749 98 115 20923 184510 64 140 20237 79863 29 49 3219 128423 32 120 3769 97839 25 66 12252 38214 16 21 1888 151101 48 124 14497 272458 100 152 28864 172494 46 139 21721 108043 45 38 4821 328107 129 144 33644 250579 130 120 15923 351067 136 160 42935 158015 59 114 18864 98866 25 39 4977 85439 32 78 7785 229242 63 119 17939 351619 95 141 23436 84207 14 101 325 120445 36 56 13539 324598 113 133 34538 131069 47 83 12198 204271 92 116 26924 165543 70 90 12716 141722 19 36 8172 116048 50 50 10855 250047 41 61 11932 299775 91 97 14300 195838 111 98 25515 173260 41 78 2805 254488 120 117 29402 104389 135 148 16440 136084 27 41 11221 199476 87 105 28732 92499 25 55 5250 224330 131 132 28608 135781 45 44 8092 74408 29 21 4473 81240 58 50 1572 14688 4 0 2065 181633 47 73 14817 271856 109 86 16714 7199 7 0 556 46660 12 13 2089 17547 0 4 2658 133368 37 57 10695 95227 37 48 1669 152601 46 46 16267 98146 15 48 7768 79619 42 32 7252 59194 7 68 6387 139942 54 87 18715 118612 54 43 7936 72880 14 67 8643 65475 16 46 7294 99643 33 46 4570 71965 32 56 7185 77272 21 48 10058 49289 15 44 2342 135131 38 60 8509 108446 22 65 13275 89746 28 55 6816 44296 10 38 1930 77648 31 52 8086 181528 32 60 10737 134019 32 54 8033 124064 43 86 7058 92630 27 24 6782 121848 37 52 5401 52915 20 49 6521 81872 32 61 10856 58981 0 61 2154 53515 5 81 6117 60812 26 43 5238 56375 10 40 4820 65490 27 40 5615 80949 11 56 4272 76302 29 68 8702 104011 25 79 15340 98104 55 47 8030 67989 23 57 9526 30989 5 41 1278 135458 43 29 4236 73504 23 3 3023 63123 34 60 7196 61254 36 30 3394 74914 35 79 6371 31774 0 47 1574 81437 37 40 9620 87186 28 48 6978 50090 16 36 4911 65745 26 42 8645 56653 38 49 8987 158399 23 57 5544 46455 22 12 3083 73624 30 40 6909 38395 16 43 3189 91899 18 33 6745 139526 28 77 16724 52164 32 43 4850 51567 21 45 7025 70551 23 47 6047 84856 29 43 7377 102538 50 45 9078 86678 12 50 4605 85709 21 35 3238 34662 18 7 8100 150580 27 71 9653 99611 41 67 8914 19349 13 0 786 99373 12 62 6700 86230 21 54 5788 30837 8 4 593 31706 26 25 4506 89806 27 40 6382 62088 13 38 5621 40151 16 19 3997 27634 2 17 520 76990 42 67 8891 37460 5 14 999 54157 37 30 7067 49862 17 54 4639 84337 38 35 5654 64175 37 59 6928 59382 29 24 1514 119308 32 58 9238 76702 35 42 8204 103425 17 46 5926 70344 20 61 5785 43410 7 3 4 104838 46 52 5930 62215 24 25 3710 69304 40 40 705 53117 3 32 443 19764 10 4 2416 86680 37 49 7747 84105 17 63 5432 77945 28 67 4913 89113 19 32 2650 91005 29 23 2370 40248 8 7 775 64187 10 54 5576 50857 15 37 1352 56613 15 35 3080 62792 28 51 10205 72535 17 39 6095 | |||||||||||||||||||||||||||||||||||||||||||||
Tables (Output of Computation) | |||||||||||||||||||||||||||||||||||||||||||||
| |||||||||||||||||||||||||||||||||||||||||||||
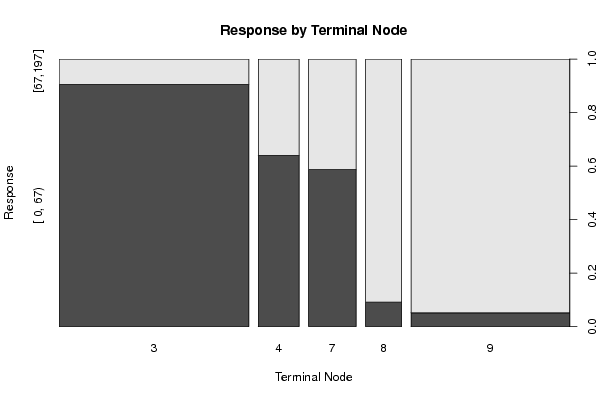
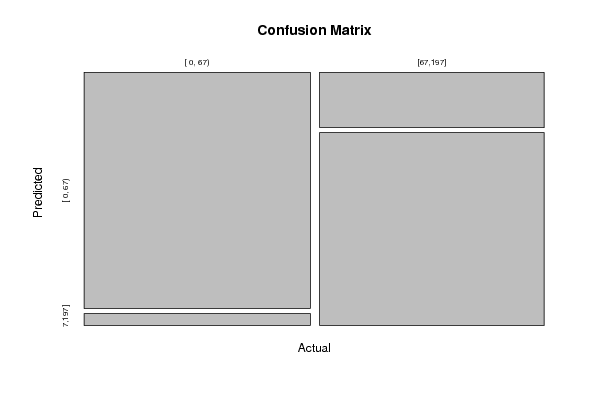
Figures (Output of Computation) | |||||||||||||||||||||||||||||||||||||||||||||
Input Parameters & R Code | |||||||||||||||||||||||||||||||||||||||||||||
| Parameters (Session): | |||||||||||||||||||||||||||||||||||||||||||||
| Parameters (R input): | |||||||||||||||||||||||||||||||||||||||||||||
| par1 = 3 ; par2 = quantiles ; par3 = 2 ; par4 = no ; | |||||||||||||||||||||||||||||||||||||||||||||
| R code (references can be found in the software module): | |||||||||||||||||||||||||||||||||||||||||||||
library(party) | |||||||||||||||||||||||||||||||||||||||||||||