Free Statistics

of Irreproducible Research!

Author's title

Author*The author of this computation has been verified*
R Software Modulerwasp_arimabackwardselection.wasp
Title produced by softwareARIMA Backward Selection
Date of computationFri, 23 Dec 2011 14:11:23 -0500
Cite this page as followsStatistical Computations at FreeStatistics.org, Office for Research Development and Education, URL https://freestatistics.org/blog/index.php?v=date/2011/Dec/23/t1324667517xzf3e6lokxsc5im.htm/, Retrieved Mon, 29 Apr 2024 18:20:22 +0000
Statistical Computations at FreeStatistics.org, Office for Research Development and Education, URL https://freestatistics.org/blog/index.php?pk=160663, Retrieved Mon, 29 Apr 2024 18:20:22 +0000
QR Codes:

Original text written by user:
IsPrivate?No (this computation is public)
User-defined keywords
Estimated Impact69
Family? (F = Feedback message, R = changed R code, M = changed R Module, P = changed Parameters, D = changed Data)
-     [Spectral Analysis] [] [2011-12-23 18:50:40] [2ba7ee2cbaa966a49160c7cfb7436069]
- RMP     [ARIMA Backward Selection] [] [2011-12-23 19:11:23] [393d554610c677f923bed472882d0fdb] [Current]
Feedback Forum

Post a new message
Dataseries X:
302
262
218
175
100
77
43
47
49
69
152
205
246
294
242
181
107
56
49
47
47
71
151
244
280
230
185
148
98
61
46
45
55
48
115
185
276
220
181
151
83
55
49
42
46
74
103
200
237
247
215
182
80
46
65
40
44
63
85
185
247
231
167
117
79
45
40
38
41
69
152
232
282
255
161
107
53
40
39
34
35
56
97
210
260
257
210
125
80
42
35
31
32
50
92
189
256
250
198
136
73
39
32
30
31
45


Summary of computational transaction
Raw Inputview raw input (R code)
Raw Outputview raw output of R engine
Computing time10 seconds
R Server'AstonUniversity' @ aston.wessa.net

\begin{tabular}{lllllllll}
\hline
Summary of computational transaction \tabularnewline
Raw Input & view raw input (R code)  \tabularnewline
Raw Output & view raw output of R engine  \tabularnewline
Computing time & 10 seconds \tabularnewline
R Server & 'AstonUniversity' @ aston.wessa.net \tabularnewline
\hline
\end{tabular}
%Source: https://freestatistics.org/blog/index.php?pk=160663&T=0

[TABLE]
[ROW][C]Summary of computational transaction[/C][/ROW]
[ROW][C]Raw Input[/C][C]view raw input (R code) [/C][/ROW]
[ROW][C]Raw Output[/C][C]view raw output of R engine [/C][/ROW]
[ROW][C]Computing time[/C][C]10 seconds[/C][/ROW]
[ROW][C]R Server[/C][C]'AstonUniversity' @ aston.wessa.net[/C][/ROW]
[/TABLE]
Source: https://freestatistics.org/blog/index.php?pk=160663&T=0

Globally Unique Identifier (entire table): ba.freestatistics.org/blog/index.php?pk=160663&T=0

As an alternative you can also use a QR Code:  

The GUIDs for individual cells are displayed in the table below:

Summary of computational transaction
Raw Inputview raw input (R code)
Raw Outputview raw output of R engine
Computing time10 seconds
R Server'AstonUniversity' @ aston.wessa.net


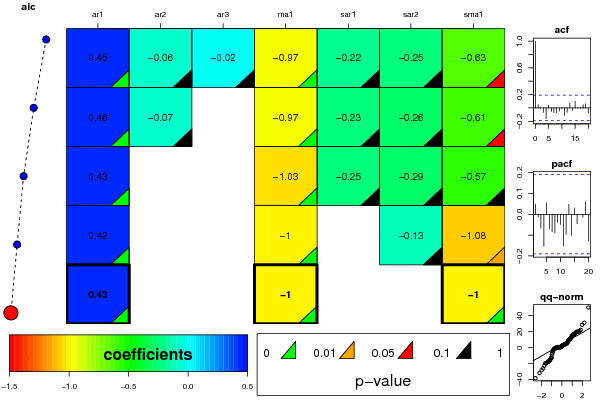
ARIMA Parameter Estimation and Backward Selection
Iterationar1ar2ar3ma1sar1sar2sma1
Estimates ( 1 )0.4538-0.0627-0.019-0.9651-0.2151-0.2499-0.6276
(p-val)(1e-04 )(0.5841 )(0.8664 )(0 )(0.4436 )(0.2445 )(0.0898 )
Estimates ( 2 )0.4564-0.06910-0.9668-0.2314-0.263-0.6069
(p-val)(1e-04 )(0.5276 )(NA )(0 )(0.399 )(0.2101 )(0.0917 )
Estimates ( 3 )0.432300-1.0271-0.2545-0.2898-0.5712
(p-val)(0 )(NA )(NA )(0 )(0.3445 )(0.1501 )(0.1006 )
Estimates ( 4 )0.422100-10-0.128-1.0758
(p-val)(0 )(NA )(NA )(0 )(NA )(0.3199 )(0.0464 )
Estimates ( 5 )0.432200-0.999900-0.9998
(p-val)(0 )(NA )(NA )(0 )(NA )(NA )(0.0044 )
Estimates ( 6 )NANANANANANANA
(p-val)(NA )(NA )(NA )(NA )(NA )(NA )(NA )
Estimates ( 7 )NANANANANANANA
(p-val)(NA )(NA )(NA )(NA )(NA )(NA )(NA )
Estimates ( 8 )NANANANANANANA
(p-val)(NA )(NA )(NA )(NA )(NA )(NA )(NA )
Estimates ( 9 )NANANANANANANA
(p-val)(NA )(NA )(NA )(NA )(NA )(NA )(NA )
Estimates ( 10 )NANANANANANANA
(p-val)(NA )(NA )(NA )(NA )(NA )(NA )(NA )
Estimates ( 11 )NANANANANANANA
(p-val)(NA )(NA )(NA )(NA )(NA )(NA )(NA )
Estimates ( 12 )NANANANANANANA
(p-val)(NA )(NA )(NA )(NA )(NA )(NA )(NA )
Estimates ( 13 )NANANANANANANA
(p-val)(NA )(NA )(NA )(NA )(NA )(NA )(NA )

\begin{tabular}{lllllllll}
\hline
ARIMA Parameter Estimation and Backward Selection \tabularnewline
Iteration & ar1 & ar2 & ar3 & ma1 & sar1 & sar2 & sma1 \tabularnewline
Estimates ( 1 ) & 0.4538 & -0.0627 & -0.019 & -0.9651 & -0.2151 & -0.2499 & -0.6276 \tabularnewline
(p-val) & (1e-04 ) & (0.5841 ) & (0.8664 ) & (0 ) & (0.4436 ) & (0.2445 ) & (0.0898 ) \tabularnewline
Estimates ( 2 ) & 0.4564 & -0.0691 & 0 & -0.9668 & -0.2314 & -0.263 & -0.6069 \tabularnewline
(p-val) & (1e-04 ) & (0.5276 ) & (NA ) & (0 ) & (0.399 ) & (0.2101 ) & (0.0917 ) \tabularnewline
Estimates ( 3 ) & 0.4323 & 0 & 0 & -1.0271 & -0.2545 & -0.2898 & -0.5712 \tabularnewline
(p-val) & (0 ) & (NA ) & (NA ) & (0 ) & (0.3445 ) & (0.1501 ) & (0.1006 ) \tabularnewline
Estimates ( 4 ) & 0.4221 & 0 & 0 & -1 & 0 & -0.128 & -1.0758 \tabularnewline
(p-val) & (0 ) & (NA ) & (NA ) & (0 ) & (NA ) & (0.3199 ) & (0.0464 ) \tabularnewline
Estimates ( 5 ) & 0.4322 & 0 & 0 & -0.9999 & 0 & 0 & -0.9998 \tabularnewline
(p-val) & (0 ) & (NA ) & (NA ) & (0 ) & (NA ) & (NA ) & (0.0044 ) \tabularnewline
Estimates ( 6 ) & NA & NA & NA & NA & NA & NA & NA \tabularnewline
(p-val) & (NA ) & (NA ) & (NA ) & (NA ) & (NA ) & (NA ) & (NA ) \tabularnewline
Estimates ( 7 ) & NA & NA & NA & NA & NA & NA & NA \tabularnewline
(p-val) & (NA ) & (NA ) & (NA ) & (NA ) & (NA ) & (NA ) & (NA ) \tabularnewline
Estimates ( 8 ) & NA & NA & NA & NA & NA & NA & NA \tabularnewline
(p-val) & (NA ) & (NA ) & (NA ) & (NA ) & (NA ) & (NA ) & (NA ) \tabularnewline
Estimates ( 9 ) & NA & NA & NA & NA & NA & NA & NA \tabularnewline
(p-val) & (NA ) & (NA ) & (NA ) & (NA ) & (NA ) & (NA ) & (NA ) \tabularnewline
Estimates ( 10 ) & NA & NA & NA & NA & NA & NA & NA \tabularnewline
(p-val) & (NA ) & (NA ) & (NA ) & (NA ) & (NA ) & (NA ) & (NA ) \tabularnewline
Estimates ( 11 ) & NA & NA & NA & NA & NA & NA & NA \tabularnewline
(p-val) & (NA ) & (NA ) & (NA ) & (NA ) & (NA ) & (NA ) & (NA ) \tabularnewline
Estimates ( 12 ) & NA & NA & NA & NA & NA & NA & NA \tabularnewline
(p-val) & (NA ) & (NA ) & (NA ) & (NA ) & (NA ) & (NA ) & (NA ) \tabularnewline
Estimates ( 13 ) & NA & NA & NA & NA & NA & NA & NA \tabularnewline
(p-val) & (NA ) & (NA ) & (NA ) & (NA ) & (NA ) & (NA ) & (NA ) \tabularnewline
\hline
\end{tabular}
%Source: https://freestatistics.org/blog/index.php?pk=160663&T=1

[TABLE]
[ROW][C]ARIMA Parameter Estimation and Backward Selection[/C][/ROW]
[ROW][C]Iteration[/C][C]ar1[/C][C]ar2[/C][C]ar3[/C][C]ma1[/C][C]sar1[/C][C]sar2[/C][C]sma1[/C][/ROW]
[ROW][C]Estimates ( 1 )[/C][C]0.4538[/C][C]-0.0627[/C][C]-0.019[/C][C]-0.9651[/C][C]-0.2151[/C][C]-0.2499[/C][C]-0.6276[/C][/ROW]
[ROW][C](p-val)[/C][C](1e-04 )[/C][C](0.5841 )[/C][C](0.8664 )[/C][C](0 )[/C][C](0.4436 )[/C][C](0.2445 )[/C][C](0.0898 )[/C][/ROW]
[ROW][C]Estimates ( 2 )[/C][C]0.4564[/C][C]-0.0691[/C][C]0[/C][C]-0.9668[/C][C]-0.2314[/C][C]-0.263[/C][C]-0.6069[/C][/ROW]
[ROW][C](p-val)[/C][C](1e-04 )[/C][C](0.5276 )[/C][C](NA )[/C][C](0 )[/C][C](0.399 )[/C][C](0.2101 )[/C][C](0.0917 )[/C][/ROW]
[ROW][C]Estimates ( 3 )[/C][C]0.4323[/C][C]0[/C][C]0[/C][C]-1.0271[/C][C]-0.2545[/C][C]-0.2898[/C][C]-0.5712[/C][/ROW]
[ROW][C](p-val)[/C][C](0 )[/C][C](NA )[/C][C](NA )[/C][C](0 )[/C][C](0.3445 )[/C][C](0.1501 )[/C][C](0.1006 )[/C][/ROW]
[ROW][C]Estimates ( 4 )[/C][C]0.4221[/C][C]0[/C][C]0[/C][C]-1[/C][C]0[/C][C]-0.128[/C][C]-1.0758[/C][/ROW]
[ROW][C](p-val)[/C][C](0 )[/C][C](NA )[/C][C](NA )[/C][C](0 )[/C][C](NA )[/C][C](0.3199 )[/C][C](0.0464 )[/C][/ROW]
[ROW][C]Estimates ( 5 )[/C][C]0.4322[/C][C]0[/C][C]0[/C][C]-0.9999[/C][C]0[/C][C]0[/C][C]-0.9998[/C][/ROW]
[ROW][C](p-val)[/C][C](0 )[/C][C](NA )[/C][C](NA )[/C][C](0 )[/C][C](NA )[/C][C](NA )[/C][C](0.0044 )[/C][/ROW]
[ROW][C]Estimates ( 6 )[/C][C]NA[/C][C]NA[/C][C]NA[/C][C]NA[/C][C]NA[/C][C]NA[/C][C]NA[/C][/ROW]
[ROW][C](p-val)[/C][C](NA )[/C][C](NA )[/C][C](NA )[/C][C](NA )[/C][C](NA )[/C][C](NA )[/C][C](NA )[/C][/ROW]
[ROW][C]Estimates ( 7 )[/C][C]NA[/C][C]NA[/C][C]NA[/C][C]NA[/C][C]NA[/C][C]NA[/C][C]NA[/C][/ROW]
[ROW][C](p-val)[/C][C](NA )[/C][C](NA )[/C][C](NA )[/C][C](NA )[/C][C](NA )[/C][C](NA )[/C][C](NA )[/C][/ROW]
[ROW][C]Estimates ( 8 )[/C][C]NA[/C][C]NA[/C][C]NA[/C][C]NA[/C][C]NA[/C][C]NA[/C][C]NA[/C][/ROW]
[ROW][C](p-val)[/C][C](NA )[/C][C](NA )[/C][C](NA )[/C][C](NA )[/C][C](NA )[/C][C](NA )[/C][C](NA )[/C][/ROW]
[ROW][C]Estimates ( 9 )[/C][C]NA[/C][C]NA[/C][C]NA[/C][C]NA[/C][C]NA[/C][C]NA[/C][C]NA[/C][/ROW]
[ROW][C](p-val)[/C][C](NA )[/C][C](NA )[/C][C](NA )[/C][C](NA )[/C][C](NA )[/C][C](NA )[/C][C](NA )[/C][/ROW]
[ROW][C]Estimates ( 10 )[/C][C]NA[/C][C]NA[/C][C]NA[/C][C]NA[/C][C]NA[/C][C]NA[/C][C]NA[/C][/ROW]
[ROW][C](p-val)[/C][C](NA )[/C][C](NA )[/C][C](NA )[/C][C](NA )[/C][C](NA )[/C][C](NA )[/C][C](NA )[/C][/ROW]
[ROW][C]Estimates ( 11 )[/C][C]NA[/C][C]NA[/C][C]NA[/C][C]NA[/C][C]NA[/C][C]NA[/C][C]NA[/C][/ROW]
[ROW][C](p-val)[/C][C](NA )[/C][C](NA )[/C][C](NA )[/C][C](NA )[/C][C](NA )[/C][C](NA )[/C][C](NA )[/C][/ROW]
[ROW][C]Estimates ( 12 )[/C][C]NA[/C][C]NA[/C][C]NA[/C][C]NA[/C][C]NA[/C][C]NA[/C][C]NA[/C][/ROW]
[ROW][C](p-val)[/C][C](NA )[/C][C](NA )[/C][C](NA )[/C][C](NA )[/C][C](NA )[/C][C](NA )[/C][C](NA )[/C][/ROW]
[ROW][C]Estimates ( 13 )[/C][C]NA[/C][C]NA[/C][C]NA[/C][C]NA[/C][C]NA[/C][C]NA[/C][C]NA[/C][/ROW]
[ROW][C](p-val)[/C][C](NA )[/C][C](NA )[/C][C](NA )[/C][C](NA )[/C][C](NA )[/C][C](NA )[/C][C](NA )[/C][/ROW]
[/TABLE]
Source: https://freestatistics.org/blog/index.php?pk=160663&T=1

Globally Unique Identifier (entire table): ba.freestatistics.org/blog/index.php?pk=160663&T=1

As an alternative you can also use a QR Code:  

The GUIDs for individual cells are displayed in the table below:

ARIMA Parameter Estimation and Backward Selection
Iterationar1ar2ar3ma1sar1sar2sma1
Estimates ( 1 )0.4538-0.0627-0.019-0.9651-0.2151-0.2499-0.6276
(p-val)(1e-04 )(0.5841 )(0.8664 )(0 )(0.4436 )(0.2445 )(0.0898 )
Estimates ( 2 )0.4564-0.06910-0.9668-0.2314-0.263-0.6069
(p-val)(1e-04 )(0.5276 )(NA )(0 )(0.399 )(0.2101 )(0.0917 )
Estimates ( 3 )0.432300-1.0271-0.2545-0.2898-0.5712
(p-val)(0 )(NA )(NA )(0 )(0.3445 )(0.1501 )(0.1006 )
Estimates ( 4 )0.422100-10-0.128-1.0758
(p-val)(0 )(NA )(NA )(0 )(NA )(0.3199 )(0.0464 )
Estimates ( 5 )0.432200-0.999900-0.9998
(p-val)(0 )(NA )(NA )(0 )(NA )(NA )(0.0044 )
Estimates ( 6 )NANANANANANANA
(p-val)(NA )(NA )(NA )(NA )(NA )(NA )(NA )
Estimates ( 7 )NANANANANANANA
(p-val)(NA )(NA )(NA )(NA )(NA )(NA )(NA )
Estimates ( 8 )NANANANANANANA
(p-val)(NA )(NA )(NA )(NA )(NA )(NA )(NA )
Estimates ( 9 )NANANANANANANA
(p-val)(NA )(NA )(NA )(NA )(NA )(NA )(NA )
Estimates ( 10 )NANANANANANANA
(p-val)(NA )(NA )(NA )(NA )(NA )(NA )(NA )
Estimates ( 11 )NANANANANANANA
(p-val)(NA )(NA )(NA )(NA )(NA )(NA )(NA )
Estimates ( 12 )NANANANANANANA
(p-val)(NA )(NA )(NA )(NA )(NA )(NA )(NA )
Estimates ( 13 )NANANANANANANA
(p-val)(NA )(NA )(NA )(NA )(NA )(NA )(NA )


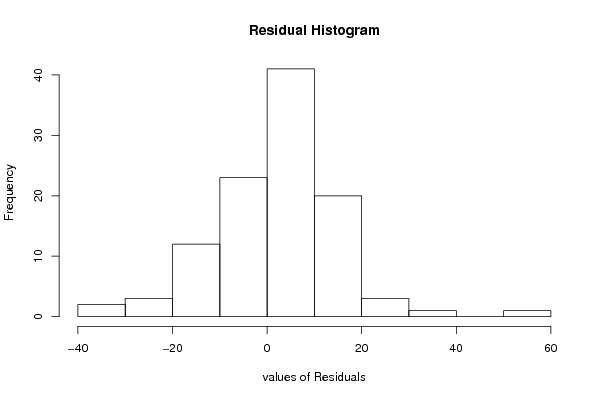
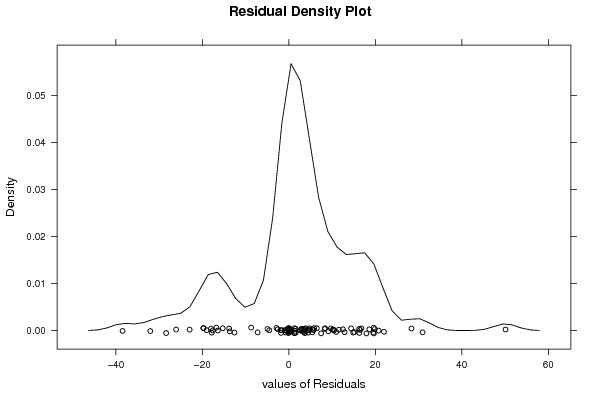
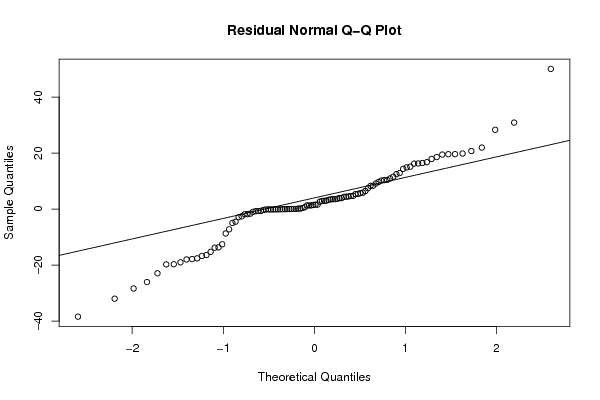
Estimated ARIMA Residuals
Value
-0.75123166071088
50.1015226389001
10.3628571962208
-0.677651356808817
4.76671552339168
-13.7949723076812
12.5204796018441
-0.0839439368435434
0.0501280420730206
2.64646182244958
-1.84403420925041
21.9924795824558
-0.997314655389231
-38.4411743329353
-13.6630659130386
-1.79202221093846
10.9717365119362
3.92308969152965
5.73054191936399
2.94893034337832
9.71209670082815
-15.2650224016771
-16.4166739592005
-16.7440263732583
20.7656802036703
-19.0159815882499
-1.63636878241727
7.47515863754928
-0.310696926739526
5.86157045256572
14.8998473697534
2.92856166129385
4.69074497678034
18.6014798066895
-26.0623150692097
12.8951166207894
-17.8538359029495
17.9365153627785
16.4896373143675
19.5049061408888
-12.5662650345608
0.039227256889992
28.3575993091246
-4.5100623999998
4.42769223964562
3.54590755500664
-32.0244185306466
0.184479640877653
3.54955757081099
-2.86119279614453
-19.7637162499926
-17.9982718284119
16.3154847653443
3.91618707804735
6.47491354842596
8.28713567227212
5.40287926664824
16.7812650716273
30.9260345448556
19.8694816559251
11.5642941813113
10.4286071716539
-28.3730519603189
-19.7172350220825
-7.21635926769749
8.36954726767021
9.15756550466323
3.32134689117897
1.30625480837877
4.51970159592519
-17.5976798315635
19.6196224486157
3.46910601797999
19.6582801623059
16.2598094039273
-22.9361353589975
15.166492071433
-0.644526671162106
1.61078543170196
3.71094534132448
0.406310118957143
1.57789424637371
-8.70872764310405
3.02647303846466
10.1792153329818
14.3909212091012
5.44016318703476
-4.93687772718709
1.3322254980925
1.47836066672018
1.32038845266995
4.38656839391118
0.673268564079346
-2.57215387003796

\begin{tabular}{lllllllll}
\hline
Estimated ARIMA Residuals \tabularnewline
Value \tabularnewline
-0.75123166071088 \tabularnewline
50.1015226389001 \tabularnewline
10.3628571962208 \tabularnewline
-0.677651356808817 \tabularnewline
4.76671552339168 \tabularnewline
-13.7949723076812 \tabularnewline
12.5204796018441 \tabularnewline
-0.0839439368435434 \tabularnewline
0.0501280420730206 \tabularnewline
2.64646182244958 \tabularnewline
-1.84403420925041 \tabularnewline
21.9924795824558 \tabularnewline
-0.997314655389231 \tabularnewline
-38.4411743329353 \tabularnewline
-13.6630659130386 \tabularnewline
-1.79202221093846 \tabularnewline
10.9717365119362 \tabularnewline
3.92308969152965 \tabularnewline
5.73054191936399 \tabularnewline
2.94893034337832 \tabularnewline
9.71209670082815 \tabularnewline
-15.2650224016771 \tabularnewline
-16.4166739592005 \tabularnewline
-16.7440263732583 \tabularnewline
20.7656802036703 \tabularnewline
-19.0159815882499 \tabularnewline
-1.63636878241727 \tabularnewline
7.47515863754928 \tabularnewline
-0.310696926739526 \tabularnewline
5.86157045256572 \tabularnewline
14.8998473697534 \tabularnewline
2.92856166129385 \tabularnewline
4.69074497678034 \tabularnewline
18.6014798066895 \tabularnewline
-26.0623150692097 \tabularnewline
12.8951166207894 \tabularnewline
-17.8538359029495 \tabularnewline
17.9365153627785 \tabularnewline
16.4896373143675 \tabularnewline
19.5049061408888 \tabularnewline
-12.5662650345608 \tabularnewline
0.039227256889992 \tabularnewline
28.3575993091246 \tabularnewline
-4.5100623999998 \tabularnewline
4.42769223964562 \tabularnewline
3.54590755500664 \tabularnewline
-32.0244185306466 \tabularnewline
0.184479640877653 \tabularnewline
3.54955757081099 \tabularnewline
-2.86119279614453 \tabularnewline
-19.7637162499926 \tabularnewline
-17.9982718284119 \tabularnewline
16.3154847653443 \tabularnewline
3.91618707804735 \tabularnewline
6.47491354842596 \tabularnewline
8.28713567227212 \tabularnewline
5.40287926664824 \tabularnewline
16.7812650716273 \tabularnewline
30.9260345448556 \tabularnewline
19.8694816559251 \tabularnewline
11.5642941813113 \tabularnewline
10.4286071716539 \tabularnewline
-28.3730519603189 \tabularnewline
-19.7172350220825 \tabularnewline
-7.21635926769749 \tabularnewline
8.36954726767021 \tabularnewline
9.15756550466323 \tabularnewline
3.32134689117897 \tabularnewline
1.30625480837877 \tabularnewline
4.51970159592519 \tabularnewline
-17.5976798315635 \tabularnewline
19.6196224486157 \tabularnewline
3.46910601797999 \tabularnewline
19.6582801623059 \tabularnewline
16.2598094039273 \tabularnewline
-22.9361353589975 \tabularnewline
15.166492071433 \tabularnewline
-0.644526671162106 \tabularnewline
1.61078543170196 \tabularnewline
3.71094534132448 \tabularnewline
0.406310118957143 \tabularnewline
1.57789424637371 \tabularnewline
-8.70872764310405 \tabularnewline
3.02647303846466 \tabularnewline
10.1792153329818 \tabularnewline
14.3909212091012 \tabularnewline
5.44016318703476 \tabularnewline
-4.93687772718709 \tabularnewline
1.3322254980925 \tabularnewline
1.47836066672018 \tabularnewline
1.32038845266995 \tabularnewline
4.38656839391118 \tabularnewline
0.673268564079346 \tabularnewline
-2.57215387003796 \tabularnewline
\hline
\end{tabular}
%Source: https://freestatistics.org/blog/index.php?pk=160663&T=2

[TABLE]
[ROW][C]Estimated ARIMA Residuals[/C][/ROW]
[ROW][C]Value[/C][/ROW]
[ROW][C]-0.75123166071088[/C][/ROW]
[ROW][C]50.1015226389001[/C][/ROW]
[ROW][C]10.3628571962208[/C][/ROW]
[ROW][C]-0.677651356808817[/C][/ROW]
[ROW][C]4.76671552339168[/C][/ROW]
[ROW][C]-13.7949723076812[/C][/ROW]
[ROW][C]12.5204796018441[/C][/ROW]
[ROW][C]-0.0839439368435434[/C][/ROW]
[ROW][C]0.0501280420730206[/C][/ROW]
[ROW][C]2.64646182244958[/C][/ROW]
[ROW][C]-1.84403420925041[/C][/ROW]
[ROW][C]21.9924795824558[/C][/ROW]
[ROW][C]-0.997314655389231[/C][/ROW]
[ROW][C]-38.4411743329353[/C][/ROW]
[ROW][C]-13.6630659130386[/C][/ROW]
[ROW][C]-1.79202221093846[/C][/ROW]
[ROW][C]10.9717365119362[/C][/ROW]
[ROW][C]3.92308969152965[/C][/ROW]
[ROW][C]5.73054191936399[/C][/ROW]
[ROW][C]2.94893034337832[/C][/ROW]
[ROW][C]9.71209670082815[/C][/ROW]
[ROW][C]-15.2650224016771[/C][/ROW]
[ROW][C]-16.4166739592005[/C][/ROW]
[ROW][C]-16.7440263732583[/C][/ROW]
[ROW][C]20.7656802036703[/C][/ROW]
[ROW][C]-19.0159815882499[/C][/ROW]
[ROW][C]-1.63636878241727[/C][/ROW]
[ROW][C]7.47515863754928[/C][/ROW]
[ROW][C]-0.310696926739526[/C][/ROW]
[ROW][C]5.86157045256572[/C][/ROW]
[ROW][C]14.8998473697534[/C][/ROW]
[ROW][C]2.92856166129385[/C][/ROW]
[ROW][C]4.69074497678034[/C][/ROW]
[ROW][C]18.6014798066895[/C][/ROW]
[ROW][C]-26.0623150692097[/C][/ROW]
[ROW][C]12.8951166207894[/C][/ROW]
[ROW][C]-17.8538359029495[/C][/ROW]
[ROW][C]17.9365153627785[/C][/ROW]
[ROW][C]16.4896373143675[/C][/ROW]
[ROW][C]19.5049061408888[/C][/ROW]
[ROW][C]-12.5662650345608[/C][/ROW]
[ROW][C]0.039227256889992[/C][/ROW]
[ROW][C]28.3575993091246[/C][/ROW]
[ROW][C]-4.5100623999998[/C][/ROW]
[ROW][C]4.42769223964562[/C][/ROW]
[ROW][C]3.54590755500664[/C][/ROW]
[ROW][C]-32.0244185306466[/C][/ROW]
[ROW][C]0.184479640877653[/C][/ROW]
[ROW][C]3.54955757081099[/C][/ROW]
[ROW][C]-2.86119279614453[/C][/ROW]
[ROW][C]-19.7637162499926[/C][/ROW]
[ROW][C]-17.9982718284119[/C][/ROW]
[ROW][C]16.3154847653443[/C][/ROW]
[ROW][C]3.91618707804735[/C][/ROW]
[ROW][C]6.47491354842596[/C][/ROW]
[ROW][C]8.28713567227212[/C][/ROW]
[ROW][C]5.40287926664824[/C][/ROW]
[ROW][C]16.7812650716273[/C][/ROW]
[ROW][C]30.9260345448556[/C][/ROW]
[ROW][C]19.8694816559251[/C][/ROW]
[ROW][C]11.5642941813113[/C][/ROW]
[ROW][C]10.4286071716539[/C][/ROW]
[ROW][C]-28.3730519603189[/C][/ROW]
[ROW][C]-19.7172350220825[/C][/ROW]
[ROW][C]-7.21635926769749[/C][/ROW]
[ROW][C]8.36954726767021[/C][/ROW]
[ROW][C]9.15756550466323[/C][/ROW]
[ROW][C]3.32134689117897[/C][/ROW]
[ROW][C]1.30625480837877[/C][/ROW]
[ROW][C]4.51970159592519[/C][/ROW]
[ROW][C]-17.5976798315635[/C][/ROW]
[ROW][C]19.6196224486157[/C][/ROW]
[ROW][C]3.46910601797999[/C][/ROW]
[ROW][C]19.6582801623059[/C][/ROW]
[ROW][C]16.2598094039273[/C][/ROW]
[ROW][C]-22.9361353589975[/C][/ROW]
[ROW][C]15.166492071433[/C][/ROW]
[ROW][C]-0.644526671162106[/C][/ROW]
[ROW][C]1.61078543170196[/C][/ROW]
[ROW][C]3.71094534132448[/C][/ROW]
[ROW][C]0.406310118957143[/C][/ROW]
[ROW][C]1.57789424637371[/C][/ROW]
[ROW][C]-8.70872764310405[/C][/ROW]
[ROW][C]3.02647303846466[/C][/ROW]
[ROW][C]10.1792153329818[/C][/ROW]
[ROW][C]14.3909212091012[/C][/ROW]
[ROW][C]5.44016318703476[/C][/ROW]
[ROW][C]-4.93687772718709[/C][/ROW]
[ROW][C]1.3322254980925[/C][/ROW]
[ROW][C]1.47836066672018[/C][/ROW]
[ROW][C]1.32038845266995[/C][/ROW]
[ROW][C]4.38656839391118[/C][/ROW]
[ROW][C]0.673268564079346[/C][/ROW]
[ROW][C]-2.57215387003796[/C][/ROW]
[/TABLE]
Source: https://freestatistics.org/blog/index.php?pk=160663&T=2

Globally Unique Identifier (entire table): ba.freestatistics.org/blog/index.php?pk=160663&T=2

As an alternative you can also use a QR Code:  

The GUIDs for individual cells are displayed in the table below:

Estimated ARIMA Residuals
Value
-0.75123166071088
50.1015226389001
10.3628571962208
-0.677651356808817
4.76671552339168
-13.7949723076812
12.5204796018441
-0.0839439368435434
0.0501280420730206
2.64646182244958
-1.84403420925041
21.9924795824558
-0.997314655389231
-38.4411743329353
-13.6630659130386
-1.79202221093846
10.9717365119362
3.92308969152965
5.73054191936399
2.94893034337832
9.71209670082815
-15.2650224016771
-16.4166739592005
-16.7440263732583
20.7656802036703
-19.0159815882499
-1.63636878241727
7.47515863754928
-0.310696926739526
5.86157045256572
14.8998473697534
2.92856166129385
4.69074497678034
18.6014798066895
-26.0623150692097
12.8951166207894
-17.8538359029495
17.9365153627785
16.4896373143675
19.5049061408888
-12.5662650345608
0.039227256889992
28.3575993091246
-4.5100623999998
4.42769223964562
3.54590755500664
-32.0244185306466
0.184479640877653
3.54955757081099
-2.86119279614453
-19.7637162499926
-17.9982718284119
16.3154847653443
3.91618707804735
6.47491354842596
8.28713567227212
5.40287926664824
16.7812650716273
30.9260345448556
19.8694816559251
11.5642941813113
10.4286071716539
-28.3730519603189
-19.7172350220825
-7.21635926769749
8.36954726767021
9.15756550466323
3.32134689117897
1.30625480837877
4.51970159592519
-17.5976798315635
19.6196224486157
3.46910601797999
19.6582801623059
16.2598094039273
-22.9361353589975
15.166492071433
-0.644526671162106
1.61078543170196
3.71094534132448
0.406310118957143
1.57789424637371
-8.70872764310405
3.02647303846466
10.1792153329818
14.3909212091012
5.44016318703476
-4.93687772718709
1.3322254980925
1.47836066672018
1.32038845266995
4.38656839391118
0.673268564079346
-2.57215387003796


Parameters (Session):
par1 = FALSE ; par2 = 1 ; par3 = 1 ; par4 = 1 ; par5 = 12 ; par6 = 3 ; par7 = 1 ; par8 = 2 ; par9 = 1 ;
Parameters (R input):
par1 = FALSE ; par2 = 1 ; par3 = 1 ; par4 = 1 ; par5 = 12 ; par6 = 3 ; par7 = 1 ; par8 = 2 ; par9 = 1 ;
R code (references can be found in the software module):
library(lattice)
if (par1 == 'TRUE') par1 <- TRUE
if (par1 == 'FALSE') par1 <- FALSE
par2 <- as.numeric(par2) #Box-Cox lambda transformation parameter
par3 <- as.numeric(par3) #degree of non-seasonal differencing
par4 <- as.numeric(par4) #degree of seasonal differencing
par5 <- as.numeric(par5) #seasonal period
par6 <- as.numeric(par6) #degree (p) of the non-seasonal AR(p) polynomial
par7 <- as.numeric(par7) #degree (q) of the non-seasonal MA(q) polynomial
par8 <- as.numeric(par8) #degree (P) of the seasonal AR(P) polynomial
par9 <- as.numeric(par9) #degree (Q) of the seasonal MA(Q) polynomial
armaGR <- function(arima.out, names, n){
try1 <- arima.out$coef
try2 <- sqrt(diag(arima.out$var.coef))
try.data.frame <- data.frame(matrix(NA,ncol=4,nrow=length(names)))
dimnames(try.data.frame) <- list(names,c('coef','std','tstat','pv'))
try.data.frame[,1] <- try1
for(i in 1:length(try2)) try.data.frame[which(rownames(try.data.frame)==names(try2)[i]),2] <- try2[i]
try.data.frame[,3] <- try.data.frame[,1] / try.data.frame[,2]
try.data.frame[,4] <- round((1-pt(abs(try.data.frame[,3]),df=n-(length(try2)+1)))*2,5)
vector <- rep(NA,length(names))
vector[is.na(try.data.frame[,4])] <- 0
maxi <- which.max(try.data.frame[,4])
continue <- max(try.data.frame[,4],na.rm=TRUE) > .05
vector[maxi] <- 0
list(summary=try.data.frame,next.vector=vector,continue=continue)
}
arimaSelect <- function(series, order=c(13,0,0), seasonal=list(order=c(2,0,0),period=12), include.mean=F){
nrc <- order[1]+order[3]+seasonal$order[1]+seasonal$order[3]
coeff <- matrix(NA, nrow=nrc*2, ncol=nrc)
pval <- matrix(NA, nrow=nrc*2, ncol=nrc)
mylist <- rep(list(NULL), nrc)
names <- NULL
if(order[1] > 0) names <- paste('ar',1:order[1],sep='')
if(order[3] > 0) names <- c( names , paste('ma',1:order[3],sep='') )
if(seasonal$order[1] > 0) names <- c(names, paste('sar',1:seasonal$order[1],sep=''))
if(seasonal$order[3] > 0) names <- c(names, paste('sma',1:seasonal$order[3],sep=''))
arima.out <- arima(series, order=order, seasonal=seasonal, include.mean=include.mean, method='ML')
mylist[[1]] <- arima.out
last.arma <- armaGR(arima.out, names, length(series))
mystop <- FALSE
i <- 1
coeff[i,] <- last.arma[[1]][,1]
pval [i,] <- last.arma[[1]][,4]
i <- 2
aic <- arima.out$aic
while(!mystop){
mylist[[i]] <- arima.out
arima.out <- arima(series, order=order, seasonal=seasonal, include.mean=include.mean, method='ML', fixed=last.arma$next.vector)
aic <- c(aic, arima.out$aic)
last.arma <- armaGR(arima.out, names, length(series))
mystop <- !last.arma$continue
coeff[i,] <- last.arma[[1]][,1]
pval [i,] <- last.arma[[1]][,4]
i <- i+1
}
list(coeff, pval, mylist, aic=aic)
}
arimaSelectplot <- function(arimaSelect.out,noms,choix){
noms <- names(arimaSelect.out[[3]][[1]]$coef)
coeff <- arimaSelect.out[[1]]
k <- min(which(is.na(coeff[,1])))-1
coeff <- coeff[1:k,]
pval <- arimaSelect.out[[2]][1:k,]
aic <- arimaSelect.out$aic[1:k]
coeff[coeff==0] <- NA
n <- ncol(coeff)
if(missing(choix)) choix <- k
layout(matrix(c(1,1,1,2,
3,3,3,2,
3,3,3,4,
5,6,7,7),nr=4),
widths=c(10,35,45,15),
heights=c(30,30,15,15))
couleurs <- rainbow(75)[1:50]#(50)
ticks <- pretty(coeff)
par(mar=c(1,1,3,1))
plot(aic,k:1-.5,type='o',pch=21,bg='blue',cex=2,axes=F,lty=2,xpd=NA)
points(aic[choix],k-choix+.5,pch=21,cex=4,bg=2,xpd=NA)
title('aic',line=2)
par(mar=c(3,0,0,0))
plot(0,axes=F,xlab='',ylab='',xlim=range(ticks),ylim=c(.1,1))
rect(xleft = min(ticks) + (0:49)/50*(max(ticks)-min(ticks)),
xright = min(ticks) + (1:50)/50*(max(ticks)-min(ticks)),
ytop = rep(1,50),
ybottom= rep(0,50),col=couleurs,border=NA)
axis(1,ticks)
rect(xleft=min(ticks),xright=max(ticks),ytop=1,ybottom=0)
text(mean(coeff,na.rm=T),.5,'coefficients',cex=2,font=2)
par(mar=c(1,1,3,1))
image(1:n,1:k,t(coeff[k:1,]),axes=F,col=couleurs,zlim=range(ticks))
for(i in 1:n) for(j in 1:k) if(!is.na(coeff[j,i])) {
if(pval[j,i]<.01) symb = 'green'
else if( (pval[j,i]<.05) & (pval[j,i]>=.01)) symb = 'orange'
else if( (pval[j,i]<.1) & (pval[j,i]>=.05)) symb = 'red'
else symb = 'black'
polygon(c(i+.5 ,i+.2 ,i+.5 ,i+.5),
c(k-j+0.5,k-j+0.5,k-j+0.8,k-j+0.5),
col=symb)
if(j==choix) {
rect(xleft=i-.5,
xright=i+.5,
ybottom=k-j+1.5,
ytop=k-j+.5,
lwd=4)
text(i,
k-j+1,
round(coeff[j,i],2),
cex=1.2,
font=2)
}
else{
rect(xleft=i-.5,xright=i+.5,ybottom=k-j+1.5,ytop=k-j+.5)
text(i,k-j+1,round(coeff[j,i],2),cex=1.2,font=1)
}
}
axis(3,1:n,noms)
par(mar=c(0.5,0,0,0.5))
plot(0,axes=F,xlab='',ylab='',type='n',xlim=c(0,8),ylim=c(-.2,.8))
cols <- c('green','orange','red','black')
niv <- c('0','0.01','0.05','0.1')
for(i in 0:3){
polygon(c(1+2*i ,1+2*i ,1+2*i-.5 ,1+2*i),
c(.4 ,.7 , .4 , .4),
col=cols[i+1])
text(2*i,0.5,niv[i+1],cex=1.5)
}
text(8,.5,1,cex=1.5)
text(4,0,'p-value',cex=2)
box()
residus <- arimaSelect.out[[3]][[choix]]$res
par(mar=c(1,2,4,1))
acf(residus,main='')
title('acf',line=.5)
par(mar=c(1,2,4,1))
pacf(residus,main='')
title('pacf',line=.5)
par(mar=c(2,2,4,1))
qqnorm(residus,main='')
title('qq-norm',line=.5)
qqline(residus)
residus
}
if (par2 == 0) x <- log(x)
if (par2 != 0) x <- x^par2
(selection <- arimaSelect(x, order=c(par6,par3,par7), seasonal=list(order=c(par8,par4,par9), period=par5)))
bitmap(file='test1.png')
resid <- arimaSelectplot(selection)
dev.off()
resid
bitmap(file='test2.png')
acf(resid,length(resid)/2, main='Residual Autocorrelation Function')
dev.off()
bitmap(file='test3.png')
pacf(resid,length(resid)/2, main='Residual Partial Autocorrelation Function')
dev.off()
bitmap(file='test4.png')
cpgram(resid, main='Residual Cumulative Periodogram')
dev.off()
bitmap(file='test5.png')
hist(resid, main='Residual Histogram', xlab='values of Residuals')
dev.off()
bitmap(file='test6.png')
densityplot(~resid,col='black',main='Residual Density Plot', xlab='values of Residuals')
dev.off()
bitmap(file='test7.png')
qqnorm(resid, main='Residual Normal Q-Q Plot')
qqline(resid)
dev.off()
ncols <- length(selection[[1]][1,])
nrows <- length(selection[[2]][,1])-1
load(file='createtable')
a<-table.start()
a<-table.row.start(a)
a<-table.element(a,'ARIMA Parameter Estimation and Backward Selection', ncols+1,TRUE)
a<-table.row.end(a)
a<-table.row.start(a)
a<-table.element(a,'Iteration', header=TRUE)
for (i in 1:ncols) {
a<-table.element(a,names(selection[[3]][[1]]$coef)[i],header=TRUE)
}
a<-table.row.end(a)
for (j in 1:nrows) {
a<-table.row.start(a)
mydum <- 'Estimates ('
mydum <- paste(mydum,j)
mydum <- paste(mydum,')')
a<-table.element(a,mydum, header=TRUE)
for (i in 1:ncols) {
a<-table.element(a,round(selection[[1]][j,i],4))
}
a<-table.row.end(a)
a<-table.row.start(a)
a<-table.element(a,'(p-val)', header=TRUE)
for (i in 1:ncols) {
mydum <- '('
mydum <- paste(mydum,round(selection[[2]][j,i],4),sep='')
mydum <- paste(mydum,')')
a<-table.element(a,mydum)
}
a<-table.row.end(a)
}
a<-table.end(a)
table.save(a,file='mytable.tab')
a<-table.start()
a<-table.row.start(a)
a<-table.element(a,'Estimated ARIMA Residuals', 1,TRUE)
a<-table.row.end(a)
a<-table.row.start(a)
a<-table.element(a,'Value', 1,TRUE)
a<-table.row.end(a)
for (i in (par4*par5+par3):length(resid)) {
a<-table.row.start(a)
a<-table.element(a,resid[i])
a<-table.row.end(a)
}
a<-table.end(a)
table.save(a,file='mytable1.tab')