Free Statistics
of Irreproducible Research!
Description of Statistical Computation | |||||||||||||||||||||||||||||||||||||||||||||||||
|---|---|---|---|---|---|---|---|---|---|---|---|---|---|---|---|---|---|---|---|---|---|---|---|---|---|---|---|---|---|---|---|---|---|---|---|---|---|---|---|---|---|---|---|---|---|---|---|---|---|
| Author's title | |||||||||||||||||||||||||||||||||||||||||||||||||
| Author | *The author of this computation has been verified* | ||||||||||||||||||||||||||||||||||||||||||||||||
| R Software Module | rwasp_regression_trees1.wasp | ||||||||||||||||||||||||||||||||||||||||||||||||
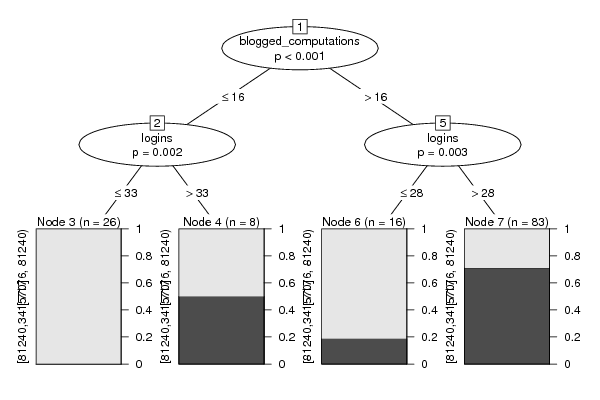
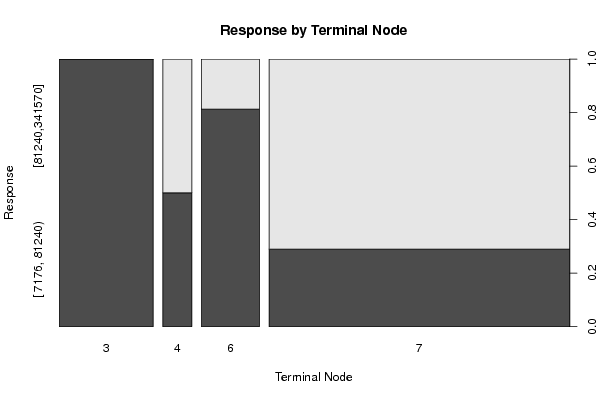
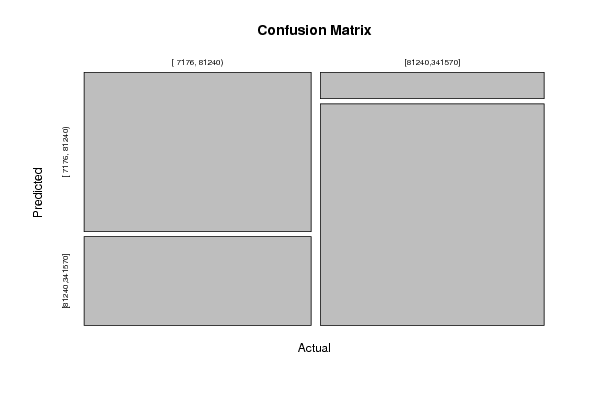
| Title produced by software | Recursive Partitioning (Regression Trees) | ||||||||||||||||||||||||||||||||||||||||||||||||
| Date of computation | Fri, 23 Dec 2011 13:28:12 -0500 | ||||||||||||||||||||||||||||||||||||||||||||||||
| Cite this page as follows | Statistical Computations at FreeStatistics.org, Office for Research Development and Education, URL https://freestatistics.org/blog/index.php?v=date/2011/Dec/23/t1324664917z04xmkdqg39faqi.htm/, Retrieved Mon, 29 Apr 2024 20:19:52 +0000 | ||||||||||||||||||||||||||||||||||||||||||||||||
| Statistical Computations at FreeStatistics.org, Office for Research Development and Education, URL https://freestatistics.org/blog/index.php?pk=160628, Retrieved Mon, 29 Apr 2024 20:19:52 +0000 | |||||||||||||||||||||||||||||||||||||||||||||||||
| QR Codes: | |||||||||||||||||||||||||||||||||||||||||||||||||
|
| |||||||||||||||||||||||||||||||||||||||||||||||||
| Original text written by user: | |||||||||||||||||||||||||||||||||||||||||||||||||
| IsPrivate? | No (this computation is public) | ||||||||||||||||||||||||||||||||||||||||||||||||
| User-defined keywords | |||||||||||||||||||||||||||||||||||||||||||||||||
| Estimated Impact | 139 | ||||||||||||||||||||||||||||||||||||||||||||||||
Tree of Dependent Computations | |||||||||||||||||||||||||||||||||||||||||||||||||
| Family? (F = Feedback message, R = changed R code, M = changed R Module, P = changed Parameters, D = changed Data) | |||||||||||||||||||||||||||||||||||||||||||||||||
| - [Kendall tau Correlation Matrix] [WS10] [2011-12-09 08:45:50] [09e53a95f5780167f20e6b4304200573] - [Kendall tau Correlation Matrix] [ws10] [2011-12-14 11:08:27] [36a3a57407ee290845630953d646934e] - RMP [Multiple Regression] [] [2011-12-14 12:44:04] [36a3a57407ee290845630953d646934e] - RMPD [Recursive Partitioning (Regression Trees)] [met categorien] [2011-12-23 15:46:10] [d1852ae60c447c0faaa37b55ffb3cb2b] - R [Recursive Partitioning (Regression Trees)] [zonder cross vali...] [2011-12-23 18:28:12] [7a9c06361804aa08030831b1a7a7bafa] [Current] | |||||||||||||||||||||||||||||||||||||||||||||||||
| Feedback Forum | |||||||||||||||||||||||||||||||||||||||||||||||||
Post a new message | |||||||||||||||||||||||||||||||||||||||||||||||||
Dataset | |||||||||||||||||||||||||||||||||||||||||||||||||
| Dataseries X: | |||||||||||||||||||||||||||||||||||||||||||||||||
101645 63 20 38 17140 28 101011 34 30 39 27570 35 7176 17 0 0 1423 0 96560 76 42 38 22996 47 175824 107 57 77 39992 70 341570 168 94 78 117105 135 103597 43 27 49 23789 26 112611 41 46 73 26706 48 85574 34 37 36 24266 40 220801 75 51 63 44418 66 92661 61 40 41 35232 39 133328 55 56 56 40909 66 61361 77 27 25 13294 27 125930 75 37 65 32387 65 82316 32 27 38 21233 25 102010 53 28 44 44332 26 101523 42 59 87 61056 77 41566 35 0 27 13497 2 99923 66 44 80 32334 36 22648 19 12 28 44339 24 46698 45 14 33 10288 14 131698 65 60 59 65622 78 91735 35 7 49 16563 15 79863 37 29 49 29011 24 108043 62 45 38 34553 40 98866 18 25 39 23517 50 120445 118 36 56 51009 63 116048 64 50 50 33416 63 250047 81 41 61 83305 55 136084 30 27 41 27142 40 92499 32 25 55 21399 21 135781 31 45 44 24874 32 74408 67 29 21 34988 36 81240 66 58 50 45549 13 133368 36 37 57 32755 57 98146 40 15 48 27114 21 79619 43 42 32 20760 43 59194 31 7 68 37636 20 139942 42 54 87 65461 82 118612 46 54 43 30080 90 72880 33 14 67 24094 25 65475 18 16 46 69008 60 99643 55 33 46 54968 61 71965 35 32 56 46090 85 77272 59 21 48 27507 43 49289 19 15 44 10672 25 135131 66 38 60 34029 41 108446 60 22 65 46300 26 89746 36 28 55 24760 38 44296 25 10 38 18779 12 77648 47 31 52 21280 29 181528 54 32 60 40662 49 134019 53 32 54 28987 46 124064 40 43 86 22827 41 92630 40 27 24 18513 31 121848 39 37 52 30594 41 52915 14 20 49 24006 26 81872 45 32 61 27913 23 58981 36 0 61 42744 14 53515 28 5 81 12934 16 60812 44 26 43 22574 25 56375 30 10 40 41385 21 65490 22 27 40 18653 32 80949 17 11 56 18472 9 76302 31 29 68 30976 35 104011 55 25 79 63339 42 98104 54 55 47 25568 68 67989 21 23 57 33747 32 30989 14 5 41 4154 6 135458 81 43 29 19474 68 73504 35 23 3 35130 33 63123 43 34 60 39067 84 61254 46 36 30 13310 46 74914 30 35 79 65892 30 31774 23 0 47 4143 0 81437 38 37 40 28579 36 87186 54 28 48 51776 47 50090 20 16 36 21152 20 65745 53 26 42 38084 50 56653 45 38 49 27717 30 158399 39 23 57 32928 30 46455 20 22 12 11342 34 73624 24 30 40 19499 33 38395 31 16 43 16380 34 91899 35 18 33 36874 37 139526 151 28 77 48259 83 52164 52 32 43 16734 32 51567 30 21 45 28207 30 70551 31 23 47 30143 43 84856 29 29 43 41369 41 102538 57 50 45 45833 51 86678 40 12 50 29156 19 85709 44 21 35 35944 37 34662 25 18 7 36278 33 150580 77 27 71 45588 41 99611 35 41 67 45097 54 19349 11 13 0 3895 14 99373 63 12 62 28394 25 86230 44 21 54 18632 25 30837 19 8 4 2325 8 31706 13 26 25 25139 26 89806 42 27 40 27975 20 62088 38 13 38 14483 11 40151 29 16 19 13127 14 27634 20 2 17 5839 3 76990 27 42 67 24069 40 37460 20 5 14 3738 5 54157 19 37 30 18625 38 49862 37 17 54 36341 32 84337 26 38 35 24548 41 64175 42 37 59 21792 46 59382 49 29 24 26263 47 119308 30 32 58 23686 37 76702 49 35 42 49303 51 103425 67 17 46 25659 49 70344 28 20 61 28904 21 43410 19 7 3 2781 1 104838 49 46 52 29236 44 62215 27 24 25 19546 26 69304 30 40 40 22818 21 53117 22 3 32 32689 4 19764 12 10 4 5752 10 86680 31 37 49 22197 43 84105 20 17 63 20055 34 77945 20 28 67 25272 32 89113 39 19 32 82206 20 91005 29 29 23 32073 34 40248 16 8 7 5444 6 64187 27 10 54 20154 12 50857 21 15 37 36944 24 56613 19 15 35 8019 16 62792 35 28 51 30884 72 72535 14 17 39 19540 27 | |||||||||||||||||||||||||||||||||||||||||||||||||
Tables (Output of Computation) | |||||||||||||||||||||||||||||||||||||||||||||||||
| |||||||||||||||||||||||||||||||||||||||||||||||||
Figures (Output of Computation) | |||||||||||||||||||||||||||||||||||||||||||||||||
Input Parameters & R Code | |||||||||||||||||||||||||||||||||||||||||||||||||
| Parameters (Session): | |||||||||||||||||||||||||||||||||||||||||||||||||
| par1 = 1 ; par2 = equal ; par3 = 2 ; par4 = yes ; | |||||||||||||||||||||||||||||||||||||||||||||||||
| Parameters (R input): | |||||||||||||||||||||||||||||||||||||||||||||||||
| par1 = 1 ; par2 = quantiles ; par3 = 2 ; par4 = no ; | |||||||||||||||||||||||||||||||||||||||||||||||||
| R code (references can be found in the software module): | |||||||||||||||||||||||||||||||||||||||||||||||||
library(party) | |||||||||||||||||||||||||||||||||||||||||||||||||