Free Statistics

of Irreproducible Research!

Author's title

Author*The author of this computation has been verified*
R Software Modulerwasp_arimabackwardselection.wasp
Title produced by softwareARIMA Backward Selection
Date of computationFri, 23 Dec 2011 13:16:30 -0500
Cite this page as followsStatistical Computations at FreeStatistics.org, Office for Research Development and Education, URL https://freestatistics.org/blog/index.php?v=date/2011/Dec/23/t13246642075jd19lu66u201oq.htm/, Retrieved Mon, 29 Apr 2024 18:58:14 +0000
Statistical Computations at FreeStatistics.org, Office for Research Development and Education, URL https://freestatistics.org/blog/index.php?pk=160618, Retrieved Mon, 29 Apr 2024 18:58:14 +0000
QR Codes:

Original text written by user:
IsPrivate?No (this computation is public)
User-defined keywords
Estimated Impact84
Family? (F = Feedback message, R = changed R code, M = changed R Module, P = changed Parameters, D = changed Data)
-     [Recursive Partitioning (Regression Trees)] [] [2010-12-05 18:59:57] [b98453cac15ba1066b407e146608df68]
- R PD  [Recursive Partitioning (Regression Trees)] [Recursive Patterning] [2011-12-09 14:04:03] [74b1e5a3104ff0b2404b2865a63336ad]
-   PD    [Recursive Partitioning (Regression Trees)] [paper3-4] [2011-12-23 16:01:31] [f7a862281046b7153543b12c78921b36]
-   P       [Recursive Partitioning (Regression Trees)] [paper3-5] [2011-12-23 16:22:12] [f7a862281046b7153543b12c78921b36]
- RMPD          [ARIMA Backward Selection] [paper2-11] [2011-12-23 18:16:30] [47995d3a8fac585eeb070a274b466f8c] [Current]
Feedback Forum

Post a new message
Dataseries X:
1770
2203
2836
1976
2837
2150
2180
2631
1781
2327
2260
2051
2250
2102
2957
2485
2871
2447
2570
2622
1840
2682
2369
2119
2531
2214
3206
2709
2734
2348
2702
2642
2064
2647
2534
2297
2718
2321
3112
2664
2808
2668
2934
2616
2228
2463
2416
2407
2582
2101
3305
2818
2401
3019
2507
2948
2210
2467
2596
2451


Summary of computational transaction
Raw Inputview raw input (R code)
Raw Outputview raw output of R engine
Computing time5 seconds
R Server'AstonUniversity' @ aston.wessa.net

\begin{tabular}{lllllllll}
\hline
Summary of computational transaction \tabularnewline
Raw Input & view raw input (R code)  \tabularnewline
Raw Output & view raw output of R engine  \tabularnewline
Computing time & 5 seconds \tabularnewline
R Server & 'AstonUniversity' @ aston.wessa.net \tabularnewline
\hline
\end{tabular}
%Source: https://freestatistics.org/blog/index.php?pk=160618&T=0

[TABLE]
[ROW][C]Summary of computational transaction[/C][/ROW]
[ROW][C]Raw Input[/C][C]view raw input (R code) [/C][/ROW]
[ROW][C]Raw Output[/C][C]view raw output of R engine [/C][/ROW]
[ROW][C]Computing time[/C][C]5 seconds[/C][/ROW]
[ROW][C]R Server[/C][C]'AstonUniversity' @ aston.wessa.net[/C][/ROW]
[/TABLE]
Source: https://freestatistics.org/blog/index.php?pk=160618&T=0

Globally Unique Identifier (entire table): ba.freestatistics.org/blog/index.php?pk=160618&T=0

As an alternative you can also use a QR Code:  

The GUIDs for individual cells are displayed in the table below:

Summary of computational transaction
Raw Inputview raw input (R code)
Raw Outputview raw output of R engine
Computing time5 seconds
R Server'AstonUniversity' @ aston.wessa.net


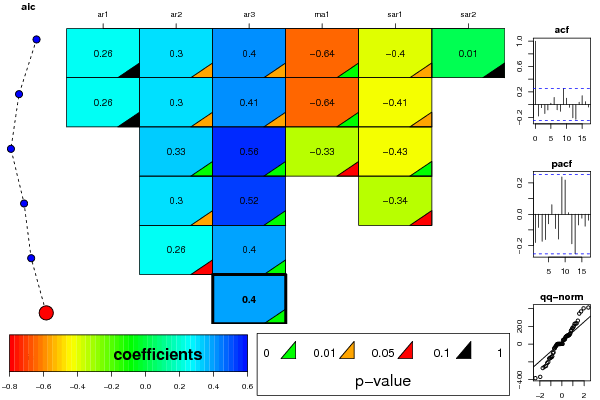
ARIMA Parameter Estimation and Backward Selection
Iterationar1ar2ar3ma1sar1sar2
Estimates ( 1 )0.260.30480.4047-0.6442-0.40290.0142
(p-val)(0.2221 )(0.03 )(0.0403 )(0.0029 )(0.0415 )(0.9498 )
Estimates ( 2 )0.25730.30460.408-0.6423-0.410
(p-val)(0.2175 )(0.0298 )(0.0325 )(0.0027 )(0.012 )(NA )
Estimates ( 3 )00.32940.5593-0.3304-0.43160
(p-val)(NA )(0.0088 )(0 )(0.0938 )(0.0066 )(NA )
Estimates ( 4 )00.29820.52250-0.33620
(p-val)(NA )(0.0124 )(1e-04 )(NA )(0.0643 )(NA )
Estimates ( 5 )00.25680.3976000
(p-val)(NA )(0.0516 )(0.003 )(NA )(NA )(NA )
Estimates ( 6 )000.4014000
(p-val)(NA )(NA )(0.0043 )(NA )(NA )(NA )
Estimates ( 7 )NANANANANANA
(p-val)(NA )(NA )(NA )(NA )(NA )(NA )
Estimates ( 8 )NANANANANANA
(p-val)(NA )(NA )(NA )(NA )(NA )(NA )
Estimates ( 9 )NANANANANANA
(p-val)(NA )(NA )(NA )(NA )(NA )(NA )
Estimates ( 10 )NANANANANANA
(p-val)(NA )(NA )(NA )(NA )(NA )(NA )
Estimates ( 11 )NANANANANANA
(p-val)(NA )(NA )(NA )(NA )(NA )(NA )

\begin{tabular}{lllllllll}
\hline
ARIMA Parameter Estimation and Backward Selection \tabularnewline
Iteration & ar1 & ar2 & ar3 & ma1 & sar1 & sar2 \tabularnewline
Estimates ( 1 ) & 0.26 & 0.3048 & 0.4047 & -0.6442 & -0.4029 & 0.0142 \tabularnewline
(p-val) & (0.2221 ) & (0.03 ) & (0.0403 ) & (0.0029 ) & (0.0415 ) & (0.9498 ) \tabularnewline
Estimates ( 2 ) & 0.2573 & 0.3046 & 0.408 & -0.6423 & -0.41 & 0 \tabularnewline
(p-val) & (0.2175 ) & (0.0298 ) & (0.0325 ) & (0.0027 ) & (0.012 ) & (NA ) \tabularnewline
Estimates ( 3 ) & 0 & 0.3294 & 0.5593 & -0.3304 & -0.4316 & 0 \tabularnewline
(p-val) & (NA ) & (0.0088 ) & (0 ) & (0.0938 ) & (0.0066 ) & (NA ) \tabularnewline
Estimates ( 4 ) & 0 & 0.2982 & 0.5225 & 0 & -0.3362 & 0 \tabularnewline
(p-val) & (NA ) & (0.0124 ) & (1e-04 ) & (NA ) & (0.0643 ) & (NA ) \tabularnewline
Estimates ( 5 ) & 0 & 0.2568 & 0.3976 & 0 & 0 & 0 \tabularnewline
(p-val) & (NA ) & (0.0516 ) & (0.003 ) & (NA ) & (NA ) & (NA ) \tabularnewline
Estimates ( 6 ) & 0 & 0 & 0.4014 & 0 & 0 & 0 \tabularnewline
(p-val) & (NA ) & (NA ) & (0.0043 ) & (NA ) & (NA ) & (NA ) \tabularnewline
Estimates ( 7 ) & NA & NA & NA & NA & NA & NA \tabularnewline
(p-val) & (NA ) & (NA ) & (NA ) & (NA ) & (NA ) & (NA ) \tabularnewline
Estimates ( 8 ) & NA & NA & NA & NA & NA & NA \tabularnewline
(p-val) & (NA ) & (NA ) & (NA ) & (NA ) & (NA ) & (NA ) \tabularnewline
Estimates ( 9 ) & NA & NA & NA & NA & NA & NA \tabularnewline
(p-val) & (NA ) & (NA ) & (NA ) & (NA ) & (NA ) & (NA ) \tabularnewline
Estimates ( 10 ) & NA & NA & NA & NA & NA & NA \tabularnewline
(p-val) & (NA ) & (NA ) & (NA ) & (NA ) & (NA ) & (NA ) \tabularnewline
Estimates ( 11 ) & NA & NA & NA & NA & NA & NA \tabularnewline
(p-val) & (NA ) & (NA ) & (NA ) & (NA ) & (NA ) & (NA ) \tabularnewline
\hline
\end{tabular}
%Source: https://freestatistics.org/blog/index.php?pk=160618&T=1

[TABLE]
[ROW][C]ARIMA Parameter Estimation and Backward Selection[/C][/ROW]
[ROW][C]Iteration[/C][C]ar1[/C][C]ar2[/C][C]ar3[/C][C]ma1[/C][C]sar1[/C][C]sar2[/C][/ROW]
[ROW][C]Estimates ( 1 )[/C][C]0.26[/C][C]0.3048[/C][C]0.4047[/C][C]-0.6442[/C][C]-0.4029[/C][C]0.0142[/C][/ROW]
[ROW][C](p-val)[/C][C](0.2221 )[/C][C](0.03 )[/C][C](0.0403 )[/C][C](0.0029 )[/C][C](0.0415 )[/C][C](0.9498 )[/C][/ROW]
[ROW][C]Estimates ( 2 )[/C][C]0.2573[/C][C]0.3046[/C][C]0.408[/C][C]-0.6423[/C][C]-0.41[/C][C]0[/C][/ROW]
[ROW][C](p-val)[/C][C](0.2175 )[/C][C](0.0298 )[/C][C](0.0325 )[/C][C](0.0027 )[/C][C](0.012 )[/C][C](NA )[/C][/ROW]
[ROW][C]Estimates ( 3 )[/C][C]0[/C][C]0.3294[/C][C]0.5593[/C][C]-0.3304[/C][C]-0.4316[/C][C]0[/C][/ROW]
[ROW][C](p-val)[/C][C](NA )[/C][C](0.0088 )[/C][C](0 )[/C][C](0.0938 )[/C][C](0.0066 )[/C][C](NA )[/C][/ROW]
[ROW][C]Estimates ( 4 )[/C][C]0[/C][C]0.2982[/C][C]0.5225[/C][C]0[/C][C]-0.3362[/C][C]0[/C][/ROW]
[ROW][C](p-val)[/C][C](NA )[/C][C](0.0124 )[/C][C](1e-04 )[/C][C](NA )[/C][C](0.0643 )[/C][C](NA )[/C][/ROW]
[ROW][C]Estimates ( 5 )[/C][C]0[/C][C]0.2568[/C][C]0.3976[/C][C]0[/C][C]0[/C][C]0[/C][/ROW]
[ROW][C](p-val)[/C][C](NA )[/C][C](0.0516 )[/C][C](0.003 )[/C][C](NA )[/C][C](NA )[/C][C](NA )[/C][/ROW]
[ROW][C]Estimates ( 6 )[/C][C]0[/C][C]0[/C][C]0.4014[/C][C]0[/C][C]0[/C][C]0[/C][/ROW]
[ROW][C](p-val)[/C][C](NA )[/C][C](NA )[/C][C](0.0043 )[/C][C](NA )[/C][C](NA )[/C][C](NA )[/C][/ROW]
[ROW][C]Estimates ( 7 )[/C][C]NA[/C][C]NA[/C][C]NA[/C][C]NA[/C][C]NA[/C][C]NA[/C][/ROW]
[ROW][C](p-val)[/C][C](NA )[/C][C](NA )[/C][C](NA )[/C][C](NA )[/C][C](NA )[/C][C](NA )[/C][/ROW]
[ROW][C]Estimates ( 8 )[/C][C]NA[/C][C]NA[/C][C]NA[/C][C]NA[/C][C]NA[/C][C]NA[/C][/ROW]
[ROW][C](p-val)[/C][C](NA )[/C][C](NA )[/C][C](NA )[/C][C](NA )[/C][C](NA )[/C][C](NA )[/C][/ROW]
[ROW][C]Estimates ( 9 )[/C][C]NA[/C][C]NA[/C][C]NA[/C][C]NA[/C][C]NA[/C][C]NA[/C][/ROW]
[ROW][C](p-val)[/C][C](NA )[/C][C](NA )[/C][C](NA )[/C][C](NA )[/C][C](NA )[/C][C](NA )[/C][/ROW]
[ROW][C]Estimates ( 10 )[/C][C]NA[/C][C]NA[/C][C]NA[/C][C]NA[/C][C]NA[/C][C]NA[/C][/ROW]
[ROW][C](p-val)[/C][C](NA )[/C][C](NA )[/C][C](NA )[/C][C](NA )[/C][C](NA )[/C][C](NA )[/C][/ROW]
[ROW][C]Estimates ( 11 )[/C][C]NA[/C][C]NA[/C][C]NA[/C][C]NA[/C][C]NA[/C][C]NA[/C][/ROW]
[ROW][C](p-val)[/C][C](NA )[/C][C](NA )[/C][C](NA )[/C][C](NA )[/C][C](NA )[/C][C](NA )[/C][/ROW]
[/TABLE]
Source: https://freestatistics.org/blog/index.php?pk=160618&T=1

Globally Unique Identifier (entire table): ba.freestatistics.org/blog/index.php?pk=160618&T=1

As an alternative you can also use a QR Code:  

The GUIDs for individual cells are displayed in the table below:

ARIMA Parameter Estimation and Backward Selection
Iterationar1ar2ar3ma1sar1sar2
Estimates ( 1 )0.260.30480.4047-0.6442-0.40290.0142
(p-val)(0.2221 )(0.03 )(0.0403 )(0.0029 )(0.0415 )(0.9498 )
Estimates ( 2 )0.25730.30460.408-0.6423-0.410
(p-val)(0.2175 )(0.0298 )(0.0325 )(0.0027 )(0.012 )(NA )
Estimates ( 3 )00.32940.5593-0.3304-0.43160
(p-val)(NA )(0.0088 )(0 )(0.0938 )(0.0066 )(NA )
Estimates ( 4 )00.29820.52250-0.33620
(p-val)(NA )(0.0124 )(1e-04 )(NA )(0.0643 )(NA )
Estimates ( 5 )00.25680.3976000
(p-val)(NA )(0.0516 )(0.003 )(NA )(NA )(NA )
Estimates ( 6 )000.4014000
(p-val)(NA )(NA )(0.0043 )(NA )(NA )(NA )
Estimates ( 7 )NANANANANANA
(p-val)(NA )(NA )(NA )(NA )(NA )(NA )
Estimates ( 8 )NANANANANANA
(p-val)(NA )(NA )(NA )(NA )(NA )(NA )
Estimates ( 9 )NANANANANANA
(p-val)(NA )(NA )(NA )(NA )(NA )(NA )
Estimates ( 10 )NANANANANANA
(p-val)(NA )(NA )(NA )(NA )(NA )(NA )
Estimates ( 11 )NANANANANANA
(p-val)(NA )(NA )(NA )(NA )(NA )(NA )


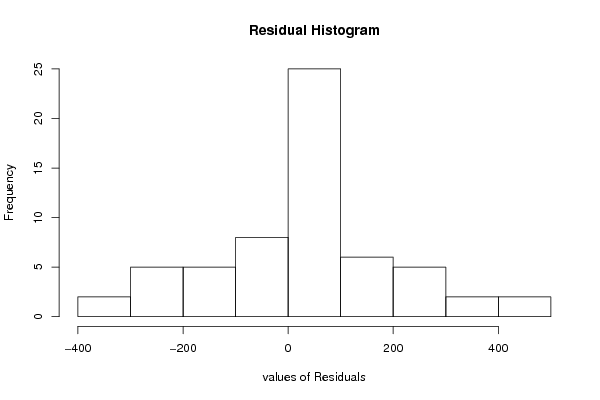
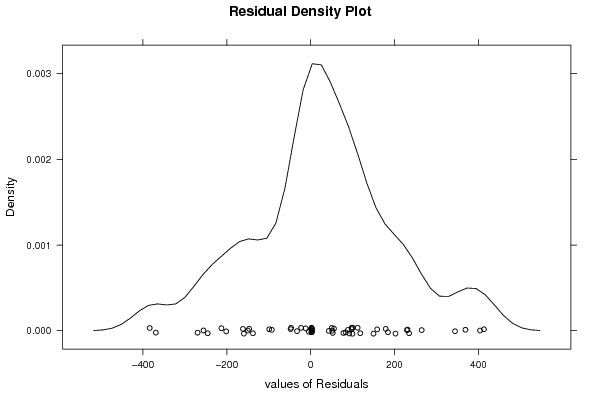
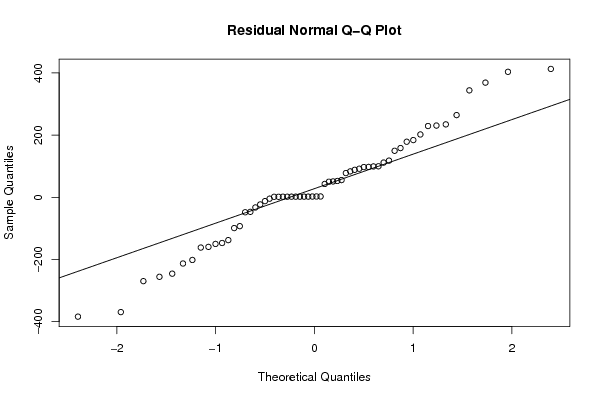
Estimated ARIMA Residuals
Value
2.05099229868668
412.984224508777
-161.466852206173
-12.086948169588
344.070168235547
43.0875001425989
118.167964787072
178.868916358701
-98.7930406963142
-159.25626410011
202.231167862954
97.4268507219438
-46.6291850128947
111.844772942974
51.1938565555805
149.796147771426
83.4997991284387
-245.482081924428
-255.538646560117
78.1116045830098
99.9012816208088
229.467282790615
-92.6249082026769
99.5212318325617
97.9167567404108
158.543430093726
-4.32340701724463
-212.804055195697
-146.837849008869
55.5927212039599
368.934841212732
230.889757268675
-137.605377687028
-22.8256831457585
-269.575684486236
-149.778530185772
92.040262990968
-32.5301405909538
-201.327661650004
184.185910850418
264.577920514315
-369.083655234508
234.70612766267
-383.714194978955
403.698951830353
-47.9133042050608
88.5312120788422
52.6056786076518
50.1302960914948

\begin{tabular}{lllllllll}
\hline
Estimated ARIMA Residuals \tabularnewline
Value \tabularnewline
2.05099229868668 \tabularnewline
412.984224508777 \tabularnewline
-161.466852206173 \tabularnewline
-12.086948169588 \tabularnewline
344.070168235547 \tabularnewline
43.0875001425989 \tabularnewline
118.167964787072 \tabularnewline
178.868916358701 \tabularnewline
-98.7930406963142 \tabularnewline
-159.25626410011 \tabularnewline
202.231167862954 \tabularnewline
97.4268507219438 \tabularnewline
-46.6291850128947 \tabularnewline
111.844772942974 \tabularnewline
51.1938565555805 \tabularnewline
149.796147771426 \tabularnewline
83.4997991284387 \tabularnewline
-245.482081924428 \tabularnewline
-255.538646560117 \tabularnewline
78.1116045830098 \tabularnewline
99.9012816208088 \tabularnewline
229.467282790615 \tabularnewline
-92.6249082026769 \tabularnewline
99.5212318325617 \tabularnewline
97.9167567404108 \tabularnewline
158.543430093726 \tabularnewline
-4.32340701724463 \tabularnewline
-212.804055195697 \tabularnewline
-146.837849008869 \tabularnewline
55.5927212039599 \tabularnewline
368.934841212732 \tabularnewline
230.889757268675 \tabularnewline
-137.605377687028 \tabularnewline
-22.8256831457585 \tabularnewline
-269.575684486236 \tabularnewline
-149.778530185772 \tabularnewline
92.040262990968 \tabularnewline
-32.5301405909538 \tabularnewline
-201.327661650004 \tabularnewline
184.185910850418 \tabularnewline
264.577920514315 \tabularnewline
-369.083655234508 \tabularnewline
234.70612766267 \tabularnewline
-383.714194978955 \tabularnewline
403.698951830353 \tabularnewline
-47.9133042050608 \tabularnewline
88.5312120788422 \tabularnewline
52.6056786076518 \tabularnewline
50.1302960914948 \tabularnewline
\hline
\end{tabular}
%Source: https://freestatistics.org/blog/index.php?pk=160618&T=2

[TABLE]
[ROW][C]Estimated ARIMA Residuals[/C][/ROW]
[ROW][C]Value[/C][/ROW]
[ROW][C]2.05099229868668[/C][/ROW]
[ROW][C]412.984224508777[/C][/ROW]
[ROW][C]-161.466852206173[/C][/ROW]
[ROW][C]-12.086948169588[/C][/ROW]
[ROW][C]344.070168235547[/C][/ROW]
[ROW][C]43.0875001425989[/C][/ROW]
[ROW][C]118.167964787072[/C][/ROW]
[ROW][C]178.868916358701[/C][/ROW]
[ROW][C]-98.7930406963142[/C][/ROW]
[ROW][C]-159.25626410011[/C][/ROW]
[ROW][C]202.231167862954[/C][/ROW]
[ROW][C]97.4268507219438[/C][/ROW]
[ROW][C]-46.6291850128947[/C][/ROW]
[ROW][C]111.844772942974[/C][/ROW]
[ROW][C]51.1938565555805[/C][/ROW]
[ROW][C]149.796147771426[/C][/ROW]
[ROW][C]83.4997991284387[/C][/ROW]
[ROW][C]-245.482081924428[/C][/ROW]
[ROW][C]-255.538646560117[/C][/ROW]
[ROW][C]78.1116045830098[/C][/ROW]
[ROW][C]99.9012816208088[/C][/ROW]
[ROW][C]229.467282790615[/C][/ROW]
[ROW][C]-92.6249082026769[/C][/ROW]
[ROW][C]99.5212318325617[/C][/ROW]
[ROW][C]97.9167567404108[/C][/ROW]
[ROW][C]158.543430093726[/C][/ROW]
[ROW][C]-4.32340701724463[/C][/ROW]
[ROW][C]-212.804055195697[/C][/ROW]
[ROW][C]-146.837849008869[/C][/ROW]
[ROW][C]55.5927212039599[/C][/ROW]
[ROW][C]368.934841212732[/C][/ROW]
[ROW][C]230.889757268675[/C][/ROW]
[ROW][C]-137.605377687028[/C][/ROW]
[ROW][C]-22.8256831457585[/C][/ROW]
[ROW][C]-269.575684486236[/C][/ROW]
[ROW][C]-149.778530185772[/C][/ROW]
[ROW][C]92.040262990968[/C][/ROW]
[ROW][C]-32.5301405909538[/C][/ROW]
[ROW][C]-201.327661650004[/C][/ROW]
[ROW][C]184.185910850418[/C][/ROW]
[ROW][C]264.577920514315[/C][/ROW]
[ROW][C]-369.083655234508[/C][/ROW]
[ROW][C]234.70612766267[/C][/ROW]
[ROW][C]-383.714194978955[/C][/ROW]
[ROW][C]403.698951830353[/C][/ROW]
[ROW][C]-47.9133042050608[/C][/ROW]
[ROW][C]88.5312120788422[/C][/ROW]
[ROW][C]52.6056786076518[/C][/ROW]
[ROW][C]50.1302960914948[/C][/ROW]
[/TABLE]
Source: https://freestatistics.org/blog/index.php?pk=160618&T=2

Globally Unique Identifier (entire table): ba.freestatistics.org/blog/index.php?pk=160618&T=2

As an alternative you can also use a QR Code:  

The GUIDs for individual cells are displayed in the table below:

Estimated ARIMA Residuals
Value
2.05099229868668
412.984224508777
-161.466852206173
-12.086948169588
344.070168235547
43.0875001425989
118.167964787072
178.868916358701
-98.7930406963142
-159.25626410011
202.231167862954
97.4268507219438
-46.6291850128947
111.844772942974
51.1938565555805
149.796147771426
83.4997991284387
-245.482081924428
-255.538646560117
78.1116045830098
99.9012816208088
229.467282790615
-92.6249082026769
99.5212318325617
97.9167567404108
158.543430093726
-4.32340701724463
-212.804055195697
-146.837849008869
55.5927212039599
368.934841212732
230.889757268675
-137.605377687028
-22.8256831457585
-269.575684486236
-149.778530185772
92.040262990968
-32.5301405909538
-201.327661650004
184.185910850418
264.577920514315
-369.083655234508
234.70612766267
-383.714194978955
403.698951830353
-47.9133042050608
88.5312120788422
52.6056786076518
50.1302960914948


Parameters (Session):
par1 = FALSE ; par2 = 1 ; par3 = 0 ; par4 = 1 ; par5 = 12 ; par6 = 3 ; par7 = 1 ; par8 = 2 ; par9 = 0 ;
Parameters (R input):
par1 = FALSE ; par2 = 1 ; par3 = 0 ; par4 = 1 ; par5 = 12 ; par6 = 3 ; par7 = 1 ; par8 = 2 ; par9 = 0 ;
R code (references can be found in the software module):
library(lattice)
if (par1 == 'TRUE') par1 <- TRUE
if (par1 == 'FALSE') par1 <- FALSE
par2 <- as.numeric(par2) #Box-Cox lambda transformation parameter
par3 <- as.numeric(par3) #degree of non-seasonal differencing
par4 <- as.numeric(par4) #degree of seasonal differencing
par5 <- as.numeric(par5) #seasonal period
par6 <- as.numeric(par6) #degree (p) of the non-seasonal AR(p) polynomial
par7 <- as.numeric(par7) #degree (q) of the non-seasonal MA(q) polynomial
par8 <- as.numeric(par8) #degree (P) of the seasonal AR(P) polynomial
par9 <- as.numeric(par9) #degree (Q) of the seasonal MA(Q) polynomial
armaGR <- function(arima.out, names, n){
try1 <- arima.out$coef
try2 <- sqrt(diag(arima.out$var.coef))
try.data.frame <- data.frame(matrix(NA,ncol=4,nrow=length(names)))
dimnames(try.data.frame) <- list(names,c('coef','std','tstat','pv'))
try.data.frame[,1] <- try1
for(i in 1:length(try2)) try.data.frame[which(rownames(try.data.frame)==names(try2)[i]),2] <- try2[i]
try.data.frame[,3] <- try.data.frame[,1] / try.data.frame[,2]
try.data.frame[,4] <- round((1-pt(abs(try.data.frame[,3]),df=n-(length(try2)+1)))*2,5)
vector <- rep(NA,length(names))
vector[is.na(try.data.frame[,4])] <- 0
maxi <- which.max(try.data.frame[,4])
continue <- max(try.data.frame[,4],na.rm=TRUE) > .05
vector[maxi] <- 0
list(summary=try.data.frame,next.vector=vector,continue=continue)
}
arimaSelect <- function(series, order=c(13,0,0), seasonal=list(order=c(2,0,0),period=12), include.mean=F){
nrc <- order[1]+order[3]+seasonal$order[1]+seasonal$order[3]
coeff <- matrix(NA, nrow=nrc*2, ncol=nrc)
pval <- matrix(NA, nrow=nrc*2, ncol=nrc)
mylist <- rep(list(NULL), nrc)
names <- NULL
if(order[1] > 0) names <- paste('ar',1:order[1],sep='')
if(order[3] > 0) names <- c( names , paste('ma',1:order[3],sep='') )
if(seasonal$order[1] > 0) names <- c(names, paste('sar',1:seasonal$order[1],sep=''))
if(seasonal$order[3] > 0) names <- c(names, paste('sma',1:seasonal$order[3],sep=''))
arima.out <- arima(series, order=order, seasonal=seasonal, include.mean=include.mean, method='ML')
mylist[[1]] <- arima.out
last.arma <- armaGR(arima.out, names, length(series))
mystop <- FALSE
i <- 1
coeff[i,] <- last.arma[[1]][,1]
pval [i,] <- last.arma[[1]][,4]
i <- 2
aic <- arima.out$aic
while(!mystop){
mylist[[i]] <- arima.out
arima.out <- arima(series, order=order, seasonal=seasonal, include.mean=include.mean, method='ML', fixed=last.arma$next.vector)
aic <- c(aic, arima.out$aic)
last.arma <- armaGR(arima.out, names, length(series))
mystop <- !last.arma$continue
coeff[i,] <- last.arma[[1]][,1]
pval [i,] <- last.arma[[1]][,4]
i <- i+1
}
list(coeff, pval, mylist, aic=aic)
}
arimaSelectplot <- function(arimaSelect.out,noms,choix){
noms <- names(arimaSelect.out[[3]][[1]]$coef)
coeff <- arimaSelect.out[[1]]
k <- min(which(is.na(coeff[,1])))-1
coeff <- coeff[1:k,]
pval <- arimaSelect.out[[2]][1:k,]
aic <- arimaSelect.out$aic[1:k]
coeff[coeff==0] <- NA
n <- ncol(coeff)
if(missing(choix)) choix <- k
layout(matrix(c(1,1,1,2,
3,3,3,2,
3,3,3,4,
5,6,7,7),nr=4),
widths=c(10,35,45,15),
heights=c(30,30,15,15))
couleurs <- rainbow(75)[1:50]#(50)
ticks <- pretty(coeff)
par(mar=c(1,1,3,1))
plot(aic,k:1-.5,type='o',pch=21,bg='blue',cex=2,axes=F,lty=2,xpd=NA)
points(aic[choix],k-choix+.5,pch=21,cex=4,bg=2,xpd=NA)
title('aic',line=2)
par(mar=c(3,0,0,0))
plot(0,axes=F,xlab='',ylab='',xlim=range(ticks),ylim=c(.1,1))
rect(xleft = min(ticks) + (0:49)/50*(max(ticks)-min(ticks)),
xright = min(ticks) + (1:50)/50*(max(ticks)-min(ticks)),
ytop = rep(1,50),
ybottom= rep(0,50),col=couleurs,border=NA)
axis(1,ticks)
rect(xleft=min(ticks),xright=max(ticks),ytop=1,ybottom=0)
text(mean(coeff,na.rm=T),.5,'coefficients',cex=2,font=2)
par(mar=c(1,1,3,1))
image(1:n,1:k,t(coeff[k:1,]),axes=F,col=couleurs,zlim=range(ticks))
for(i in 1:n) for(j in 1:k) if(!is.na(coeff[j,i])) {
if(pval[j,i]<.01) symb = 'green'
else if( (pval[j,i]<.05) & (pval[j,i]>=.01)) symb = 'orange'
else if( (pval[j,i]<.1) & (pval[j,i]>=.05)) symb = 'red'
else symb = 'black'
polygon(c(i+.5 ,i+.2 ,i+.5 ,i+.5),
c(k-j+0.5,k-j+0.5,k-j+0.8,k-j+0.5),
col=symb)
if(j==choix) {
rect(xleft=i-.5,
xright=i+.5,
ybottom=k-j+1.5,
ytop=k-j+.5,
lwd=4)
text(i,
k-j+1,
round(coeff[j,i],2),
cex=1.2,
font=2)
}
else{
rect(xleft=i-.5,xright=i+.5,ybottom=k-j+1.5,ytop=k-j+.5)
text(i,k-j+1,round(coeff[j,i],2),cex=1.2,font=1)
}
}
axis(3,1:n,noms)
par(mar=c(0.5,0,0,0.5))
plot(0,axes=F,xlab='',ylab='',type='n',xlim=c(0,8),ylim=c(-.2,.8))
cols <- c('green','orange','red','black')
niv <- c('0','0.01','0.05','0.1')
for(i in 0:3){
polygon(c(1+2*i ,1+2*i ,1+2*i-.5 ,1+2*i),
c(.4 ,.7 , .4 , .4),
col=cols[i+1])
text(2*i,0.5,niv[i+1],cex=1.5)
}
text(8,.5,1,cex=1.5)
text(4,0,'p-value',cex=2)
box()
residus <- arimaSelect.out[[3]][[choix]]$res
par(mar=c(1,2,4,1))
acf(residus,main='')
title('acf',line=.5)
par(mar=c(1,2,4,1))
pacf(residus,main='')
title('pacf',line=.5)
par(mar=c(2,2,4,1))
qqnorm(residus,main='')
title('qq-norm',line=.5)
qqline(residus)
residus
}
if (par2 == 0) x <- log(x)
if (par2 != 0) x <- x^par2
(selection <- arimaSelect(x, order=c(par6,par3,par7), seasonal=list(order=c(par8,par4,par9), period=par5)))
bitmap(file='test1.png')
resid <- arimaSelectplot(selection)
dev.off()
resid
bitmap(file='test2.png')
acf(resid,length(resid)/2, main='Residual Autocorrelation Function')
dev.off()
bitmap(file='test3.png')
pacf(resid,length(resid)/2, main='Residual Partial Autocorrelation Function')
dev.off()
bitmap(file='test4.png')
cpgram(resid, main='Residual Cumulative Periodogram')
dev.off()
bitmap(file='test5.png')
hist(resid, main='Residual Histogram', xlab='values of Residuals')
dev.off()
bitmap(file='test6.png')
densityplot(~resid,col='black',main='Residual Density Plot', xlab='values of Residuals')
dev.off()
bitmap(file='test7.png')
qqnorm(resid, main='Residual Normal Q-Q Plot')
qqline(resid)
dev.off()
ncols <- length(selection[[1]][1,])
nrows <- length(selection[[2]][,1])-1
load(file='createtable')
a<-table.start()
a<-table.row.start(a)
a<-table.element(a,'ARIMA Parameter Estimation and Backward Selection', ncols+1,TRUE)
a<-table.row.end(a)
a<-table.row.start(a)
a<-table.element(a,'Iteration', header=TRUE)
for (i in 1:ncols) {
a<-table.element(a,names(selection[[3]][[1]]$coef)[i],header=TRUE)
}
a<-table.row.end(a)
for (j in 1:nrows) {
a<-table.row.start(a)
mydum <- 'Estimates ('
mydum <- paste(mydum,j)
mydum <- paste(mydum,')')
a<-table.element(a,mydum, header=TRUE)
for (i in 1:ncols) {
a<-table.element(a,round(selection[[1]][j,i],4))
}
a<-table.row.end(a)
a<-table.row.start(a)
a<-table.element(a,'(p-val)', header=TRUE)
for (i in 1:ncols) {
mydum <- '('
mydum <- paste(mydum,round(selection[[2]][j,i],4),sep='')
mydum <- paste(mydum,')')
a<-table.element(a,mydum)
}
a<-table.row.end(a)
}
a<-table.end(a)
table.save(a,file='mytable.tab')
a<-table.start()
a<-table.row.start(a)
a<-table.element(a,'Estimated ARIMA Residuals', 1,TRUE)
a<-table.row.end(a)
a<-table.row.start(a)
a<-table.element(a,'Value', 1,TRUE)
a<-table.row.end(a)
for (i in (par4*par5+par3):length(resid)) {
a<-table.row.start(a)
a<-table.element(a,resid[i])
a<-table.row.end(a)
}
a<-table.end(a)
table.save(a,file='mytable1.tab')