Free Statistics
of Irreproducible Research!
Description of Statistical Computation | |||||||||||||||||||||||||||||||||||||||||||||||||||||||||||||||||||||||||||||||||||||||||||||||||||||||||||||||||||||||||||||||||
|---|---|---|---|---|---|---|---|---|---|---|---|---|---|---|---|---|---|---|---|---|---|---|---|---|---|---|---|---|---|---|---|---|---|---|---|---|---|---|---|---|---|---|---|---|---|---|---|---|---|---|---|---|---|---|---|---|---|---|---|---|---|---|---|---|---|---|---|---|---|---|---|---|---|---|---|---|---|---|---|---|---|---|---|---|---|---|---|---|---|---|---|---|---|---|---|---|---|---|---|---|---|---|---|---|---|---|---|---|---|---|---|---|---|---|---|---|---|---|---|---|---|---|---|---|---|---|---|---|---|
| Author's title | |||||||||||||||||||||||||||||||||||||||||||||||||||||||||||||||||||||||||||||||||||||||||||||||||||||||||||||||||||||||||||||||||
| Author | *The author of this computation has been verified* | ||||||||||||||||||||||||||||||||||||||||||||||||||||||||||||||||||||||||||||||||||||||||||||||||||||||||||||||||||||||||||||||||
| R Software Module | rwasp_regression_trees1.wasp | ||||||||||||||||||||||||||||||||||||||||||||||||||||||||||||||||||||||||||||||||||||||||||||||||||||||||||||||||||||||||||||||||
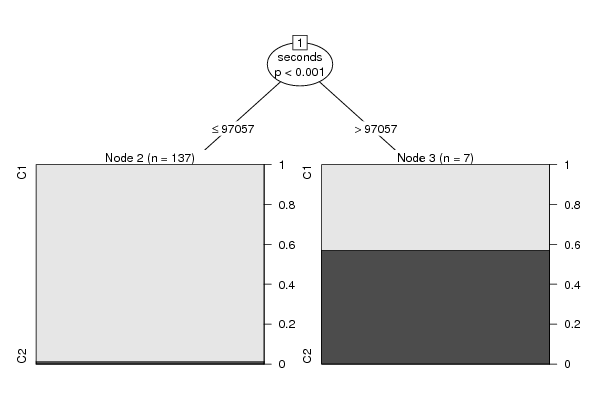
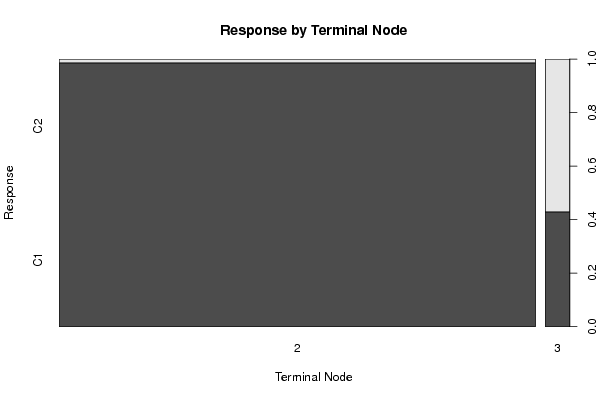
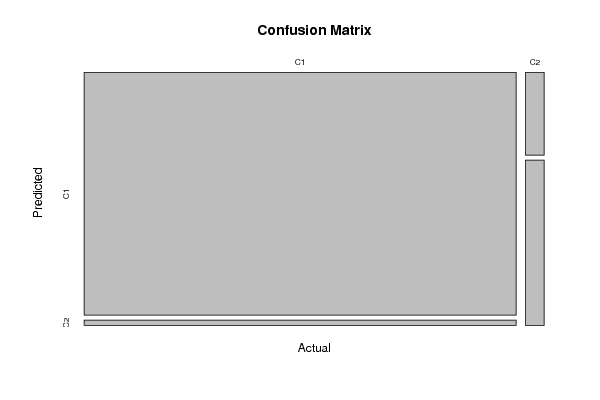
| Title produced by software | Recursive Partitioning (Regression Trees) | ||||||||||||||||||||||||||||||||||||||||||||||||||||||||||||||||||||||||||||||||||||||||||||||||||||||||||||||||||||||||||||||||
| Date of computation | Fri, 23 Dec 2011 11:48:21 -0500 | ||||||||||||||||||||||||||||||||||||||||||||||||||||||||||||||||||||||||||||||||||||||||||||||||||||||||||||||||||||||||||||||||
| Cite this page as follows | Statistical Computations at FreeStatistics.org, Office for Research Development and Education, URL https://freestatistics.org/blog/index.php?v=date/2011/Dec/23/t1324658985yrnog4x0x98zw77.htm/, Retrieved Mon, 29 Apr 2024 19:20:05 +0000 | ||||||||||||||||||||||||||||||||||||||||||||||||||||||||||||||||||||||||||||||||||||||||||||||||||||||||||||||||||||||||||||||||
| Statistical Computations at FreeStatistics.org, Office for Research Development and Education, URL https://freestatistics.org/blog/index.php?pk=160576, Retrieved Mon, 29 Apr 2024 19:20:05 +0000 | |||||||||||||||||||||||||||||||||||||||||||||||||||||||||||||||||||||||||||||||||||||||||||||||||||||||||||||||||||||||||||||||||
| QR Codes: | |||||||||||||||||||||||||||||||||||||||||||||||||||||||||||||||||||||||||||||||||||||||||||||||||||||||||||||||||||||||||||||||||
|
| |||||||||||||||||||||||||||||||||||||||||||||||||||||||||||||||||||||||||||||||||||||||||||||||||||||||||||||||||||||||||||||||||
| Original text written by user: | |||||||||||||||||||||||||||||||||||||||||||||||||||||||||||||||||||||||||||||||||||||||||||||||||||||||||||||||||||||||||||||||||
| IsPrivate? | No (this computation is public) | ||||||||||||||||||||||||||||||||||||||||||||||||||||||||||||||||||||||||||||||||||||||||||||||||||||||||||||||||||||||||||||||||
| User-defined keywords | |||||||||||||||||||||||||||||||||||||||||||||||||||||||||||||||||||||||||||||||||||||||||||||||||||||||||||||||||||||||||||||||||
| Estimated Impact | 120 | ||||||||||||||||||||||||||||||||||||||||||||||||||||||||||||||||||||||||||||||||||||||||||||||||||||||||||||||||||||||||||||||||
Tree of Dependent Computations | |||||||||||||||||||||||||||||||||||||||||||||||||||||||||||||||||||||||||||||||||||||||||||||||||||||||||||||||||||||||||||||||||
| Family? (F = Feedback message, R = changed R code, M = changed R Module, P = changed Parameters, D = changed Data) | |||||||||||||||||||||||||||||||||||||||||||||||||||||||||||||||||||||||||||||||||||||||||||||||||||||||||||||||||||||||||||||||||
| - [Recursive Partitioning (Regression Trees)] [] [2010-12-05 18:59:57] [b98453cac15ba1066b407e146608df68] - R PD [Recursive Partitioning (Regression Trees)] [Recursive Partiti...] [2011-12-15 19:58:07] [298b545ca29b1a60cbb481c5dea313ae] - [Recursive Partitioning (Regression Trees)] [Recursive Partiti...] [2011-12-15 20:11:10] [298b545ca29b1a60cbb481c5dea313ae] - PD [Recursive Partitioning (Regression Trees)] [Recursive Partiti...] [2011-12-22 20:50:11] [298b545ca29b1a60cbb481c5dea313ae] - PD [Recursive Partitioning (Regression Trees)] [Recursive Partiti...] [2011-12-23 15:58:21] [298b545ca29b1a60cbb481c5dea313ae] - P [Recursive Partitioning (Regression Trees)] [Recursive Partiti...] [2011-12-23 16:48:21] [ccdbcd1f4b80805a70032cb1a2c4c931] [Current] | |||||||||||||||||||||||||||||||||||||||||||||||||||||||||||||||||||||||||||||||||||||||||||||||||||||||||||||||||||||||||||||||||
| Feedback Forum | |||||||||||||||||||||||||||||||||||||||||||||||||||||||||||||||||||||||||||||||||||||||||||||||||||||||||||||||||||||||||||||||||
Post a new message | |||||||||||||||||||||||||||||||||||||||||||||||||||||||||||||||||||||||||||||||||||||||||||||||||||||||||||||||||||||||||||||||||
Dataset | |||||||||||||||||||||||||||||||||||||||||||||||||||||||||||||||||||||||||||||||||||||||||||||||||||||||||||||||||||||||||||||||||
| Dataseries X: | |||||||||||||||||||||||||||||||||||||||||||||||||||||||||||||||||||||||||||||||||||||||||||||||||||||||||||||||||||||||||||||||||
162687 0 48 21 20465 23975 39 201906 1 58 20 33629 85634 46 7215 0 0 0 1423 1929 0 146367 0 67 27 25629 36294 54 257045 0 83 31 54002 72255 93 524450 1 136 36 151036 189748 198 188294 1 65 23 33287 61834 42 195674 0 86 30 31172 68167 59 177020 0 62 30 28113 38462 49 325899 1 71 27 57803 101219 83 121844 2 50 24 49830 43270 49 203938 0 88 30 52143 76183 83 113213 0 61 22 21055 31476 39 220751 4 79 28 47007 62157 93 172905 4 56 18 28735 46261 31 156326 3 54 22 59147 50063 29 145178 0 81 37 78950 64483 104 89171 5 13 15 13497 2341 2 172624 0 74 34 46154 48149 46 39790 0 18 18 53249 12743 27 87927 0 31 15 10726 18743 16 241285 0 99 30 83700 97057 108 195820 1 38 25 40400 17675 36 146946 1 59 34 33797 33106 33 159763 1 54 21 36205 53311 46 207078 0 63 21 30165 42754 65 212394 0 66 25 58534 59056 80 201536 0 90 31 44663 101621 81 394662 0 72 31 92556 118120 69 217892 0 61 20 40078 79572 69 182286 0 61 28 34711 42744 37 181740 2 61 22 31076 65931 45 137978 4 53 17 74608 38575 62 255929 0 118 25 58092 28795 33 236489 1 73 25 42009 94440 77 0 0 0 0 0 0 0 230761 0 54 31 36022 38229 34 132807 3 54 14 23333 31972 44 157118 9 46 35 53349 40071 43 253254 0 83 34 92596 132480 117 269329 2 106 22 49598 62797 125 161273 0 44 34 44093 40429 49 107181 2 27 23 84205 45545 76 195891 1 64 24 63369 57568 81 139667 2 71 26 60132 39019 111 171101 2 44 23 37403 53866 61 81407 1 23 35 24460 38345 56 247563 0 78 24 46456 50210 54 239807 1 60 31 66616 80947 47 172743 8 73 30 41554 43461 55 48188 0 12 22 22346 14812 14 169355 0 104 23 30874 37819 44 315622 0 83 27 68701 102738 115 241518 0 57 30 35728 54509 57 195583 1 67 33 29010 62956 48 159913 8 44 12 23110 55411 40 220241 0 53 26 38844 50611 51 101694 1 26 26 27084 26692 32 157258 0 67 23 35139 60056 36 202536 10 36 38 57476 25155 47 173505 6 56 32 33277 42840 51 150518 0 52 21 31141 39358 37 141491 11 54 22 61281 47241 52 125612 3 57 26 25820 49611 42 166049 0 27 28 23284 41833 11 124197 0 58 33 35378 48930 47 195043 8 76 36 74990 110600 59 138708 2 93 25 29653 52235 82 116552 0 59 25 64622 53986 49 31970 0 5 21 4157 4105 6 258158 3 57 19 29245 59331 83 151184 1 42 12 50008 47796 56 135926 2 88 30 52338 38302 114 119629 1 53 21 13310 14063 46 171518 0 81 39 92901 54414 46 108949 2 35 32 10956 9903 2 183471 1 102 28 34241 53987 51 159966 0 71 29 75043 88937 96 93786 0 28 21 21152 21928 20 84971 0 34 31 42249 29487 57 88882 0 54 26 42005 35334 49 304603 0 49 29 41152 57596 51 75101 1 30 23 14399 29750 40 145043 0 57 25 28263 41029 40 95827 0 54 22 17215 12416 36 173924 0 38 26 48140 51158 64 241957 0 63 33 62897 79935 117 115367 0 58 24 22883 26552 40 118408 7 46 24 41622 25807 46 164078 0 46 21 40715 50620 61 158931 5 51 28 65897 61467 59 184139 1 87 28 76542 65292 94 152856 0 39 25 37477 55516 36 144014 0 28 15 53216 42006 51 62535 0 26 13 40911 26273 39 245196 0 52 36 57021 90248 62 199841 0 96 27 73116 61476 79 19349 0 13 1 3895 9604 14 247280 3 43 24 46609 45108 45 159408 0 42 31 29351 47232 43 72128 0 30 4 2325 3439 8 104253 0 59 21 31747 30553 41 151090 0 73 27 32665 24751 25 137382 1 39 23 19249 34458 22 87448 1 36 12 15292 24649 18 27676 0 2 16 5842 2342 3 165507 0 102 29 33994 52739 54 132148 1 30 26 13018 6245 6 0 0 0 0 0 0 0 95778 0 46 25 98177 35381 50 109001 0 25 21 37941 19595 33 158833 0 59 24 31032 50848 54 147690 1 60 21 32683 39443 63 89887 0 36 21 34545 27023 56 3616 0 0 0 0 0 0 0 0 0 0 0 0 0 199005 0 45 23 27525 61022 49 160930 0 79 33 66856 63528 90 177948 2 30 32 28549 34835 51 136061 0 43 23 38610 37172 29 43410 0 7 1 2781 13 1 184277 1 80 29 41211 62548 68 108858 0 32 20 22698 31334 29 141744 8 81 33 41194 20839 27 60493 3 3 12 32689 5084 4 19764 1 10 2 5752 9927 10 177559 3 47 21 26757 53229 47 140281 0 35 28 22527 29877 44 164249 0 54 35 44810 37310 53 11796 0 1 2 0 0 0 10674 0 0 0 0 0 0 151322 0 46 18 100674 50067 40 6836 0 0 1 0 0 0 174712 6 51 21 57786 47708 57 5118 0 5 0 0 0 0 40248 1 8 4 5444 6012 6 0 0 0 0 0 0 0 127628 0 38 29 28470 27749 24 88837 0 21 26 61849 47555 34 7131 1 0 0 0 0 0 9056 0 0 4 2179 1336 10 87957 1 18 19 8019 11017 16 144470 0 53 22 39644 55184 93 111408 1 17 22 23494 43485 28 | |||||||||||||||||||||||||||||||||||||||||||||||||||||||||||||||||||||||||||||||||||||||||||||||||||||||||||||||||||||||||||||||||
Tables (Output of Computation) | |||||||||||||||||||||||||||||||||||||||||||||||||||||||||||||||||||||||||||||||||||||||||||||||||||||||||||||||||||||||||||||||||
| |||||||||||||||||||||||||||||||||||||||||||||||||||||||||||||||||||||||||||||||||||||||||||||||||||||||||||||||||||||||||||||||||
Figures (Output of Computation) | |||||||||||||||||||||||||||||||||||||||||||||||||||||||||||||||||||||||||||||||||||||||||||||||||||||||||||||||||||||||||||||||||
Input Parameters & R Code | |||||||||||||||||||||||||||||||||||||||||||||||||||||||||||||||||||||||||||||||||||||||||||||||||||||||||||||||||||||||||||||||||
| Parameters (Session): | |||||||||||||||||||||||||||||||||||||||||||||||||||||||||||||||||||||||||||||||||||||||||||||||||||||||||||||||||||||||||||||||||
| par1 = 1 ; par2 = equal ; par3 = 2 ; par4 = yes ; | |||||||||||||||||||||||||||||||||||||||||||||||||||||||||||||||||||||||||||||||||||||||||||||||||||||||||||||||||||||||||||||||||
| Parameters (R input): | |||||||||||||||||||||||||||||||||||||||||||||||||||||||||||||||||||||||||||||||||||||||||||||||||||||||||||||||||||||||||||||||||
| par1 = 1 ; par2 = equal ; par3 = 2 ; par4 = yes ; | |||||||||||||||||||||||||||||||||||||||||||||||||||||||||||||||||||||||||||||||||||||||||||||||||||||||||||||||||||||||||||||||||
| R code (references can be found in the software module): | |||||||||||||||||||||||||||||||||||||||||||||||||||||||||||||||||||||||||||||||||||||||||||||||||||||||||||||||||||||||||||||||||
library(party) | |||||||||||||||||||||||||||||||||||||||||||||||||||||||||||||||||||||||||||||||||||||||||||||||||||||||||||||||||||||||||||||||||