Free Statistics

of Irreproducible Research!

Author's title

Author*The author of this computation has been verified*
R Software Modulerwasp_exponentialsmoothing.wasp
Title produced by softwareExponential Smoothing
Date of computationFri, 23 Dec 2011 11:24:12 -0500
Cite this page as followsStatistical Computations at FreeStatistics.org, Office for Research Development and Education, URL https://freestatistics.org/blog/index.php?v=date/2011/Dec/23/t1324657472ot260vujt6h66a8.htm/, Retrieved Mon, 29 Apr 2024 20:52:27 +0000
Statistical Computations at FreeStatistics.org, Office for Research Development and Education, URL https://freestatistics.org/blog/index.php?pk=160560, Retrieved Mon, 29 Apr 2024 20:52:27 +0000
QR Codes:

Original text written by user:
IsPrivate?No (this computation is public)
User-defined keywords
Estimated Impact114
Family? (F = Feedback message, R = changed R code, M = changed R Module, P = changed Parameters, D = changed Data)
-     [Univariate Data Series] [data set] [2008-12-01 19:54:57] [b98453cac15ba1066b407e146608df68]
- RMP   [Structural Time Series Models] [Unemployment] [2010-11-30 13:26:46] [b98453cac15ba1066b407e146608df68]
- RMPD    [Exponential Smoothing] [paper- exponentia...] [2011-12-23 13:53:45] [c2267e575f67090c7e8d960bdccd246a]
- R PD        [Exponential Smoothing] [paper- exponentia...] [2011-12-23 16:24:12] [fe2dc4bc83c881ccd49ef12feaba2b65] [Current]
Feedback Forum

Post a new message
Dataseries X:
590
580
574
573
573
620
626
620
588
566
557
561
549
532
526
511
499
555
565
542
527
510
514
517
508
493
490
469
478
528
534
518
506
502
516
528
533
536
537
524
536
587
597
581
564
558
575
580
575
563
552
537
545
601
604
586
564
549
551
556
548
540
531
521
519
572
581
563
548
539


Summary of computational transaction
Raw Inputview raw input (R code)
Raw Outputview raw output of R engine
Computing time1 seconds
R Server'Herman Ole Andreas Wold' @ wold.wessa.net

\begin{tabular}{lllllllll}
\hline
Summary of computational transaction \tabularnewline
Raw Input & view raw input (R code)  \tabularnewline
Raw Output & view raw output of R engine  \tabularnewline
Computing time & 1 seconds \tabularnewline
R Server & 'Herman Ole Andreas Wold' @ wold.wessa.net \tabularnewline
\hline
\end{tabular}
%Source: https://freestatistics.org/blog/index.php?pk=160560&T=0

[TABLE]
[ROW][C]Summary of computational transaction[/C][/ROW]
[ROW][C]Raw Input[/C][C]view raw input (R code) [/C][/ROW]
[ROW][C]Raw Output[/C][C]view raw output of R engine [/C][/ROW]
[ROW][C]Computing time[/C][C]1 seconds[/C][/ROW]
[ROW][C]R Server[/C][C]'Herman Ole Andreas Wold' @ wold.wessa.net[/C][/ROW]
[/TABLE]
Source: https://freestatistics.org/blog/index.php?pk=160560&T=0

Globally Unique Identifier (entire table): ba.freestatistics.org/blog/index.php?pk=160560&T=0

As an alternative you can also use a QR Code:  

The GUIDs for individual cells are displayed in the table below:

Summary of computational transaction
Raw Inputview raw input (R code)
Raw Outputview raw output of R engine
Computing time1 seconds
R Server'Herman Ole Andreas Wold' @ wold.wessa.net


Estimated Parameters of Exponential Smoothing
ParameterValue
alpha0.832451078408921
beta0.123601317530782
gamma1

\begin{tabular}{lllllllll}
\hline
Estimated Parameters of Exponential Smoothing \tabularnewline
Parameter & Value \tabularnewline
alpha & 0.832451078408921 \tabularnewline
beta & 0.123601317530782 \tabularnewline
gamma & 1 \tabularnewline
\hline
\end{tabular}
%Source: https://freestatistics.org/blog/index.php?pk=160560&T=1

[TABLE]
[ROW][C]Estimated Parameters of Exponential Smoothing[/C][/ROW]
[ROW][C]Parameter[/C][C]Value[/C][/ROW]
[ROW][C]alpha[/C][C]0.832451078408921[/C][/ROW]
[ROW][C]beta[/C][C]0.123601317530782[/C][/ROW]
[ROW][C]gamma[/C][C]1[/C][/ROW]
[/TABLE]
Source: https://freestatistics.org/blog/index.php?pk=160560&T=1

Globally Unique Identifier (entire table): ba.freestatistics.org/blog/index.php?pk=160560&T=1

As an alternative you can also use a QR Code:  

The GUIDs for individual cells are displayed in the table below:

Estimated Parameters of Exponential Smoothing
ParameterValue
alpha0.832451078408921
beta0.123601317530782
gamma1


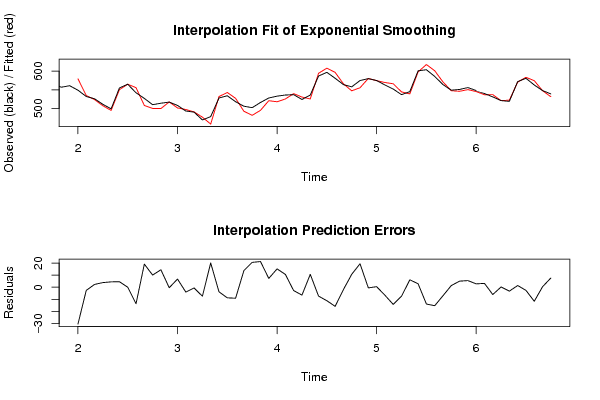
Interpolation Forecasts of Exponential Smoothing
tObservedFittedResiduals
13549579.52110042735-30.5211004273502
14532534.661481619557-2.66148161955732
15526523.719787232312.28021276769005
16511507.2097607664933.79023923350655
17499494.5967429455684.40325705443206
18555550.4470926160774.55290738392284
19565565.057143505938-0.0571435059380292
20542555.740339615207-13.7403396152068
21527507.91083932221719.0891606777833
22510499.95774816136210.0422518386375
23514499.59014919343714.4098508065633
24517517.466021787127-0.466021787126692
25508501.2550641318286.74493586817175
26493497.064169448346-4.06416944834587
27490490.617179139347-0.617179139347456
28469476.48449787727-7.48449787726992
29478457.96472156457520.0352784354246
30528531.837646869435-3.83764686943482
31534542.811850265911-8.81185026591106
32518527.135074311701-9.13507431170058
33506492.33412241767913.6658775823209
34502481.48694382019120.5130561798092
35516494.78125648389121.218743516109
36528520.7470364442057.2529635557953
37533517.87844056562315.1215594343772
38536525.42000516050310.579994839497
39537539.818256695877-2.81825669587727
40524530.553352798839-6.55335279883934
41536525.36610407988810.6338959201117
42587594.392113986212-7.3921139862116
43597608.187407079672-11.1874070796721
44581596.84794663946-15.8479466394601
45564565.957436828137-1.95743682813713
46558547.32264083276210.6773591672379
47575555.60622917558819.3937708244118
48580580.583857209497-0.583857209496841
49575574.5745195632550.425480436745488
50563569.673926777702-6.67392677770158
51552566.241522372872-14.2415223728719
52537544.443386408737-7.44338640873718
53545538.9052449453896.09475505461103
54601598.1756738195732.82432618042731
55604617.934216952287-13.9342169522874
56586601.339139065175-15.339139065175
57564571.063714632433-7.06371463243318
58549547.6339312496751.36606875032521
59551546.0074860909724.99251390902839
60556550.5485022686755.45149773132539
61548545.2523658548972.74763414510335
62540536.8542356302623.14576436973834
63531537.09755060786-6.09755060786017
64521520.8250924003940.174907599606399
65519522.288170219755-3.28817021975476
66572570.6254487998041.37455120019638
67581583.645711837744-2.64571183774399
68563574.650328935693-11.6503289356925
69548547.6497060630130.350293936986986
70539531.3844749154977.61552508450291

\begin{tabular}{lllllllll}
\hline
Interpolation Forecasts of Exponential Smoothing \tabularnewline
t & Observed & Fitted & Residuals \tabularnewline
13 & 549 & 579.52110042735 & -30.5211004273502 \tabularnewline
14 & 532 & 534.661481619557 & -2.66148161955732 \tabularnewline
15 & 526 & 523.71978723231 & 2.28021276769005 \tabularnewline
16 & 511 & 507.209760766493 & 3.79023923350655 \tabularnewline
17 & 499 & 494.596742945568 & 4.40325705443206 \tabularnewline
18 & 555 & 550.447092616077 & 4.55290738392284 \tabularnewline
19 & 565 & 565.057143505938 & -0.0571435059380292 \tabularnewline
20 & 542 & 555.740339615207 & -13.7403396152068 \tabularnewline
21 & 527 & 507.910839322217 & 19.0891606777833 \tabularnewline
22 & 510 & 499.957748161362 & 10.0422518386375 \tabularnewline
23 & 514 & 499.590149193437 & 14.4098508065633 \tabularnewline
24 & 517 & 517.466021787127 & -0.466021787126692 \tabularnewline
25 & 508 & 501.255064131828 & 6.74493586817175 \tabularnewline
26 & 493 & 497.064169448346 & -4.06416944834587 \tabularnewline
27 & 490 & 490.617179139347 & -0.617179139347456 \tabularnewline
28 & 469 & 476.48449787727 & -7.48449787726992 \tabularnewline
29 & 478 & 457.964721564575 & 20.0352784354246 \tabularnewline
30 & 528 & 531.837646869435 & -3.83764686943482 \tabularnewline
31 & 534 & 542.811850265911 & -8.81185026591106 \tabularnewline
32 & 518 & 527.135074311701 & -9.13507431170058 \tabularnewline
33 & 506 & 492.334122417679 & 13.6658775823209 \tabularnewline
34 & 502 & 481.486943820191 & 20.5130561798092 \tabularnewline
35 & 516 & 494.781256483891 & 21.218743516109 \tabularnewline
36 & 528 & 520.747036444205 & 7.2529635557953 \tabularnewline
37 & 533 & 517.878440565623 & 15.1215594343772 \tabularnewline
38 & 536 & 525.420005160503 & 10.579994839497 \tabularnewline
39 & 537 & 539.818256695877 & -2.81825669587727 \tabularnewline
40 & 524 & 530.553352798839 & -6.55335279883934 \tabularnewline
41 & 536 & 525.366104079888 & 10.6338959201117 \tabularnewline
42 & 587 & 594.392113986212 & -7.3921139862116 \tabularnewline
43 & 597 & 608.187407079672 & -11.1874070796721 \tabularnewline
44 & 581 & 596.84794663946 & -15.8479466394601 \tabularnewline
45 & 564 & 565.957436828137 & -1.95743682813713 \tabularnewline
46 & 558 & 547.322640832762 & 10.6773591672379 \tabularnewline
47 & 575 & 555.606229175588 & 19.3937708244118 \tabularnewline
48 & 580 & 580.583857209497 & -0.583857209496841 \tabularnewline
49 & 575 & 574.574519563255 & 0.425480436745488 \tabularnewline
50 & 563 & 569.673926777702 & -6.67392677770158 \tabularnewline
51 & 552 & 566.241522372872 & -14.2415223728719 \tabularnewline
52 & 537 & 544.443386408737 & -7.44338640873718 \tabularnewline
53 & 545 & 538.905244945389 & 6.09475505461103 \tabularnewline
54 & 601 & 598.175673819573 & 2.82432618042731 \tabularnewline
55 & 604 & 617.934216952287 & -13.9342169522874 \tabularnewline
56 & 586 & 601.339139065175 & -15.339139065175 \tabularnewline
57 & 564 & 571.063714632433 & -7.06371463243318 \tabularnewline
58 & 549 & 547.633931249675 & 1.36606875032521 \tabularnewline
59 & 551 & 546.007486090972 & 4.99251390902839 \tabularnewline
60 & 556 & 550.548502268675 & 5.45149773132539 \tabularnewline
61 & 548 & 545.252365854897 & 2.74763414510335 \tabularnewline
62 & 540 & 536.854235630262 & 3.14576436973834 \tabularnewline
63 & 531 & 537.09755060786 & -6.09755060786017 \tabularnewline
64 & 521 & 520.825092400394 & 0.174907599606399 \tabularnewline
65 & 519 & 522.288170219755 & -3.28817021975476 \tabularnewline
66 & 572 & 570.625448799804 & 1.37455120019638 \tabularnewline
67 & 581 & 583.645711837744 & -2.64571183774399 \tabularnewline
68 & 563 & 574.650328935693 & -11.6503289356925 \tabularnewline
69 & 548 & 547.649706063013 & 0.350293936986986 \tabularnewline
70 & 539 & 531.384474915497 & 7.61552508450291 \tabularnewline
\hline
\end{tabular}
%Source: https://freestatistics.org/blog/index.php?pk=160560&T=2

[TABLE]
[ROW][C]Interpolation Forecasts of Exponential Smoothing[/C][/ROW]
[ROW][C]t[/C][C]Observed[/C][C]Fitted[/C][C]Residuals[/C][/ROW]
[ROW][C]13[/C][C]549[/C][C]579.52110042735[/C][C]-30.5211004273502[/C][/ROW]
[ROW][C]14[/C][C]532[/C][C]534.661481619557[/C][C]-2.66148161955732[/C][/ROW]
[ROW][C]15[/C][C]526[/C][C]523.71978723231[/C][C]2.28021276769005[/C][/ROW]
[ROW][C]16[/C][C]511[/C][C]507.209760766493[/C][C]3.79023923350655[/C][/ROW]
[ROW][C]17[/C][C]499[/C][C]494.596742945568[/C][C]4.40325705443206[/C][/ROW]
[ROW][C]18[/C][C]555[/C][C]550.447092616077[/C][C]4.55290738392284[/C][/ROW]
[ROW][C]19[/C][C]565[/C][C]565.057143505938[/C][C]-0.0571435059380292[/C][/ROW]
[ROW][C]20[/C][C]542[/C][C]555.740339615207[/C][C]-13.7403396152068[/C][/ROW]
[ROW][C]21[/C][C]527[/C][C]507.910839322217[/C][C]19.0891606777833[/C][/ROW]
[ROW][C]22[/C][C]510[/C][C]499.957748161362[/C][C]10.0422518386375[/C][/ROW]
[ROW][C]23[/C][C]514[/C][C]499.590149193437[/C][C]14.4098508065633[/C][/ROW]
[ROW][C]24[/C][C]517[/C][C]517.466021787127[/C][C]-0.466021787126692[/C][/ROW]
[ROW][C]25[/C][C]508[/C][C]501.255064131828[/C][C]6.74493586817175[/C][/ROW]
[ROW][C]26[/C][C]493[/C][C]497.064169448346[/C][C]-4.06416944834587[/C][/ROW]
[ROW][C]27[/C][C]490[/C][C]490.617179139347[/C][C]-0.617179139347456[/C][/ROW]
[ROW][C]28[/C][C]469[/C][C]476.48449787727[/C][C]-7.48449787726992[/C][/ROW]
[ROW][C]29[/C][C]478[/C][C]457.964721564575[/C][C]20.0352784354246[/C][/ROW]
[ROW][C]30[/C][C]528[/C][C]531.837646869435[/C][C]-3.83764686943482[/C][/ROW]
[ROW][C]31[/C][C]534[/C][C]542.811850265911[/C][C]-8.81185026591106[/C][/ROW]
[ROW][C]32[/C][C]518[/C][C]527.135074311701[/C][C]-9.13507431170058[/C][/ROW]
[ROW][C]33[/C][C]506[/C][C]492.334122417679[/C][C]13.6658775823209[/C][/ROW]
[ROW][C]34[/C][C]502[/C][C]481.486943820191[/C][C]20.5130561798092[/C][/ROW]
[ROW][C]35[/C][C]516[/C][C]494.781256483891[/C][C]21.218743516109[/C][/ROW]
[ROW][C]36[/C][C]528[/C][C]520.747036444205[/C][C]7.2529635557953[/C][/ROW]
[ROW][C]37[/C][C]533[/C][C]517.878440565623[/C][C]15.1215594343772[/C][/ROW]
[ROW][C]38[/C][C]536[/C][C]525.420005160503[/C][C]10.579994839497[/C][/ROW]
[ROW][C]39[/C][C]537[/C][C]539.818256695877[/C][C]-2.81825669587727[/C][/ROW]
[ROW][C]40[/C][C]524[/C][C]530.553352798839[/C][C]-6.55335279883934[/C][/ROW]
[ROW][C]41[/C][C]536[/C][C]525.366104079888[/C][C]10.6338959201117[/C][/ROW]
[ROW][C]42[/C][C]587[/C][C]594.392113986212[/C][C]-7.3921139862116[/C][/ROW]
[ROW][C]43[/C][C]597[/C][C]608.187407079672[/C][C]-11.1874070796721[/C][/ROW]
[ROW][C]44[/C][C]581[/C][C]596.84794663946[/C][C]-15.8479466394601[/C][/ROW]
[ROW][C]45[/C][C]564[/C][C]565.957436828137[/C][C]-1.95743682813713[/C][/ROW]
[ROW][C]46[/C][C]558[/C][C]547.322640832762[/C][C]10.6773591672379[/C][/ROW]
[ROW][C]47[/C][C]575[/C][C]555.606229175588[/C][C]19.3937708244118[/C][/ROW]
[ROW][C]48[/C][C]580[/C][C]580.583857209497[/C][C]-0.583857209496841[/C][/ROW]
[ROW][C]49[/C][C]575[/C][C]574.574519563255[/C][C]0.425480436745488[/C][/ROW]
[ROW][C]50[/C][C]563[/C][C]569.673926777702[/C][C]-6.67392677770158[/C][/ROW]
[ROW][C]51[/C][C]552[/C][C]566.241522372872[/C][C]-14.2415223728719[/C][/ROW]
[ROW][C]52[/C][C]537[/C][C]544.443386408737[/C][C]-7.44338640873718[/C][/ROW]
[ROW][C]53[/C][C]545[/C][C]538.905244945389[/C][C]6.09475505461103[/C][/ROW]
[ROW][C]54[/C][C]601[/C][C]598.175673819573[/C][C]2.82432618042731[/C][/ROW]
[ROW][C]55[/C][C]604[/C][C]617.934216952287[/C][C]-13.9342169522874[/C][/ROW]
[ROW][C]56[/C][C]586[/C][C]601.339139065175[/C][C]-15.339139065175[/C][/ROW]
[ROW][C]57[/C][C]564[/C][C]571.063714632433[/C][C]-7.06371463243318[/C][/ROW]
[ROW][C]58[/C][C]549[/C][C]547.633931249675[/C][C]1.36606875032521[/C][/ROW]
[ROW][C]59[/C][C]551[/C][C]546.007486090972[/C][C]4.99251390902839[/C][/ROW]
[ROW][C]60[/C][C]556[/C][C]550.548502268675[/C][C]5.45149773132539[/C][/ROW]
[ROW][C]61[/C][C]548[/C][C]545.252365854897[/C][C]2.74763414510335[/C][/ROW]
[ROW][C]62[/C][C]540[/C][C]536.854235630262[/C][C]3.14576436973834[/C][/ROW]
[ROW][C]63[/C][C]531[/C][C]537.09755060786[/C][C]-6.09755060786017[/C][/ROW]
[ROW][C]64[/C][C]521[/C][C]520.825092400394[/C][C]0.174907599606399[/C][/ROW]
[ROW][C]65[/C][C]519[/C][C]522.288170219755[/C][C]-3.28817021975476[/C][/ROW]
[ROW][C]66[/C][C]572[/C][C]570.625448799804[/C][C]1.37455120019638[/C][/ROW]
[ROW][C]67[/C][C]581[/C][C]583.645711837744[/C][C]-2.64571183774399[/C][/ROW]
[ROW][C]68[/C][C]563[/C][C]574.650328935693[/C][C]-11.6503289356925[/C][/ROW]
[ROW][C]69[/C][C]548[/C][C]547.649706063013[/C][C]0.350293936986986[/C][/ROW]
[ROW][C]70[/C][C]539[/C][C]531.384474915497[/C][C]7.61552508450291[/C][/ROW]
[/TABLE]
Source: https://freestatistics.org/blog/index.php?pk=160560&T=2

Globally Unique Identifier (entire table): ba.freestatistics.org/blog/index.php?pk=160560&T=2

As an alternative you can also use a QR Code:  

The GUIDs for individual cells are displayed in the table below:

Interpolation Forecasts of Exponential Smoothing
tObservedFittedResiduals
13549579.52110042735-30.5211004273502
14532534.661481619557-2.66148161955732
15526523.719787232312.28021276769005
16511507.2097607664933.79023923350655
17499494.5967429455684.40325705443206
18555550.4470926160774.55290738392284
19565565.057143505938-0.0571435059380292
20542555.740339615207-13.7403396152068
21527507.91083932221719.0891606777833
22510499.95774816136210.0422518386375
23514499.59014919343714.4098508065633
24517517.466021787127-0.466021787126692
25508501.2550641318286.74493586817175
26493497.064169448346-4.06416944834587
27490490.617179139347-0.617179139347456
28469476.48449787727-7.48449787726992
29478457.96472156457520.0352784354246
30528531.837646869435-3.83764686943482
31534542.811850265911-8.81185026591106
32518527.135074311701-9.13507431170058
33506492.33412241767913.6658775823209
34502481.48694382019120.5130561798092
35516494.78125648389121.218743516109
36528520.7470364442057.2529635557953
37533517.87844056562315.1215594343772
38536525.42000516050310.579994839497
39537539.818256695877-2.81825669587727
40524530.553352798839-6.55335279883934
41536525.36610407988810.6338959201117
42587594.392113986212-7.3921139862116
43597608.187407079672-11.1874070796721
44581596.84794663946-15.8479466394601
45564565.957436828137-1.95743682813713
46558547.32264083276210.6773591672379
47575555.60622917558819.3937708244118
48580580.583857209497-0.583857209496841
49575574.5745195632550.425480436745488
50563569.673926777702-6.67392677770158
51552566.241522372872-14.2415223728719
52537544.443386408737-7.44338640873718
53545538.9052449453896.09475505461103
54601598.1756738195732.82432618042731
55604617.934216952287-13.9342169522874
56586601.339139065175-15.339139065175
57564571.063714632433-7.06371463243318
58549547.6339312496751.36606875032521
59551546.0074860909724.99251390902839
60556550.5485022686755.45149773132539
61548545.2523658548972.74763414510335
62540536.8542356302623.14576436973834
63531537.09755060786-6.09755060786017
64521520.8250924003940.174907599606399
65519522.288170219755-3.28817021975476
66572570.6254487998041.37455120019638
67581583.645711837744-2.64571183774399
68563574.650328935693-11.6503289356925
69548547.6497060630130.350293936986986
70539531.3844749154977.61552508450291


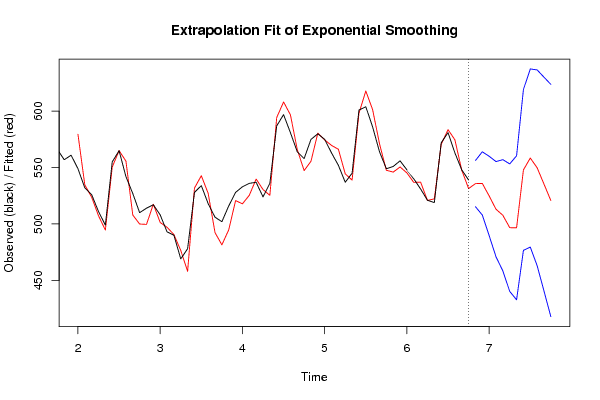
Extrapolation Forecasts of Exponential Smoothing
tForecast95% Lower Bound95% Upper Bound
71535.791374462522515.305296271165556.277452653879
72535.96295037135507.912229174932564.013671567767
73524.824444660863489.621761037357560.02712828437
74513.071805305497470.813984425554555.329626185441
75507.690099326263458.342226675057557.037971977469
76496.714268230404440.17594171451553.252594746298
77496.60328339839432.738433774654560.468133022125
78547.94913766691476.601337463823619.296937869998
79558.500233845936479.501264256605637.499203435267
80549.819455953692462.994396630833636.644515276551
81535.347472837705440.517857809319630.177087866091
82520.791497756774417.777332817655623.805662695893

\begin{tabular}{lllllllll}
\hline
Extrapolation Forecasts of Exponential Smoothing \tabularnewline
t & Forecast & 95% Lower Bound & 95% Upper Bound \tabularnewline
71 & 535.791374462522 & 515.305296271165 & 556.277452653879 \tabularnewline
72 & 535.96295037135 & 507.912229174932 & 564.013671567767 \tabularnewline
73 & 524.824444660863 & 489.621761037357 & 560.02712828437 \tabularnewline
74 & 513.071805305497 & 470.813984425554 & 555.329626185441 \tabularnewline
75 & 507.690099326263 & 458.342226675057 & 557.037971977469 \tabularnewline
76 & 496.714268230404 & 440.17594171451 & 553.252594746298 \tabularnewline
77 & 496.60328339839 & 432.738433774654 & 560.468133022125 \tabularnewline
78 & 547.94913766691 & 476.601337463823 & 619.296937869998 \tabularnewline
79 & 558.500233845936 & 479.501264256605 & 637.499203435267 \tabularnewline
80 & 549.819455953692 & 462.994396630833 & 636.644515276551 \tabularnewline
81 & 535.347472837705 & 440.517857809319 & 630.177087866091 \tabularnewline
82 & 520.791497756774 & 417.777332817655 & 623.805662695893 \tabularnewline
\hline
\end{tabular}
%Source: https://freestatistics.org/blog/index.php?pk=160560&T=3

[TABLE]
[ROW][C]Extrapolation Forecasts of Exponential Smoothing[/C][/ROW]
[ROW][C]t[/C][C]Forecast[/C][C]95% Lower Bound[/C][C]95% Upper Bound[/C][/ROW]
[ROW][C]71[/C][C]535.791374462522[/C][C]515.305296271165[/C][C]556.277452653879[/C][/ROW]
[ROW][C]72[/C][C]535.96295037135[/C][C]507.912229174932[/C][C]564.013671567767[/C][/ROW]
[ROW][C]73[/C][C]524.824444660863[/C][C]489.621761037357[/C][C]560.02712828437[/C][/ROW]
[ROW][C]74[/C][C]513.071805305497[/C][C]470.813984425554[/C][C]555.329626185441[/C][/ROW]
[ROW][C]75[/C][C]507.690099326263[/C][C]458.342226675057[/C][C]557.037971977469[/C][/ROW]
[ROW][C]76[/C][C]496.714268230404[/C][C]440.17594171451[/C][C]553.252594746298[/C][/ROW]
[ROW][C]77[/C][C]496.60328339839[/C][C]432.738433774654[/C][C]560.468133022125[/C][/ROW]
[ROW][C]78[/C][C]547.94913766691[/C][C]476.601337463823[/C][C]619.296937869998[/C][/ROW]
[ROW][C]79[/C][C]558.500233845936[/C][C]479.501264256605[/C][C]637.499203435267[/C][/ROW]
[ROW][C]80[/C][C]549.819455953692[/C][C]462.994396630833[/C][C]636.644515276551[/C][/ROW]
[ROW][C]81[/C][C]535.347472837705[/C][C]440.517857809319[/C][C]630.177087866091[/C][/ROW]
[ROW][C]82[/C][C]520.791497756774[/C][C]417.777332817655[/C][C]623.805662695893[/C][/ROW]
[/TABLE]
Source: https://freestatistics.org/blog/index.php?pk=160560&T=3

Globally Unique Identifier (entire table): ba.freestatistics.org/blog/index.php?pk=160560&T=3

As an alternative you can also use a QR Code:  

The GUIDs for individual cells are displayed in the table below:

Extrapolation Forecasts of Exponential Smoothing
tForecast95% Lower Bound95% Upper Bound
71535.791374462522515.305296271165556.277452653879
72535.96295037135507.912229174932564.013671567767
73524.824444660863489.621761037357560.02712828437
74513.071805305497470.813984425554555.329626185441
75507.690099326263458.342226675057557.037971977469
76496.714268230404440.17594171451553.252594746298
77496.60328339839432.738433774654560.468133022125
78547.94913766691476.601337463823619.296937869998
79558.500233845936479.501264256605637.499203435267
80549.819455953692462.994396630833636.644515276551
81535.347472837705440.517857809319630.177087866091
82520.791497756774417.777332817655623.805662695893


Parameters (Session):
par1 = 12 ;
Parameters (R input):
par1 = 12 ; par2 = Triple ; par3 = additive ;
R code (references can be found in the software module):
par1 <- as.numeric(par1)
if (par2 == 'Single') K <- 1
if (par2 == 'Double') K <- 2
if (par2 == 'Triple') K <- par1
nx <- length(x)
nxmK <- nx - K
x <- ts(x, frequency = par1)
if (par2 == 'Single') fit <- HoltWinters(x, gamma=F, beta=F)
if (par2 == 'Double') fit <- HoltWinters(x, gamma=F)
if (par2 == 'Triple') fit <- HoltWinters(x, seasonal=par3)
fit
myresid <- x - fit$fitted[,'xhat']
bitmap(file='test1.png')
op <- par(mfrow=c(2,1))
plot(fit,ylab='Observed (black) / Fitted (red)',main='Interpolation Fit of Exponential Smoothing')
plot(myresid,ylab='Residuals',main='Interpolation Prediction Errors')
par(op)
dev.off()
bitmap(file='test2.png')
p <- predict(fit, par1, prediction.interval=TRUE)
np <- length(p[,1])
plot(fit,p,ylab='Observed (black) / Fitted (red)',main='Extrapolation Fit of Exponential Smoothing')
dev.off()
bitmap(file='test3.png')
op <- par(mfrow = c(2,2))
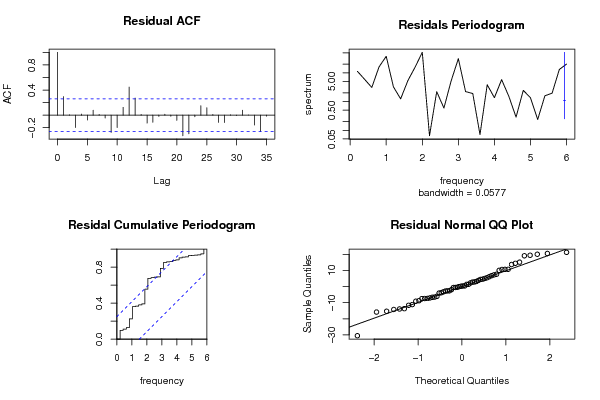
acf(as.numeric(myresid),lag.max = nx/2,main='Residual ACF')
spectrum(myresid,main='Residals Periodogram')
cpgram(myresid,main='Residal Cumulative Periodogram')
qqnorm(myresid,main='Residual Normal QQ Plot')
qqline(myresid)
par(op)
dev.off()
load(file='createtable')
a<-table.start()
a<-table.row.start(a)
a<-table.element(a,'Estimated Parameters of Exponential Smoothing',2,TRUE)
a<-table.row.end(a)
a<-table.row.start(a)
a<-table.element(a,'Parameter',header=TRUE)
a<-table.element(a,'Value',header=TRUE)
a<-table.row.end(a)
a<-table.row.start(a)
a<-table.element(a,'alpha',header=TRUE)
a<-table.element(a,fit$alpha)
a<-table.row.end(a)
a<-table.row.start(a)
a<-table.element(a,'beta',header=TRUE)
a<-table.element(a,fit$beta)
a<-table.row.end(a)
a<-table.row.start(a)
a<-table.element(a,'gamma',header=TRUE)
a<-table.element(a,fit$gamma)
a<-table.row.end(a)
a<-table.end(a)
table.save(a,file='mytable.tab')
a<-table.start()
a<-table.row.start(a)
a<-table.element(a,'Interpolation Forecasts of Exponential Smoothing',4,TRUE)
a<-table.row.end(a)
a<-table.row.start(a)
a<-table.element(a,'t',header=TRUE)
a<-table.element(a,'Observed',header=TRUE)
a<-table.element(a,'Fitted',header=TRUE)
a<-table.element(a,'Residuals',header=TRUE)
a<-table.row.end(a)
for (i in 1:nxmK) {
a<-table.row.start(a)
a<-table.element(a,i+K,header=TRUE)
a<-table.element(a,x[i+K])
a<-table.element(a,fit$fitted[i,'xhat'])
a<-table.element(a,myresid[i])
a<-table.row.end(a)
}
a<-table.end(a)
table.save(a,file='mytable1.tab')
a<-table.start()
a<-table.row.start(a)
a<-table.element(a,'Extrapolation Forecasts of Exponential Smoothing',4,TRUE)
a<-table.row.end(a)
a<-table.row.start(a)
a<-table.element(a,'t',header=TRUE)
a<-table.element(a,'Forecast',header=TRUE)
a<-table.element(a,'95% Lower Bound',header=TRUE)
a<-table.element(a,'95% Upper Bound',header=TRUE)
a<-table.row.end(a)
for (i in 1:np) {
a<-table.row.start(a)
a<-table.element(a,nx+i,header=TRUE)
a<-table.element(a,p[i,'fit'])
a<-table.element(a,p[i,'lwr'])
a<-table.element(a,p[i,'upr'])
a<-table.row.end(a)
}
a<-table.end(a)
table.save(a,file='mytable2.tab')