Free Statistics

of Irreproducible Research!

Author's title

Author*The author of this computation has been verified*
R Software Modulerwasp_correlation.wasp
Title produced by softwarePearson Correlation
Date of computationFri, 23 Dec 2011 10:23:48 -0500
Cite this page as followsStatistical Computations at FreeStatistics.org, Office for Research Development and Education, URL https://freestatistics.org/blog/index.php?v=date/2011/Dec/23/t1324653924e7v75wrp9xaudi8.htm/, Retrieved Mon, 29 Apr 2024 19:50:51 +0000
Statistical Computations at FreeStatistics.org, Office for Research Development and Education, URL https://freestatistics.org/blog/index.php?pk=160498, Retrieved Mon, 29 Apr 2024 19:50:51 +0000
QR Codes:

Original text written by user:
IsPrivate?No (this computation is public)
User-defined keywords
Estimated Impact79
Family? (F = Feedback message, R = changed R code, M = changed R Module, P = changed Parameters, D = changed Data)
-       [Pearson Correlation] [paper-correlation] [2011-12-23 15:23:48] [fe2dc4bc83c881ccd49ef12feaba2b65] [Current]
- R  D    [Pearson Correlation] [paper-correlation] [2011-12-23 16:06:41] [c2267e575f67090c7e8d960bdccd246a]
Feedback Forum

Post a new message
Dataseries X:
539
548
563
581
572
519
521
531
540
548
556
551
549
564
586
604
601
545
537
552
563
575
580
575
558
564
581
597
587
536
524
537
536
533
528
516
502
506
518
534
528
478
469
490
493
508
517
514
510
527
542
565
555
499
511
526
532
549
561
557
566
588
620
626
620
573
573
574
580
590
Dataseries Y:
21.925
23.118
22.849
20.198
18.130
25.597
28.785
28.229
33.474
28.287
27.297
16.167
22.380
24.256
19.573
21.553
21.359
29.586
27.186
32.066
34.670
25.985
27.561
14.538
18.730
22.485
20.036
16.971
19.028
22.759
20.516
26.195
27.786
24.090
25.447
11.509
15.572
22.518
20.520
17.789
20.205
26.835
25.826
31.934
30.019
30.111
31.566
12.738
19.814
24.776
20.424
18.688
20.418
25.778
25.100
25.859
30.651
26.551
31.124
9.367
17.382
20.995
18.205
17.328
18.157
23.691
26.736
27.165
34.506
29.506


Summary of computational transaction
Raw Inputview raw input (R code)
Raw Outputview raw output of R engine
Computing time0 seconds
R Server'Gwilym Jenkins' @ jenkins.wessa.net

\begin{tabular}{lllllllll}
\hline
Summary of computational transaction \tabularnewline
Raw Input & view raw input (R code)  \tabularnewline
Raw Output & view raw output of R engine  \tabularnewline
Computing time & 0 seconds \tabularnewline
R Server & 'Gwilym Jenkins' @ jenkins.wessa.net \tabularnewline
\hline
\end{tabular}
%Source: https://freestatistics.org/blog/index.php?pk=160498&T=0

[TABLE]
[ROW][C]Summary of computational transaction[/C][/ROW]
[ROW][C]Raw Input[/C][C]view raw input (R code) [/C][/ROW]
[ROW][C]Raw Output[/C][C]view raw output of R engine [/C][/ROW]
[ROW][C]Computing time[/C][C]0 seconds[/C][/ROW]
[ROW][C]R Server[/C][C]'Gwilym Jenkins' @ jenkins.wessa.net[/C][/ROW]
[/TABLE]
Source: https://freestatistics.org/blog/index.php?pk=160498&T=0

Globally Unique Identifier (entire table): ba.freestatistics.org/blog/index.php?pk=160498&T=0

As an alternative you can also use a QR Code:  

The GUIDs for individual cells are displayed in the table below:

Summary of computational transaction
Raw Inputview raw input (R code)
Raw Outputview raw output of R engine
Computing time0 seconds
R Server'Gwilym Jenkins' @ jenkins.wessa.net


Pearson Product Moment Correlation - Ungrouped Data
StatisticVariable XVariable Y
Mean548.54285714285723.5453571428571
Biased Variance1131.1338775510230.3732053153061
Biased Standard Deviation33.63233381065045.51118910175528
Covariance-43.0257329192547
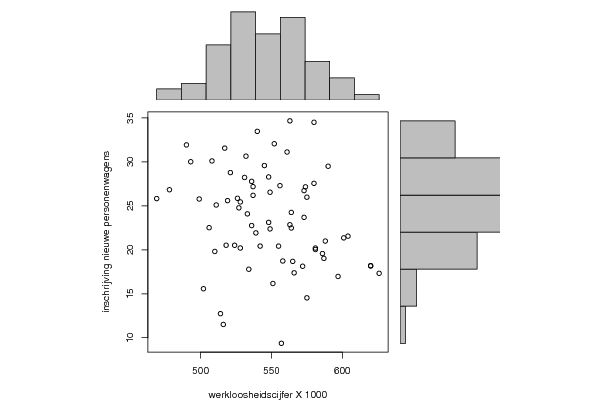
Correlation-0.228811058365891
Determination0.052354500430519
T-Test-1.93824429375667
p-value (2 sided)0.056746185121248
p-value (1 sided)0.028373092560624
Degrees of Freedom68
Number of Observations70

\begin{tabular}{lllllllll}
\hline
Pearson Product Moment Correlation - Ungrouped Data \tabularnewline
Statistic & Variable X & Variable Y \tabularnewline
Mean & 548.542857142857 & 23.5453571428571 \tabularnewline
Biased Variance & 1131.13387755102 & 30.3732053153061 \tabularnewline
Biased Standard Deviation & 33.6323338106504 & 5.51118910175528 \tabularnewline
Covariance & -43.0257329192547 \tabularnewline
Correlation & -0.228811058365891 \tabularnewline
Determination & 0.052354500430519 \tabularnewline
T-Test & -1.93824429375667 \tabularnewline
p-value (2 sided) & 0.056746185121248 \tabularnewline
p-value (1 sided) & 0.028373092560624 \tabularnewline
Degrees of Freedom & 68 \tabularnewline
Number of Observations & 70 \tabularnewline
\hline
\end{tabular}
%Source: https://freestatistics.org/blog/index.php?pk=160498&T=1

[TABLE]
[ROW][C]Pearson Product Moment Correlation - Ungrouped Data[/C][/ROW]
[ROW][C]Statistic[/C][C]Variable X[/C][C]Variable Y[/C][/ROW]
[ROW][C]Mean[/C][C]548.542857142857[/C][C]23.5453571428571[/C][/ROW]
[ROW][C]Biased Variance[/C][C]1131.13387755102[/C][C]30.3732053153061[/C][/ROW]
[ROW][C]Biased Standard Deviation[/C][C]33.6323338106504[/C][C]5.51118910175528[/C][/ROW]
[ROW][C]Covariance[/C][C]-43.0257329192547[/C][/ROW]
[ROW][C]Correlation[/C][C]-0.228811058365891[/C][/ROW]
[ROW][C]Determination[/C][C]0.052354500430519[/C][/ROW]
[ROW][C]T-Test[/C][C]-1.93824429375667[/C][/ROW]
[ROW][C]p-value (2 sided)[/C][C]0.056746185121248[/C][/ROW]
[ROW][C]p-value (1 sided)[/C][C]0.028373092560624[/C][/ROW]
[ROW][C]Degrees of Freedom[/C][C]68[/C][/ROW]
[ROW][C]Number of Observations[/C][C]70[/C][/ROW]
[/TABLE]
Source: https://freestatistics.org/blog/index.php?pk=160498&T=1

Globally Unique Identifier (entire table): ba.freestatistics.org/blog/index.php?pk=160498&T=1

As an alternative you can also use a QR Code:  

The GUIDs for individual cells are displayed in the table below:

Pearson Product Moment Correlation - Ungrouped Data
StatisticVariable XVariable Y
Mean548.54285714285723.5453571428571
Biased Variance1131.1338775510230.3732053153061
Biased Standard Deviation33.63233381065045.51118910175528
Covariance-43.0257329192547
Correlation-0.228811058365891
Determination0.052354500430519
T-Test-1.93824429375667
p-value (2 sided)0.056746185121248
p-value (1 sided)0.028373092560624
Degrees of Freedom68
Number of Observations70


Parameters (Session):
Parameters (R input):
R code (references can be found in the software module):
bitmap(file='test1.png')
histx <- hist(x, plot=FALSE)
histy <- hist(y, plot=FALSE)
maxcounts <- max(c(histx$counts, histx$counts))
xrange <- c(min(x),max(x))
yrange <- c(min(y),max(y))
nf <- layout(matrix(c(2,0,1,3),2,2,byrow=TRUE), c(3,1), c(1,3), TRUE)
par(mar=c(4,4,1,1))
plot(x, y, xlim=xrange, ylim=yrange, xlab=xlab, ylab=ylab)
par(mar=c(0,4,1,1))
barplot(histx$counts, axes=FALSE, ylim=c(0, maxcounts), space=0)
par(mar=c(4,0,1,1))
barplot(histy$counts, axes=FALSE, xlim=c(0, maxcounts), space=0, horiz=TRUE)
dev.off()
lx = length(x)
makebiased = (lx-1)/lx
varx = var(x)*makebiased
vary = var(y)*makebiased
corxy <- cor.test(x,y,method='pearson')
cxy <- as.matrix(corxy$estimate)[1,1]
load(file='createtable')
a<-table.start()
a<-table.row.start(a)
a<-table.element(a,'Pearson Product Moment Correlation - Ungrouped Data',3,TRUE)
a<-table.row.end(a)
a<-table.row.start(a)
a<-table.element(a,'Statistic',1,TRUE)
a<-table.element(a,'Variable X',1,TRUE)
a<-table.element(a,'Variable Y',1,TRUE)
a<-table.row.end(a)
a<-table.row.start(a)
a<-table.element(a,hyperlink('arithmetic_mean.htm','Mean',''),header=TRUE)
a<-table.element(a,mean(x))
a<-table.element(a,mean(y))
a<-table.row.end(a)
a<-table.row.start(a)
a<-table.element(a,hyperlink('biased.htm','Biased Variance',''),header=TRUE)
a<-table.element(a,varx)
a<-table.element(a,vary)
a<-table.row.end(a)
a<-table.row.start(a)
a<-table.element(a,hyperlink('biased1.htm','Biased Standard Deviation',''),header=TRUE)
a<-table.element(a,sqrt(varx))
a<-table.element(a,sqrt(vary))
a<-table.row.end(a)
a<-table.row.start(a)
a<-table.element(a,hyperlink('covariance.htm','Covariance',''),header=TRUE)
a<-table.element(a,cov(x,y),2)
a<-table.row.end(a)
a<-table.row.start(a)
a<-table.element(a,hyperlink('pearson_correlation.htm','Correlation',''),header=TRUE)
a<-table.element(a,cxy,2)
a<-table.row.end(a)
a<-table.row.start(a)
a<-table.element(a,hyperlink('coeff_of_determination.htm','Determination',''),header=TRUE)
a<-table.element(a,cxy*cxy,2)
a<-table.row.end(a)
a<-table.row.start(a)
a<-table.element(a,hyperlink('ttest_statistic.htm','T-Test',''),header=TRUE)
a<-table.element(a,as.matrix(corxy$statistic)[1,1],2)
a<-table.row.end(a)
a<-table.row.start(a)
a<-table.element(a,'p-value (2 sided)',header=TRUE)
a<-table.element(a,(p2 <- as.matrix(corxy$p.value)[1,1]),2)
a<-table.row.end(a)
a<-table.row.start(a)
a<-table.element(a,'p-value (1 sided)',header=TRUE)
a<-table.element(a,p2/2,2)
a<-table.row.end(a)
a<-table.row.start(a)
a<-table.element(a,'Degrees of Freedom',header=TRUE)
a<-table.element(a,lx-2,2)
a<-table.row.end(a)
a<-table.row.start(a)
a<-table.element(a,'Number of Observations',header=TRUE)
a<-table.element(a,lx,2)
a<-table.row.end(a)
a<-table.end(a)
table.save(a,file='mytable.tab')