Free Statistics

of Irreproducible Research!

Author's title

Author*The author of this computation has been verified*
R Software Modulerwasp_exponentialsmoothing.wasp
Title produced by softwareExponential Smoothing
Date of computationFri, 23 Dec 2011 08:53:45 -0500
Cite this page as followsStatistical Computations at FreeStatistics.org, Office for Research Development and Education, URL https://freestatistics.org/blog/index.php?v=date/2011/Dec/23/t1324648461pkgn3aytj63s0yk.htm/, Retrieved Mon, 29 Apr 2024 19:37:59 +0000
Statistical Computations at FreeStatistics.org, Office for Research Development and Education, URL https://freestatistics.org/blog/index.php?pk=160414, Retrieved Mon, 29 Apr 2024 19:37:59 +0000
QR Codes:

Original text written by user:
IsPrivate?No (this computation is public)
User-defined keywords
Estimated Impact116
Family? (F = Feedback message, R = changed R code, M = changed R Module, P = changed Parameters, D = changed Data)
-     [Univariate Data Series] [data set] [2008-12-01 19:54:57] [b98453cac15ba1066b407e146608df68]
- RMP   [Structural Time Series Models] [Unemployment] [2010-11-30 13:26:46] [b98453cac15ba1066b407e146608df68]
- RMPD      [Exponential Smoothing] [paper- exponentia...] [2011-12-23 13:53:45] [fe2dc4bc83c881ccd49ef12feaba2b65] [Current]
- R PD        [Exponential Smoothing] [paper- exponentia...] [2011-12-23 16:24:12] [c2267e575f67090c7e8d960bdccd246a]
Feedback Forum

Post a new message
Dataseries X:
539
548
563
581
572
519
521
531
540
548
556
551
549
564
586
604
601
545
537
552
563
575
580
575
558
564
581
597
587
536
524
537
536
533
528
516
502
506
518
534
528
478
469
490
493
508
517
514
510
527
542
565
555
499
511
526
532
549
561
557
566
588
620
626
620
573
573
574
580
590


Summary of computational transaction
Raw Inputview raw input (R code)
Raw Outputview raw output of R engine
Computing time2 seconds
R Server'AstonUniversity' @ aston.wessa.net

\begin{tabular}{lllllllll}
\hline
Summary of computational transaction \tabularnewline
Raw Input & view raw input (R code)  \tabularnewline
Raw Output & view raw output of R engine  \tabularnewline
Computing time & 2 seconds \tabularnewline
R Server & 'AstonUniversity' @ aston.wessa.net \tabularnewline
\hline
\end{tabular}
%Source: https://freestatistics.org/blog/index.php?pk=160414&T=0

[TABLE]
[ROW][C]Summary of computational transaction[/C][/ROW]
[ROW][C]Raw Input[/C][C]view raw input (R code) [/C][/ROW]
[ROW][C]Raw Output[/C][C]view raw output of R engine [/C][/ROW]
[ROW][C]Computing time[/C][C]2 seconds[/C][/ROW]
[ROW][C]R Server[/C][C]'AstonUniversity' @ aston.wessa.net[/C][/ROW]
[/TABLE]
Source: https://freestatistics.org/blog/index.php?pk=160414&T=0

Globally Unique Identifier (entire table): ba.freestatistics.org/blog/index.php?pk=160414&T=0

As an alternative you can also use a QR Code:  

The GUIDs for individual cells are displayed in the table below:

Summary of computational transaction
Raw Inputview raw input (R code)
Raw Outputview raw output of R engine
Computing time2 seconds
R Server'AstonUniversity' @ aston.wessa.net


Estimated Parameters of Exponential Smoothing
ParameterValue
alpha0.917141973012215
beta0.25253006546771
gamma0.36015515776819

\begin{tabular}{lllllllll}
\hline
Estimated Parameters of Exponential Smoothing \tabularnewline
Parameter & Value \tabularnewline
alpha & 0.917141973012215 \tabularnewline
beta & 0.25253006546771 \tabularnewline
gamma & 0.36015515776819 \tabularnewline
\hline
\end{tabular}
%Source: https://freestatistics.org/blog/index.php?pk=160414&T=1

[TABLE]
[ROW][C]Estimated Parameters of Exponential Smoothing[/C][/ROW]
[ROW][C]Parameter[/C][C]Value[/C][/ROW]
[ROW][C]alpha[/C][C]0.917141973012215[/C][/ROW]
[ROW][C]beta[/C][C]0.25253006546771[/C][/ROW]
[ROW][C]gamma[/C][C]0.36015515776819[/C][/ROW]
[/TABLE]
Source: https://freestatistics.org/blog/index.php?pk=160414&T=1

Globally Unique Identifier (entire table): ba.freestatistics.org/blog/index.php?pk=160414&T=1

As an alternative you can also use a QR Code:  

The GUIDs for individual cells are displayed in the table below:

Estimated Parameters of Exponential Smoothing
ParameterValue
alpha0.917141973012215
beta0.25253006546771
gamma0.36015515776819


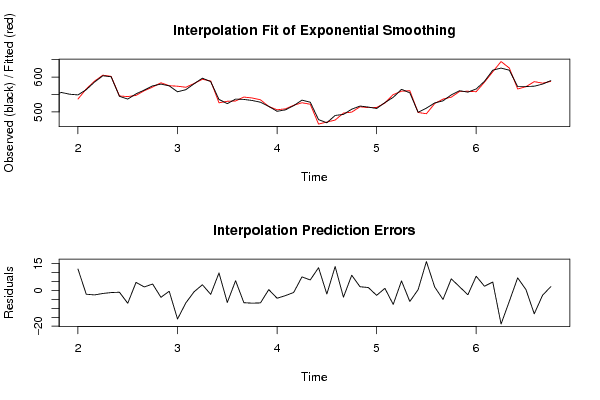
Interpolation Forecasts of Exponential Smoothing
tObservedFittedResiduals
13549537.04754273504311.952457264957
14564566.131632467948-2.13163246794772
15586588.513246984324-2.51324698432404
16604605.712783923977-1.71278392397653
17601602.208101566718-1.2081015667178
18545546.011481104521-1.01148110452073
19537544.177591173333-7.17759117333276
20552547.5261302628834.47386973711718
21563561.0552212612071.94477873879282
22575571.4235323585673.57646764143283
23580583.866664922779-3.86666492277902
24575575.462845705266-0.462845705266204
25558573.971963011982-15.9719630119815
26564570.989173961783-6.98917396178285
27581581.743382816719-0.743382816719418
28597593.8389722809733.16102771902683
29587589.197079989091-2.19707998909064
30536526.2479923797629.7520076202377
31524530.743328956824-6.74332895682403
32537531.5800125000325.41998749996776
33536542.862646209819-6.86264620981899
34533540.123429768485-7.12342976848515
35528534.974400741587-6.9744007415868
36516515.545431950480.454568049520162
37502506.369116720427-4.36911672042692
38506508.919122974785-2.91912297478513
39518519.158455504085-1.1584555040854
40534526.4596692892147.5403307107863
41528522.1583872824465.84161271755443
42478465.28437562414712.7156243758527
43469471.03778289842-2.03778289841978
44490476.67519019040813.324809809592
45493496.79403201508-3.79403201507955
46508499.524996453628.47500354637953
47517514.9626903961682.03730960383245
48514512.3838960741221.61610392587818
49510512.761408827507-2.76140882750656
50527525.8340183378871.16598166211281
51542549.823484135129-7.82348413512864
52565559.6788182239635.32118177603729
53555561.184911683817-6.18491168381684
54499498.5939307472280.40606925277217
55511494.87442358127116.1255764187292
56526524.0923609117491.9076390882509
57532537.04860002358-5.04860002358032
58549542.5239314373766.47606856262428
59561559.0020955116671.99790448833278
60557559.431354466081-2.43135446608142
61566558.0854881614337.91451183856714
62588585.6585867980692.341413201931
63620615.3220197442154.6779802557852
64626644.794835421667-18.7948354216671
65620626.013947054919-6.01394705491896
66573565.9902394368177.00976056318257
67573572.5395944067550.460405593245468
68574587.081153769079-13.0811537690786
69580582.726558092455-2.72655809245532
70590587.856849103032.14315089697004

\begin{tabular}{lllllllll}
\hline
Interpolation Forecasts of Exponential Smoothing \tabularnewline
t & Observed & Fitted & Residuals \tabularnewline
13 & 549 & 537.047542735043 & 11.952457264957 \tabularnewline
14 & 564 & 566.131632467948 & -2.13163246794772 \tabularnewline
15 & 586 & 588.513246984324 & -2.51324698432404 \tabularnewline
16 & 604 & 605.712783923977 & -1.71278392397653 \tabularnewline
17 & 601 & 602.208101566718 & -1.2081015667178 \tabularnewline
18 & 545 & 546.011481104521 & -1.01148110452073 \tabularnewline
19 & 537 & 544.177591173333 & -7.17759117333276 \tabularnewline
20 & 552 & 547.526130262883 & 4.47386973711718 \tabularnewline
21 & 563 & 561.055221261207 & 1.94477873879282 \tabularnewline
22 & 575 & 571.423532358567 & 3.57646764143283 \tabularnewline
23 & 580 & 583.866664922779 & -3.86666492277902 \tabularnewline
24 & 575 & 575.462845705266 & -0.462845705266204 \tabularnewline
25 & 558 & 573.971963011982 & -15.9719630119815 \tabularnewline
26 & 564 & 570.989173961783 & -6.98917396178285 \tabularnewline
27 & 581 & 581.743382816719 & -0.743382816719418 \tabularnewline
28 & 597 & 593.838972280973 & 3.16102771902683 \tabularnewline
29 & 587 & 589.197079989091 & -2.19707998909064 \tabularnewline
30 & 536 & 526.247992379762 & 9.7520076202377 \tabularnewline
31 & 524 & 530.743328956824 & -6.74332895682403 \tabularnewline
32 & 537 & 531.580012500032 & 5.41998749996776 \tabularnewline
33 & 536 & 542.862646209819 & -6.86264620981899 \tabularnewline
34 & 533 & 540.123429768485 & -7.12342976848515 \tabularnewline
35 & 528 & 534.974400741587 & -6.9744007415868 \tabularnewline
36 & 516 & 515.54543195048 & 0.454568049520162 \tabularnewline
37 & 502 & 506.369116720427 & -4.36911672042692 \tabularnewline
38 & 506 & 508.919122974785 & -2.91912297478513 \tabularnewline
39 & 518 & 519.158455504085 & -1.1584555040854 \tabularnewline
40 & 534 & 526.459669289214 & 7.5403307107863 \tabularnewline
41 & 528 & 522.158387282446 & 5.84161271755443 \tabularnewline
42 & 478 & 465.284375624147 & 12.7156243758527 \tabularnewline
43 & 469 & 471.03778289842 & -2.03778289841978 \tabularnewline
44 & 490 & 476.675190190408 & 13.324809809592 \tabularnewline
45 & 493 & 496.79403201508 & -3.79403201507955 \tabularnewline
46 & 508 & 499.52499645362 & 8.47500354637953 \tabularnewline
47 & 517 & 514.962690396168 & 2.03730960383245 \tabularnewline
48 & 514 & 512.383896074122 & 1.61610392587818 \tabularnewline
49 & 510 & 512.761408827507 & -2.76140882750656 \tabularnewline
50 & 527 & 525.834018337887 & 1.16598166211281 \tabularnewline
51 & 542 & 549.823484135129 & -7.82348413512864 \tabularnewline
52 & 565 & 559.678818223963 & 5.32118177603729 \tabularnewline
53 & 555 & 561.184911683817 & -6.18491168381684 \tabularnewline
54 & 499 & 498.593930747228 & 0.40606925277217 \tabularnewline
55 & 511 & 494.874423581271 & 16.1255764187292 \tabularnewline
56 & 526 & 524.092360911749 & 1.9076390882509 \tabularnewline
57 & 532 & 537.04860002358 & -5.04860002358032 \tabularnewline
58 & 549 & 542.523931437376 & 6.47606856262428 \tabularnewline
59 & 561 & 559.002095511667 & 1.99790448833278 \tabularnewline
60 & 557 & 559.431354466081 & -2.43135446608142 \tabularnewline
61 & 566 & 558.085488161433 & 7.91451183856714 \tabularnewline
62 & 588 & 585.658586798069 & 2.341413201931 \tabularnewline
63 & 620 & 615.322019744215 & 4.6779802557852 \tabularnewline
64 & 626 & 644.794835421667 & -18.7948354216671 \tabularnewline
65 & 620 & 626.013947054919 & -6.01394705491896 \tabularnewline
66 & 573 & 565.990239436817 & 7.00976056318257 \tabularnewline
67 & 573 & 572.539594406755 & 0.460405593245468 \tabularnewline
68 & 574 & 587.081153769079 & -13.0811537690786 \tabularnewline
69 & 580 & 582.726558092455 & -2.72655809245532 \tabularnewline
70 & 590 & 587.85684910303 & 2.14315089697004 \tabularnewline
\hline
\end{tabular}
%Source: https://freestatistics.org/blog/index.php?pk=160414&T=2

[TABLE]
[ROW][C]Interpolation Forecasts of Exponential Smoothing[/C][/ROW]
[ROW][C]t[/C][C]Observed[/C][C]Fitted[/C][C]Residuals[/C][/ROW]
[ROW][C]13[/C][C]549[/C][C]537.047542735043[/C][C]11.952457264957[/C][/ROW]
[ROW][C]14[/C][C]564[/C][C]566.131632467948[/C][C]-2.13163246794772[/C][/ROW]
[ROW][C]15[/C][C]586[/C][C]588.513246984324[/C][C]-2.51324698432404[/C][/ROW]
[ROW][C]16[/C][C]604[/C][C]605.712783923977[/C][C]-1.71278392397653[/C][/ROW]
[ROW][C]17[/C][C]601[/C][C]602.208101566718[/C][C]-1.2081015667178[/C][/ROW]
[ROW][C]18[/C][C]545[/C][C]546.011481104521[/C][C]-1.01148110452073[/C][/ROW]
[ROW][C]19[/C][C]537[/C][C]544.177591173333[/C][C]-7.17759117333276[/C][/ROW]
[ROW][C]20[/C][C]552[/C][C]547.526130262883[/C][C]4.47386973711718[/C][/ROW]
[ROW][C]21[/C][C]563[/C][C]561.055221261207[/C][C]1.94477873879282[/C][/ROW]
[ROW][C]22[/C][C]575[/C][C]571.423532358567[/C][C]3.57646764143283[/C][/ROW]
[ROW][C]23[/C][C]580[/C][C]583.866664922779[/C][C]-3.86666492277902[/C][/ROW]
[ROW][C]24[/C][C]575[/C][C]575.462845705266[/C][C]-0.462845705266204[/C][/ROW]
[ROW][C]25[/C][C]558[/C][C]573.971963011982[/C][C]-15.9719630119815[/C][/ROW]
[ROW][C]26[/C][C]564[/C][C]570.989173961783[/C][C]-6.98917396178285[/C][/ROW]
[ROW][C]27[/C][C]581[/C][C]581.743382816719[/C][C]-0.743382816719418[/C][/ROW]
[ROW][C]28[/C][C]597[/C][C]593.838972280973[/C][C]3.16102771902683[/C][/ROW]
[ROW][C]29[/C][C]587[/C][C]589.197079989091[/C][C]-2.19707998909064[/C][/ROW]
[ROW][C]30[/C][C]536[/C][C]526.247992379762[/C][C]9.7520076202377[/C][/ROW]
[ROW][C]31[/C][C]524[/C][C]530.743328956824[/C][C]-6.74332895682403[/C][/ROW]
[ROW][C]32[/C][C]537[/C][C]531.580012500032[/C][C]5.41998749996776[/C][/ROW]
[ROW][C]33[/C][C]536[/C][C]542.862646209819[/C][C]-6.86264620981899[/C][/ROW]
[ROW][C]34[/C][C]533[/C][C]540.123429768485[/C][C]-7.12342976848515[/C][/ROW]
[ROW][C]35[/C][C]528[/C][C]534.974400741587[/C][C]-6.9744007415868[/C][/ROW]
[ROW][C]36[/C][C]516[/C][C]515.54543195048[/C][C]0.454568049520162[/C][/ROW]
[ROW][C]37[/C][C]502[/C][C]506.369116720427[/C][C]-4.36911672042692[/C][/ROW]
[ROW][C]38[/C][C]506[/C][C]508.919122974785[/C][C]-2.91912297478513[/C][/ROW]
[ROW][C]39[/C][C]518[/C][C]519.158455504085[/C][C]-1.1584555040854[/C][/ROW]
[ROW][C]40[/C][C]534[/C][C]526.459669289214[/C][C]7.5403307107863[/C][/ROW]
[ROW][C]41[/C][C]528[/C][C]522.158387282446[/C][C]5.84161271755443[/C][/ROW]
[ROW][C]42[/C][C]478[/C][C]465.284375624147[/C][C]12.7156243758527[/C][/ROW]
[ROW][C]43[/C][C]469[/C][C]471.03778289842[/C][C]-2.03778289841978[/C][/ROW]
[ROW][C]44[/C][C]490[/C][C]476.675190190408[/C][C]13.324809809592[/C][/ROW]
[ROW][C]45[/C][C]493[/C][C]496.79403201508[/C][C]-3.79403201507955[/C][/ROW]
[ROW][C]46[/C][C]508[/C][C]499.52499645362[/C][C]8.47500354637953[/C][/ROW]
[ROW][C]47[/C][C]517[/C][C]514.962690396168[/C][C]2.03730960383245[/C][/ROW]
[ROW][C]48[/C][C]514[/C][C]512.383896074122[/C][C]1.61610392587818[/C][/ROW]
[ROW][C]49[/C][C]510[/C][C]512.761408827507[/C][C]-2.76140882750656[/C][/ROW]
[ROW][C]50[/C][C]527[/C][C]525.834018337887[/C][C]1.16598166211281[/C][/ROW]
[ROW][C]51[/C][C]542[/C][C]549.823484135129[/C][C]-7.82348413512864[/C][/ROW]
[ROW][C]52[/C][C]565[/C][C]559.678818223963[/C][C]5.32118177603729[/C][/ROW]
[ROW][C]53[/C][C]555[/C][C]561.184911683817[/C][C]-6.18491168381684[/C][/ROW]
[ROW][C]54[/C][C]499[/C][C]498.593930747228[/C][C]0.40606925277217[/C][/ROW]
[ROW][C]55[/C][C]511[/C][C]494.874423581271[/C][C]16.1255764187292[/C][/ROW]
[ROW][C]56[/C][C]526[/C][C]524.092360911749[/C][C]1.9076390882509[/C][/ROW]
[ROW][C]57[/C][C]532[/C][C]537.04860002358[/C][C]-5.04860002358032[/C][/ROW]
[ROW][C]58[/C][C]549[/C][C]542.523931437376[/C][C]6.47606856262428[/C][/ROW]
[ROW][C]59[/C][C]561[/C][C]559.002095511667[/C][C]1.99790448833278[/C][/ROW]
[ROW][C]60[/C][C]557[/C][C]559.431354466081[/C][C]-2.43135446608142[/C][/ROW]
[ROW][C]61[/C][C]566[/C][C]558.085488161433[/C][C]7.91451183856714[/C][/ROW]
[ROW][C]62[/C][C]588[/C][C]585.658586798069[/C][C]2.341413201931[/C][/ROW]
[ROW][C]63[/C][C]620[/C][C]615.322019744215[/C][C]4.6779802557852[/C][/ROW]
[ROW][C]64[/C][C]626[/C][C]644.794835421667[/C][C]-18.7948354216671[/C][/ROW]
[ROW][C]65[/C][C]620[/C][C]626.013947054919[/C][C]-6.01394705491896[/C][/ROW]
[ROW][C]66[/C][C]573[/C][C]565.990239436817[/C][C]7.00976056318257[/C][/ROW]
[ROW][C]67[/C][C]573[/C][C]572.539594406755[/C][C]0.460405593245468[/C][/ROW]
[ROW][C]68[/C][C]574[/C][C]587.081153769079[/C][C]-13.0811537690786[/C][/ROW]
[ROW][C]69[/C][C]580[/C][C]582.726558092455[/C][C]-2.72655809245532[/C][/ROW]
[ROW][C]70[/C][C]590[/C][C]587.85684910303[/C][C]2.14315089697004[/C][/ROW]
[/TABLE]
Source: https://freestatistics.org/blog/index.php?pk=160414&T=2

Globally Unique Identifier (entire table): ba.freestatistics.org/blog/index.php?pk=160414&T=2

As an alternative you can also use a QR Code:  

The GUIDs for individual cells are displayed in the table below:

Interpolation Forecasts of Exponential Smoothing
tObservedFittedResiduals
13549537.04754273504311.952457264957
14564566.131632467948-2.13163246794772
15586588.513246984324-2.51324698432404
16604605.712783923977-1.71278392397653
17601602.208101566718-1.2081015667178
18545546.011481104521-1.01148110452073
19537544.177591173333-7.17759117333276
20552547.5261302628834.47386973711718
21563561.0552212612071.94477873879282
22575571.4235323585673.57646764143283
23580583.866664922779-3.86666492277902
24575575.462845705266-0.462845705266204
25558573.971963011982-15.9719630119815
26564570.989173961783-6.98917396178285
27581581.743382816719-0.743382816719418
28597593.8389722809733.16102771902683
29587589.197079989091-2.19707998909064
30536526.2479923797629.7520076202377
31524530.743328956824-6.74332895682403
32537531.5800125000325.41998749996776
33536542.862646209819-6.86264620981899
34533540.123429768485-7.12342976848515
35528534.974400741587-6.9744007415868
36516515.545431950480.454568049520162
37502506.369116720427-4.36911672042692
38506508.919122974785-2.91912297478513
39518519.158455504085-1.1584555040854
40534526.4596692892147.5403307107863
41528522.1583872824465.84161271755443
42478465.28437562414712.7156243758527
43469471.03778289842-2.03778289841978
44490476.67519019040813.324809809592
45493496.79403201508-3.79403201507955
46508499.524996453628.47500354637953
47517514.9626903961682.03730960383245
48514512.3838960741221.61610392587818
49510512.761408827507-2.76140882750656
50527525.8340183378871.16598166211281
51542549.823484135129-7.82348413512864
52565559.6788182239635.32118177603729
53555561.184911683817-6.18491168381684
54499498.5939307472280.40606925277217
55511494.87442358127116.1255764187292
56526524.0923609117491.9076390882509
57532537.04860002358-5.04860002358032
58549542.5239314373766.47606856262428
59561559.0020955116671.99790448833278
60557559.431354466081-2.43135446608142
61566558.0854881614337.91451183856714
62588585.6585867980692.341413201931
63620615.3220197442154.6779802557852
64626644.794835421667-18.7948354216671
65620626.013947054919-6.01394705491896
66573565.9902394368177.00976056318257
67573572.5395944067550.460405593245468
68574587.081153769079-13.0811537690786
69580582.726558092455-2.72655809245532
70590587.856849103032.14315089697004


Extrapolation Forecasts of Exponential Smoothing
tForecast95% Lower Bound95% Upper Bound
71596.405348142127583.055558640251609.755137644003
72590.585213555897570.253077749558610.917349362235
73588.056244632929560.616018139047615.496471126811
74602.649514895775567.777645116264637.521384675285
75624.138195215724581.456124817154666.820265614295
76641.43964957835590.555260064335692.324039092366
77637.450173394939577.972843583943696.927503205935
78581.896100692465513.442658846092650.349542538837
79578.762905257643500.959926618451656.565883896834
80589.313310306217501.797816327129676.828804285304
81597.129868456804499.549297256157694.710439657452
82605.402487394045497.414332372933713.390642415157

\begin{tabular}{lllllllll}
\hline
Extrapolation Forecasts of Exponential Smoothing \tabularnewline
t & Forecast & 95% Lower Bound & 95% Upper Bound \tabularnewline
71 & 596.405348142127 & 583.055558640251 & 609.755137644003 \tabularnewline
72 & 590.585213555897 & 570.253077749558 & 610.917349362235 \tabularnewline
73 & 588.056244632929 & 560.616018139047 & 615.496471126811 \tabularnewline
74 & 602.649514895775 & 567.777645116264 & 637.521384675285 \tabularnewline
75 & 624.138195215724 & 581.456124817154 & 666.820265614295 \tabularnewline
76 & 641.43964957835 & 590.555260064335 & 692.324039092366 \tabularnewline
77 & 637.450173394939 & 577.972843583943 & 696.927503205935 \tabularnewline
78 & 581.896100692465 & 513.442658846092 & 650.349542538837 \tabularnewline
79 & 578.762905257643 & 500.959926618451 & 656.565883896834 \tabularnewline
80 & 589.313310306217 & 501.797816327129 & 676.828804285304 \tabularnewline
81 & 597.129868456804 & 499.549297256157 & 694.710439657452 \tabularnewline
82 & 605.402487394045 & 497.414332372933 & 713.390642415157 \tabularnewline
\hline
\end{tabular}
%Source: https://freestatistics.org/blog/index.php?pk=160414&T=3

[TABLE]
[ROW][C]Extrapolation Forecasts of Exponential Smoothing[/C][/ROW]
[ROW][C]t[/C][C]Forecast[/C][C]95% Lower Bound[/C][C]95% Upper Bound[/C][/ROW]
[ROW][C]71[/C][C]596.405348142127[/C][C]583.055558640251[/C][C]609.755137644003[/C][/ROW]
[ROW][C]72[/C][C]590.585213555897[/C][C]570.253077749558[/C][C]610.917349362235[/C][/ROW]
[ROW][C]73[/C][C]588.056244632929[/C][C]560.616018139047[/C][C]615.496471126811[/C][/ROW]
[ROW][C]74[/C][C]602.649514895775[/C][C]567.777645116264[/C][C]637.521384675285[/C][/ROW]
[ROW][C]75[/C][C]624.138195215724[/C][C]581.456124817154[/C][C]666.820265614295[/C][/ROW]
[ROW][C]76[/C][C]641.43964957835[/C][C]590.555260064335[/C][C]692.324039092366[/C][/ROW]
[ROW][C]77[/C][C]637.450173394939[/C][C]577.972843583943[/C][C]696.927503205935[/C][/ROW]
[ROW][C]78[/C][C]581.896100692465[/C][C]513.442658846092[/C][C]650.349542538837[/C][/ROW]
[ROW][C]79[/C][C]578.762905257643[/C][C]500.959926618451[/C][C]656.565883896834[/C][/ROW]
[ROW][C]80[/C][C]589.313310306217[/C][C]501.797816327129[/C][C]676.828804285304[/C][/ROW]
[ROW][C]81[/C][C]597.129868456804[/C][C]499.549297256157[/C][C]694.710439657452[/C][/ROW]
[ROW][C]82[/C][C]605.402487394045[/C][C]497.414332372933[/C][C]713.390642415157[/C][/ROW]
[/TABLE]
Source: https://freestatistics.org/blog/index.php?pk=160414&T=3

Globally Unique Identifier (entire table): ba.freestatistics.org/blog/index.php?pk=160414&T=3

As an alternative you can also use a QR Code:  

The GUIDs for individual cells are displayed in the table below:

Extrapolation Forecasts of Exponential Smoothing
tForecast95% Lower Bound95% Upper Bound
71596.405348142127583.055558640251609.755137644003
72590.585213555897570.253077749558610.917349362235
73588.056244632929560.616018139047615.496471126811
74602.649514895775567.777645116264637.521384675285
75624.138195215724581.456124817154666.820265614295
76641.43964957835590.555260064335692.324039092366
77637.450173394939577.972843583943696.927503205935
78581.896100692465513.442658846092650.349542538837
79578.762905257643500.959926618451656.565883896834
80589.313310306217501.797816327129676.828804285304
81597.129868456804499.549297256157694.710439657452
82605.402487394045497.414332372933713.390642415157


Parameters (Session):
par1 = 12 ; par2 = Triple ; par3 = additive ;
Parameters (R input):
par1 = 12 ; par2 = Triple ; par3 = additive ;
R code (references can be found in the software module):
par1 <- as.numeric(par1)
if (par2 == 'Single') K <- 1
if (par2 == 'Double') K <- 2
if (par2 == 'Triple') K <- par1
nx <- length(x)
nxmK <- nx - K
x <- ts(x, frequency = par1)
if (par2 == 'Single') fit <- HoltWinters(x, gamma=F, beta=F)
if (par2 == 'Double') fit <- HoltWinters(x, gamma=F)
if (par2 == 'Triple') fit <- HoltWinters(x, seasonal=par3)
fit
myresid <- x - fit$fitted[,'xhat']
bitmap(file='test1.png')
op <- par(mfrow=c(2,1))
plot(fit,ylab='Observed (black) / Fitted (red)',main='Interpolation Fit of Exponential Smoothing')
plot(myresid,ylab='Residuals',main='Interpolation Prediction Errors')
par(op)
dev.off()
bitmap(file='test2.png')
p <- predict(fit, par1, prediction.interval=TRUE)
np <- length(p[,1])
plot(fit,p,ylab='Observed (black) / Fitted (red)',main='Extrapolation Fit of Exponential Smoothing')
dev.off()
bitmap(file='test3.png')
op <- par(mfrow = c(2,2))
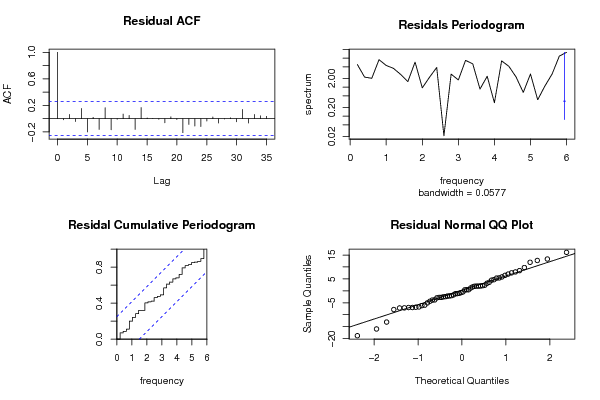
acf(as.numeric(myresid),lag.max = nx/2,main='Residual ACF')
spectrum(myresid,main='Residals Periodogram')
cpgram(myresid,main='Residal Cumulative Periodogram')
qqnorm(myresid,main='Residual Normal QQ Plot')
qqline(myresid)
par(op)
dev.off()
load(file='createtable')
a<-table.start()
a<-table.row.start(a)
a<-table.element(a,'Estimated Parameters of Exponential Smoothing',2,TRUE)
a<-table.row.end(a)
a<-table.row.start(a)
a<-table.element(a,'Parameter',header=TRUE)
a<-table.element(a,'Value',header=TRUE)
a<-table.row.end(a)
a<-table.row.start(a)
a<-table.element(a,'alpha',header=TRUE)
a<-table.element(a,fit$alpha)
a<-table.row.end(a)
a<-table.row.start(a)
a<-table.element(a,'beta',header=TRUE)
a<-table.element(a,fit$beta)
a<-table.row.end(a)
a<-table.row.start(a)
a<-table.element(a,'gamma',header=TRUE)
a<-table.element(a,fit$gamma)
a<-table.row.end(a)
a<-table.end(a)
table.save(a,file='mytable.tab')
a<-table.start()
a<-table.row.start(a)
a<-table.element(a,'Interpolation Forecasts of Exponential Smoothing',4,TRUE)
a<-table.row.end(a)
a<-table.row.start(a)
a<-table.element(a,'t',header=TRUE)
a<-table.element(a,'Observed',header=TRUE)
a<-table.element(a,'Fitted',header=TRUE)
a<-table.element(a,'Residuals',header=TRUE)
a<-table.row.end(a)
for (i in 1:nxmK) {
a<-table.row.start(a)
a<-table.element(a,i+K,header=TRUE)
a<-table.element(a,x[i+K])
a<-table.element(a,fit$fitted[i,'xhat'])
a<-table.element(a,myresid[i])
a<-table.row.end(a)
}
a<-table.end(a)
table.save(a,file='mytable1.tab')
a<-table.start()
a<-table.row.start(a)
a<-table.element(a,'Extrapolation Forecasts of Exponential Smoothing',4,TRUE)
a<-table.row.end(a)
a<-table.row.start(a)
a<-table.element(a,'t',header=TRUE)
a<-table.element(a,'Forecast',header=TRUE)
a<-table.element(a,'95% Lower Bound',header=TRUE)
a<-table.element(a,'95% Upper Bound',header=TRUE)
a<-table.row.end(a)
for (i in 1:np) {
a<-table.row.start(a)
a<-table.element(a,nx+i,header=TRUE)
a<-table.element(a,p[i,'fit'])
a<-table.element(a,p[i,'lwr'])
a<-table.element(a,p[i,'upr'])
a<-table.row.end(a)
}
a<-table.end(a)
table.save(a,file='mytable2.tab')