Free Statistics

of Irreproducible Research!

Author's title

Author*The author of this computation has been verified*
R Software Modulerwasp_regression_trees1.wasp
Title produced by softwareRecursive Partitioning (Regression Trees)
Date of computationFri, 23 Dec 2011 07:32:48 -0500
Cite this page as followsStatistical Computations at FreeStatistics.org, Office for Research Development and Education, URL https://freestatistics.org/blog/index.php?v=date/2011/Dec/23/t1324643585j72onpwcq206e6g.htm/, Retrieved Mon, 29 Apr 2024 19:47:12 +0000
Statistical Computations at FreeStatistics.org, Office for Research Development and Education, URL https://freestatistics.org/blog/index.php?pk=160350, Retrieved Mon, 29 Apr 2024 19:47:12 +0000
QR Codes:

Original text written by user:
IsPrivate?No (this computation is public)
User-defined keywords
Estimated Impact84
Family? (F = Feedback message, R = changed R code, M = changed R Module, P = changed Parameters, D = changed Data)
-     [Kendall tau Correlation Matrix] [] [2010-12-05 17:44:33] [b98453cac15ba1066b407e146608df68]
- RMPD  [Recursive Partitioning (Regression Trees)] [] [2011-12-15 20:23:50] [2d3d135c7070430a7cc2b1c9a86f42b1]
- R PD    [Recursive Partitioning (Regression Trees)] [] [2011-12-22 22:28:33] [2d3d135c7070430a7cc2b1c9a86f42b1]
-   P         [Recursive Partitioning (Regression Trees)] [] [2011-12-23 12:32:48] [a478c561bf1feb1bdaba97497ca665e7] [Current]
Feedback Forum

Post a new message
Dataseries X:
129988	81	505	20	18158
130358	47	329	38	30461
7215	18	72	0	1423
112976	87	588	49	25629
220191	127	1103	76	48758
402111	219	1620	104	129230
129230	52	479	39	27376
136284	51	338	57	26706
99738	39	407	42	26505
269166	88	859	67	49801
113066	69	568	50	46580
165392	62	595	66	48352
78240	90	534	38	13899
170854	86	886	55	39342
134368	47	359	42	27465
125769	68	419	47	55211
123467	50	364	71	74098
62020	51	298	0	13497
108458	79	683	50	38338
22762	21	188	12	52505
48633	50	291	16	10663
182081	83	640	77	74484
149507	62	543	32	28895
93773	46	532	38	32827
133428	79	549	50	36188
126660	24	447	33	28173
153851	141	561	49	54926
140711	75	266	59	38900
303952	108	786	55	88530
164481	39	761	45	35482
134521	41	411	47	26730
157753	40	484	51	29806
103274	90	593	45	41799
193525	106	761	73	54289
182027	44	690	51	36805
0	1	0	0	0
181496	56	859	46	33146
92526	48	475	44	23333
115762	42	453	33	47686
179089	51	630	71	77783
146707	60	553	61	36042
120318	51	565	31	34541
86039	26	310	21	75620
125540	67	649	42	60610
95535	42	321	44	55041
129236	79	263	40	32087
61554	26	180	15	16356
170811	83	587	46	40161
161746	76	548	43	55459
144425	53	852	61	36679
48188	28	205	12	22346
97793	57	325	46	27377
249356	65	734	60	50273
196791	69	619	49	32104
161082	51	546	50	27016
111388	47	443	35	19715
172614	58	429	45	33629
68627	20	220	25	27084
109111	57	310	47	32352
142391	76	809	30	51845
125777	51	438	48	26591
90434	67	611	32	29677
95845	50	318	28	54237
89751	30	336	36	20284
101723	25	285	13	22741
94982	37	391	38	34178
145568	62	453	49	69551
113325	63	715	68	29653
92480	34	238	36	38071
31970	15	101	5	4157
196420	104	887	53	28321
98324	56	321	36	40195
80820	56	360	54	48158
91934	62	435	37	13310
118147	55	568	52	78474
59924	33	296	0	6386
120602	53	508	53	31588
118781	80	690	51	61254
60138	23	253	16	21152
73422	66	366	33	41272
70248	60	201	48	34165
225857	54	652	35	37054
51185	24	221	24	12368
97181	32	438	37	23168
45100	40	247	17	16380
115801	43	388	32	41242
191221	194	559	55	48450
71960	86	233	39	20790
81701	49	341	35	34585
111142	44	442	26	35672
98707	34	452	37	52168
136234	67	584	66	53933
136781	53	366	35	34474
116132	54	433	24	43753
49164	33	291	22	36456
189493	93	632	42	51183
169406	50	491	86	52742
19349	12	67	13	3895
160902	88	617	21	37076
110736	54	607	32	24079
43803	25	240	8	2325
47062	19	219	38	29354
110845	44	349	45	30341
92517	52	241	24	18992
58660	36	136	23	15292
27676	22	194	2	5842
106245	34	237	65	28918
43863	25	158	5	3738
0	0	0	0	0
75566	28	281	43	95352
59683	50	248	18	37478
104330	36	358	44	26839
72600	49	303	45	26783
65494	56	267	29	33392
3616	5	14	0	0
0	0	0	0	0
148117	38	290	32	25446
117946	66	476	65	59847
138702	86	524	26	28162
84336	33	243	24	33298
43410	19	292	7	2781
142723	63	450	63	37121
79015	34	217	30	22698
106116	47	466	54	27615
57626	39	160	3	32689
19764	12	75	10	5752
112195	43	442	46	23164
103651	25	332	23	20304
113402	35	417	40	34409
11796	9	79	1	0
7627	9	25	0	0
121085	50	431	29	92538
6836	3	11	0	0
139563	46	564	46	46037
5118	3	6	5	0
40248	16	183	8	5444
0	0	0	0	0
95079	42	295	21	23924
82961	33	232	21	52230
7131	4	27	0	0
4194	11	14	0	0
60378	20	240	15	8019
109214	45	252	47	34542
83484	17	347	17	21157


Summary of computational transaction
Raw Inputview raw input (R code)
Raw Outputview raw output of R engine
Computing time3 seconds
R Server'Gwilym Jenkins' @ jenkins.wessa.net

\begin{tabular}{lllllllll}
\hline
Summary of computational transaction \tabularnewline
Raw Input & view raw input (R code)  \tabularnewline
Raw Output & view raw output of R engine  \tabularnewline
Computing time & 3 seconds \tabularnewline
R Server & 'Gwilym Jenkins' @ jenkins.wessa.net \tabularnewline
\hline
\end{tabular}
%Source: https://freestatistics.org/blog/index.php?pk=160350&T=0

[TABLE]
[ROW][C]Summary of computational transaction[/C][/ROW]
[ROW][C]Raw Input[/C][C]view raw input (R code) [/C][/ROW]
[ROW][C]Raw Output[/C][C]view raw output of R engine [/C][/ROW]
[ROW][C]Computing time[/C][C]3 seconds[/C][/ROW]
[ROW][C]R Server[/C][C]'Gwilym Jenkins' @ jenkins.wessa.net[/C][/ROW]
[/TABLE]
Source: https://freestatistics.org/blog/index.php?pk=160350&T=0

Globally Unique Identifier (entire table): ba.freestatistics.org/blog/index.php?pk=160350&T=0

As an alternative you can also use a QR Code:  

The GUIDs for individual cells are displayed in the table below:

Summary of computational transaction
Raw Inputview raw input (R code)
Raw Outputview raw output of R engine
Computing time3 seconds
R Server'Gwilym Jenkins' @ jenkins.wessa.net


10-Fold Cross Validation
Prediction (training)Prediction (testing)
ActualC1C2CVC1C2CV
C1119730.997513910.9929
C28640.04441000
Overall--0.931--0.9267

\begin{tabular}{lllllllll}
\hline
10-Fold Cross Validation \tabularnewline
 & Prediction (training) & Prediction (testing) \tabularnewline
Actual & C1 & C2 & CV & C1 & C2 & CV \tabularnewline
C1 & 1197 & 3 & 0.9975 & 139 & 1 & 0.9929 \tabularnewline
C2 & 86 & 4 & 0.0444 & 10 & 0 & 0 \tabularnewline
Overall & - & - & 0.931 & - & - & 0.9267 \tabularnewline
\hline
\end{tabular}
%Source: https://freestatistics.org/blog/index.php?pk=160350&T=1

[TABLE]
[ROW][C]10-Fold Cross Validation[/C][/ROW]
[ROW][C][/C][C]Prediction (training)[/C][C]Prediction (testing)[/C][/ROW]
[ROW][C]Actual[/C][C]C1[/C][C]C2[/C][C]CV[/C][C]C1[/C][C]C2[/C][C]CV[/C][/ROW]
[ROW][C]C1[/C][C]1197[/C][C]3[/C][C]0.9975[/C][C]139[/C][C]1[/C][C]0.9929[/C][/ROW]
[ROW][C]C2[/C][C]86[/C][C]4[/C][C]0.0444[/C][C]10[/C][C]0[/C][C]0[/C][/ROW]
[ROW][C]Overall[/C][C]-[/C][C]-[/C][C]0.931[/C][C]-[/C][C]-[/C][C]0.9267[/C][/ROW]
[/TABLE]
Source: https://freestatistics.org/blog/index.php?pk=160350&T=1

Globally Unique Identifier (entire table): ba.freestatistics.org/blog/index.php?pk=160350&T=1

As an alternative you can also use a QR Code:  

The GUIDs for individual cells are displayed in the table below:

10-Fold Cross Validation
Prediction (training)Prediction (testing)
ActualC1C2CVC1C2CV
C1119730.997513910.9929
C28640.04441000
Overall--0.931--0.9267


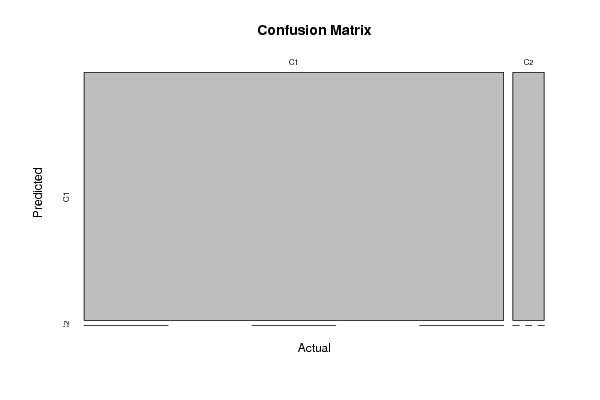
Confusion Matrix (predicted in columns / actuals in rows)
C1C2
C11340
C2100

\begin{tabular}{lllllllll}
\hline
Confusion Matrix (predicted in columns / actuals in rows) \tabularnewline
 & C1 & C2 \tabularnewline
C1 & 134 & 0 \tabularnewline
C2 & 10 & 0 \tabularnewline
\hline
\end{tabular}
%Source: https://freestatistics.org/blog/index.php?pk=160350&T=2

[TABLE]
[ROW][C]Confusion Matrix (predicted in columns / actuals in rows)[/C][/ROW]
[ROW][C][/C][C]C1[/C][C]C2[/C][/ROW]
[ROW][C]C1[/C][C]134[/C][C]0[/C][/ROW]
[ROW][C]C2[/C][C]10[/C][C]0[/C][/ROW]
[/TABLE]
Source: https://freestatistics.org/blog/index.php?pk=160350&T=2

Globally Unique Identifier (entire table): ba.freestatistics.org/blog/index.php?pk=160350&T=2

As an alternative you can also use a QR Code:  

The GUIDs for individual cells are displayed in the table below:

Confusion Matrix (predicted in columns / actuals in rows)
C1C2
C11340
C2100


Parameters (Session):
par1 = 5 ; par2 = equal ; par3 = 2 ; par4 = yes ;
Parameters (R input):
par1 = 5 ; par2 = equal ; par3 = 2 ; par4 = yes ;
R code (references can be found in the software module):
library(party)
library(Hmisc)
par1 <- as.numeric(par1)
par3 <- as.numeric(par3)
x <- data.frame(t(y))
is.data.frame(x)
x <- x[!is.na(x[,par1]),]
k <- length(x[1,])
n <- length(x[,1])
colnames(x)[par1]
x[,par1]
if (par2 == 'kmeans') {
cl <- kmeans(x[,par1], par3)
print(cl)
clm <- matrix(cbind(cl$centers,1:par3),ncol=2)
clm <- clm[sort.list(clm[,1]),]
for (i in 1:par3) {
cl$cluster[cl$cluster==clm[i,2]] <- paste('C',i,sep='')
}
cl$cluster <- as.factor(cl$cluster)
print(cl$cluster)
x[,par1] <- cl$cluster
}
if (par2 == 'quantiles') {
x[,par1] <- cut2(x[,par1],g=par3)
}
if (par2 == 'hclust') {
hc <- hclust(dist(x[,par1])^2, 'cen')
print(hc)
memb <- cutree(hc, k = par3)
dum <- c(mean(x[memb==1,par1]))
for (i in 2:par3) {
dum <- c(dum, mean(x[memb==i,par1]))
}
hcm <- matrix(cbind(dum,1:par3),ncol=2)
hcm <- hcm[sort.list(hcm[,1]),]
for (i in 1:par3) {
memb[memb==hcm[i,2]] <- paste('C',i,sep='')
}
memb <- as.factor(memb)
print(memb)
x[,par1] <- memb
}
if (par2=='equal') {
ed <- cut(as.numeric(x[,par1]),par3,labels=paste('C',1:par3,sep=''))
x[,par1] <- as.factor(ed)
}
table(x[,par1])
colnames(x)
colnames(x)[par1]
x[,par1]
if (par2 == 'none') {
m <- ctree(as.formula(paste(colnames(x)[par1],' ~ .',sep='')),data = x)
}
load(file='createtable')
if (par2 != 'none') {
m <- ctree(as.formula(paste('as.factor(',colnames(x)[par1],') ~ .',sep='')),data = x)
if (par4=='yes') {
a<-table.start()
a<-table.row.start(a)
a<-table.element(a,'10-Fold Cross Validation',3+2*par3,TRUE)
a<-table.row.end(a)
a<-table.row.start(a)
a<-table.element(a,'',1,TRUE)
a<-table.element(a,'Prediction (training)',par3+1,TRUE)
a<-table.element(a,'Prediction (testing)',par3+1,TRUE)
a<-table.row.end(a)
a<-table.row.start(a)
a<-table.element(a,'Actual',1,TRUE)
for (jjj in 1:par3) a<-table.element(a,paste('C',jjj,sep=''),1,TRUE)
a<-table.element(a,'CV',1,TRUE)
for (jjj in 1:par3) a<-table.element(a,paste('C',jjj,sep=''),1,TRUE)
a<-table.element(a,'CV',1,TRUE)
a<-table.row.end(a)
for (i in 1:10) {
ind <- sample(2, nrow(x), replace=T, prob=c(0.9,0.1))
m.ct <- ctree(as.formula(paste('as.factor(',colnames(x)[par1],') ~ .',sep='')),data =x[ind==1,])
if (i==1) {
m.ct.i.pred <- predict(m.ct, newdata=x[ind==1,])
m.ct.i.actu <- x[ind==1,par1]
m.ct.x.pred <- predict(m.ct, newdata=x[ind==2,])
m.ct.x.actu <- x[ind==2,par1]
} else {
m.ct.i.pred <- c(m.ct.i.pred,predict(m.ct, newdata=x[ind==1,]))
m.ct.i.actu <- c(m.ct.i.actu,x[ind==1,par1])
m.ct.x.pred <- c(m.ct.x.pred,predict(m.ct, newdata=x[ind==2,]))
m.ct.x.actu <- c(m.ct.x.actu,x[ind==2,par1])
}
}
print(m.ct.i.tab <- table(m.ct.i.actu,m.ct.i.pred))
numer <- 0
for (i in 1:par3) {
print(m.ct.i.tab[i,i] / sum(m.ct.i.tab[i,]))
numer <- numer + m.ct.i.tab[i,i]
}
print(m.ct.i.cp <- numer / sum(m.ct.i.tab))
print(m.ct.x.tab <- table(m.ct.x.actu,m.ct.x.pred))
numer <- 0
for (i in 1:par3) {
print(m.ct.x.tab[i,i] / sum(m.ct.x.tab[i,]))
numer <- numer + m.ct.x.tab[i,i]
}
print(m.ct.x.cp <- numer / sum(m.ct.x.tab))
for (i in 1:par3) {
a<-table.row.start(a)
a<-table.element(a,paste('C',i,sep=''),1,TRUE)
for (jjj in 1:par3) a<-table.element(a,m.ct.i.tab[i,jjj])
a<-table.element(a,round(m.ct.i.tab[i,i]/sum(m.ct.i.tab[i,]),4))
for (jjj in 1:par3) a<-table.element(a,m.ct.x.tab[i,jjj])
a<-table.element(a,round(m.ct.x.tab[i,i]/sum(m.ct.x.tab[i,]),4))
a<-table.row.end(a)
}
a<-table.row.start(a)
a<-table.element(a,'Overall',1,TRUE)
for (jjj in 1:par3) a<-table.element(a,'-')
a<-table.element(a,round(m.ct.i.cp,4))
for (jjj in 1:par3) a<-table.element(a,'-')
a<-table.element(a,round(m.ct.x.cp,4))
a<-table.row.end(a)
a<-table.end(a)
table.save(a,file='mytable3.tab')
}
}
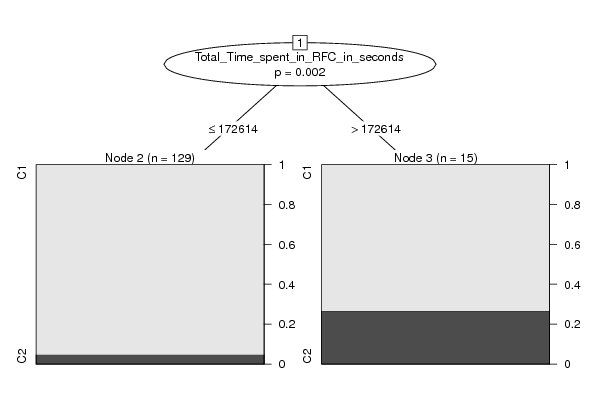
m
bitmap(file='test1.png')
plot(m)
dev.off()
bitmap(file='test1a.png')
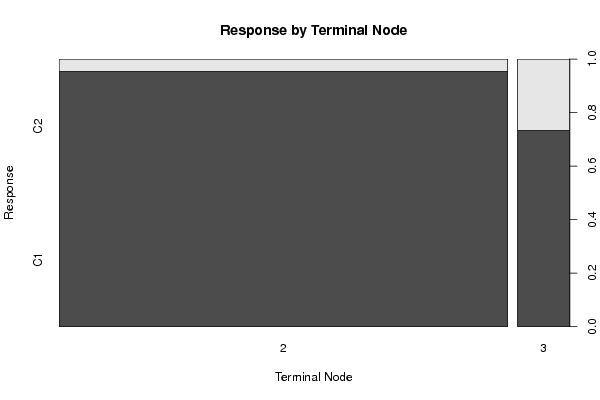
plot(x[,par1] ~ as.factor(where(m)),main='Response by Terminal Node',xlab='Terminal Node',ylab='Response')
dev.off()
if (par2 == 'none') {
forec <- predict(m)
result <- as.data.frame(cbind(x[,par1],forec,x[,par1]-forec))
colnames(result) <- c('Actuals','Forecasts','Residuals')
print(result)
}
if (par2 != 'none') {
print(cbind(as.factor(x[,par1]),predict(m)))
myt <- table(as.factor(x[,par1]),predict(m))
print(myt)
}
bitmap(file='test2.png')
if(par2=='none') {
op <- par(mfrow=c(2,2))
plot(density(result$Actuals),main='Kernel Density Plot of Actuals')
plot(density(result$Residuals),main='Kernel Density Plot of Residuals')
plot(result$Forecasts,result$Actuals,main='Actuals versus Predictions',xlab='Predictions',ylab='Actuals')
plot(density(result$Forecasts),main='Kernel Density Plot of Predictions')
par(op)
}
if(par2!='none') {
plot(myt,main='Confusion Matrix',xlab='Actual',ylab='Predicted')
}
dev.off()
if (par2 == 'none') {
detcoef <- cor(result$Forecasts,result$Actuals)
a<-table.start()
a<-table.row.start(a)
a<-table.element(a,'Goodness of Fit',2,TRUE)
a<-table.row.end(a)
a<-table.row.start(a)
a<-table.element(a,'Correlation',1,TRUE)
a<-table.element(a,round(detcoef,4))
a<-table.row.end(a)
a<-table.row.start(a)
a<-table.element(a,'R-squared',1,TRUE)
a<-table.element(a,round(detcoef*detcoef,4))
a<-table.row.end(a)
a<-table.row.start(a)
a<-table.element(a,'RMSE',1,TRUE)
a<-table.element(a,round(sqrt(mean((result$Residuals)^2)),4))
a<-table.row.end(a)
a<-table.end(a)
table.save(a,file='mytable1.tab')
a<-table.start()
a<-table.row.start(a)
a<-table.element(a,'Actuals, Predictions, and Residuals',4,TRUE)
a<-table.row.end(a)
a<-table.row.start(a)
a<-table.element(a,'#',header=TRUE)
a<-table.element(a,'Actuals',header=TRUE)
a<-table.element(a,'Forecasts',header=TRUE)
a<-table.element(a,'Residuals',header=TRUE)
a<-table.row.end(a)
for (i in 1:length(result$Actuals)) {
a<-table.row.start(a)
a<-table.element(a,i,header=TRUE)
a<-table.element(a,result$Actuals[i])
a<-table.element(a,result$Forecasts[i])
a<-table.element(a,result$Residuals[i])
a<-table.row.end(a)
}
a<-table.end(a)
table.save(a,file='mytable.tab')
}
if (par2 != 'none') {
a<-table.start()
a<-table.row.start(a)
a<-table.element(a,'Confusion Matrix (predicted in columns / actuals in rows)',par3+1,TRUE)
a<-table.row.end(a)
a<-table.row.start(a)
a<-table.element(a,'',1,TRUE)
for (i in 1:par3) {
a<-table.element(a,paste('C',i,sep=''),1,TRUE)
}
a<-table.row.end(a)
for (i in 1:par3) {
a<-table.row.start(a)
a<-table.element(a,paste('C',i,sep=''),1,TRUE)
for (j in 1:par3) {
a<-table.element(a,myt[i,j])
}
a<-table.row.end(a)
}
a<-table.end(a)
table.save(a,file='mytable2.tab')
}