| Multiple Linear Regression - Estimated Regression Equation |
| Y[t] = + 36729.7493441208 + 1330.07988868374X1[t] + 516.08581468945X2[t] -96.4629479367715X3[t] -0.291806273737337X4[t] -1337.00889635934X5[t] + 2108.20663205954X6[t] + e[t] |
| Multiple Linear Regression - Ordinary Least Squares | |||||
| Variable | Parameter | S.D. | T-STAT H0: parameter = 0 | 2-tail p-value | 1-tail p-value |
| (Intercept) | 36729.7493441208 | 25085.888556 | 1.4642 | 0.150776 | 0.075388 |
| X1 | 1330.07988868374 | 431.682973 | 3.0811 | 0.003676 | 0.001838 |
| X2 | 516.08581468945 | 1914.126112 | 0.2696 | 0.788805 | 0.394403 |
| X3 | -96.4629479367715 | 552.242343 | -0.1747 | 0.862195 | 0.431097 |
| X4 | -0.291806273737337 | 0.443026 | -0.6587 | 0.513792 | 0.256896 |
| X5 | -1337.00889635934 | 2698.846809 | -0.4954 | 0.622963 | 0.311481 |
| X6 | 2108.20663205954 | 2846.915971 | 0.7405 | 0.463203 | 0.231601 |
| Multiple Linear Regression - Regression Statistics | |
| Multiple R | 0.829001263952081 |
| R-squared | 0.687243095634148 |
| Adjusted R-squared | 0.641473792556218 |
| F-TEST (value) | 15.0153716447027 |
| F-TEST (DF numerator) | 6 |
| F-TEST (DF denominator) | 41 |
| p-value | 5.34461952472753e-09 |
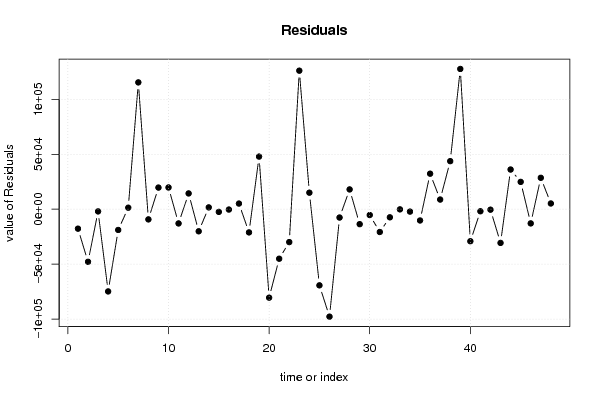
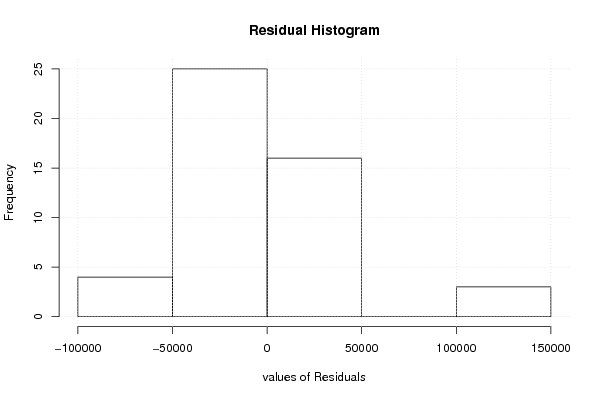
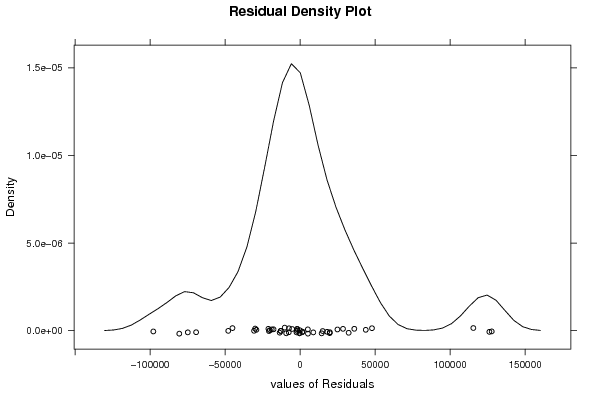
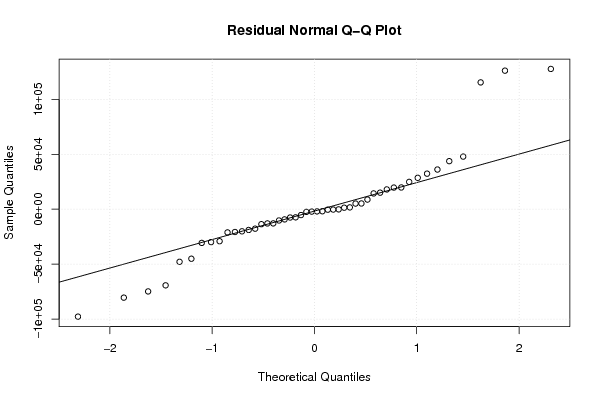
| Multiple Linear Regression - Residual Statistics | |
| Residual Standard Deviation | 47254.460923351 |
| Sum Squared Residuals | 91552347163.4166 |
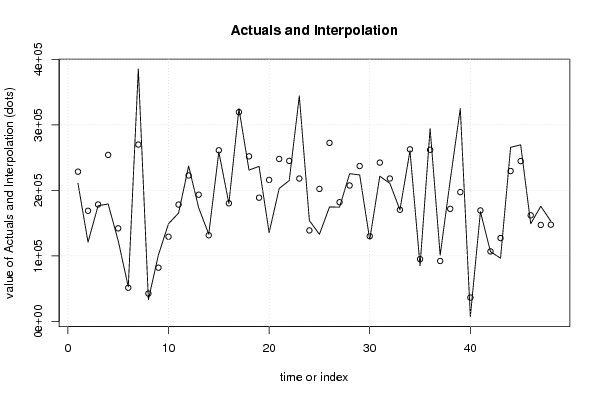
| Multiple Linear Regression - Actuals, Interpolation, and Residuals | |||
| Time or Index | Actuals | Interpolation Forecast | Residuals Prediction Error |
| 1 | 210907 | 228616.331011055 | -17709.3310110555 |
| 2 | 120982 | 168864.968849503 | -47882.9688495031 |
| 3 | 176508 | 178496.314671976 | -1988.31467197596 |
| 4 | 179321 | 254183.590290207 | -74862.5902902075 |
| 5 | 123185 | 142078.816246832 | -18893.8162468316 |
| 6 | 52746 | 51374.1822546183 | 1371.81774538165 |
| 7 | 385534 | 270045.798225954 | 115488.201774046 |
| 8 | 33170 | 42427.9520359793 | -9257.95203597928 |
| 9 | 101645 | 81934.6761255301 | 19710.3238744699 |
| 10 | 149061 | 129250.669334983 | 19810.3306650166 |
| 11 | 165446 | 178388.987791434 | -12942.9877914343 |
| 12 | 237213 | 222836.393059412 | 14376.6069405875 |
| 13 | 173326 | 193430.465488554 | -20104.465488554 |
| 14 | 133131 | 131461.67773649 | 1669.32226351018 |
| 15 | 258873 | 261292.924302849 | -2419.92430284865 |
| 16 | 180083 | 180384.676601757 | -301.676601756683 |
| 17 | 324799 | 319642.731223412 | 5156.26877658792 |
| 18 | 230964 | 252079.202099863 | -21115.2020998631 |
| 19 | 236785 | 188861.893208211 | 47923.106791789 |
| 20 | 135473 | 215998.730977932 | -80525.7309779319 |
| 21 | 202925 | 248010.607998206 | -45085.6079982057 |
| 22 | 215147 | 245085.266721991 | -29938.2667219912 |
| 23 | 344297 | 218123.178775171 | 126173.821224829 |
| 24 | 153935 | 138877.039666488 | 15057.9603335121 |
| 25 | 132943 | 202261.526341077 | -69318.526341077 |
| 26 | 174724 | 272558.119371602 | -97834.1193716018 |
| 27 | 174415 | 181979.210418988 | -7564.21041898792 |
| 28 | 225548 | 207525.687595715 | 18022.312404285 |
| 29 | 223632 | 237246.833749966 | -13614.8337499658 |
| 30 | 124817 | 130120.065994461 | -5303.06599446053 |
| 31 | 221698 | 242447.335022218 | -20749.3350222179 |
| 32 | 210767 | 218157.783544963 | -7390.78354496344 |
| 33 | 170266 | 170399.950227366 | -133.950227366105 |
| 34 | 260561 | 262719.134897056 | -2158.13489705637 |
| 35 | 84853 | 95104.8953952407 | -10251.8953952408 |
| 36 | 294424 | 262054.055357938 | 32369.9446420624 |
| 37 | 101011 | 92201.408512452 | 8809.59148754803 |
| 38 | 215641 | 171875.647829257 | 43765.352170743 |
| 39 | 325107 | 197367.94000722 | 127739.05999278 |
| 40 | 7176 | 36314.5090165926 | -29138.5090165926 |
| 41 | 167542 | 169390.994651203 | -1848.9946512033 |
| 42 | 106408 | 106827.934372354 | -419.934372354244 |
| 43 | 96560 | 127236.888004007 | -30676.8880040071 |
| 44 | 265769 | 229622.764795683 | 36146.2352043167 |
| 45 | 269651 | 244748.129449053 | 24902.8705509471 |
| 46 | 149112 | 162023.818344044 | -12911.8183440442 |
| 47 | 175824 | 147211.264141165 | 28612.7358588353 |
| 48 | 152871 | 147633.02826197 | 5237.97173803033 |
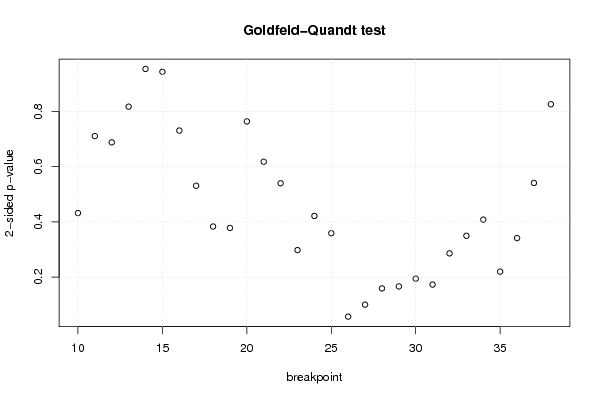
| Goldfeld-Quandt test for Heteroskedasticity | |||
| p-values | Alternative Hypothesis | ||
| breakpoint index | greater | 2-sided | less |
| 10 | 0.784015967596678 | 0.431968064806644 | 0.215984032403322 |
| 11 | 0.644704952176712 | 0.710590095646575 | 0.355295047823288 |
| 12 | 0.65610536928974 | 0.687789261420521 | 0.34389463071026 |
| 13 | 0.591551977539039 | 0.816896044921922 | 0.408448022460961 |
| 14 | 0.523283095819588 | 0.953433808360823 | 0.476716904180412 |
| 15 | 0.471559171483888 | 0.943118342967777 | 0.528440828516112 |
| 16 | 0.365252356042626 | 0.730504712085253 | 0.634747643957374 |
| 17 | 0.265300972481464 | 0.530601944962927 | 0.734699027518536 |
| 18 | 0.191614466271645 | 0.383228932543289 | 0.808385533728355 |
| 19 | 0.189052574958478 | 0.378105149916957 | 0.810947425041522 |
| 20 | 0.381763904167822 | 0.763527808335645 | 0.618236095832178 |
| 21 | 0.308839910164223 | 0.617679820328447 | 0.691160089835777 |
| 22 | 0.269857016266879 | 0.539714032533757 | 0.730142983733121 |
| 23 | 0.851115907586377 | 0.297768184827246 | 0.148884092413623 |
| 24 | 0.789316436444108 | 0.421367127111783 | 0.210683563555892 |
| 25 | 0.820517558389522 | 0.358964883220956 | 0.179482441610478 |
| 26 | 0.971505382475113 | 0.0569892350497742 | 0.0284946175248871 |
| 27 | 0.949737605353739 | 0.100524789292523 | 0.0502623946462613 |
| 28 | 0.92035855155431 | 0.159282896891379 | 0.0796414484456897 |
| 29 | 0.916798132408991 | 0.166403735182017 | 0.0832018675910087 |
| 30 | 0.902709934658893 | 0.194580130682214 | 0.0972900653411071 |
| 31 | 0.913438457981938 | 0.173123084036123 | 0.0865615420180617 |
| 32 | 0.856930833805443 | 0.286138332389114 | 0.143069166194557 |
| 33 | 0.825157208206986 | 0.349685583586028 | 0.174842791793014 |
| 34 | 0.795903898627743 | 0.408192202744515 | 0.204096101372257 |
| 35 | 0.890049771706734 | 0.219900456586533 | 0.109950228293266 |
| 36 | 0.829420897464929 | 0.341158205070141 | 0.170579102535071 |
| 37 | 0.729543882897841 | 0.540912234204317 | 0.270456117102159 |
| 38 | 0.587164352327937 | 0.825671295344126 | 0.412835647672063 |
| Meta Analysis of Goldfeld-Quandt test for Heteroskedasticity | |||
| Description | # significant tests | % significant tests | OK/NOK |
| 1% type I error level | 0 | 0 | OK |
| 5% type I error level | 0 | 0 | OK |
| 10% type I error level | 1 | 0.0344827586206897 | OK |