Free Statistics

of Irreproducible Research!

Author's title

Author*The author of this computation has been verified*
R Software Modulerwasp_autocorrelation.wasp
Title produced by software(Partial) Autocorrelation Function
Date of computationFri, 23 Dec 2011 06:34:41 -0500
Cite this page as followsStatistical Computations at FreeStatistics.org, Office for Research Development and Education, URL https://freestatistics.org/blog/index.php?v=date/2011/Dec/23/t1324640107pi1bkanoa47vmuk.htm/, Retrieved Mon, 29 Apr 2024 22:36:52 +0000
Statistical Computations at FreeStatistics.org, Office for Research Development and Education, URL https://freestatistics.org/blog/index.php?pk=160296, Retrieved Mon, 29 Apr 2024 22:36:52 +0000
QR Codes:

Original text written by user:
IsPrivate?No (this computation is public)
User-defined keywords
Estimated Impact90
Family? (F = Feedback message, R = changed R code, M = changed R Module, P = changed Parameters, D = changed Data)
-     [Univariate Data Series] [data set] [2008-12-01 19:54:57] [b98453cac15ba1066b407e146608df68]
- RMPD  [Exponential Smoothing] [Workshop_8: Niet-...] [2011-11-28 23:01:38] [f722e8e78b9e5c5ebaa2263f273aa636]
- R P     [Exponential Smoothing] [Workshop_8: Niet-...] [2011-11-29 10:03:27] [74be16979710d4c4e7c6647856088456]
- RMPD      [(Partial) Autocorrelation Function] [Paper: ACF] [2011-12-23 11:29:16] [f722e8e78b9e5c5ebaa2263f273aa636]
- R             [(Partial) Autocorrelation Function] [Paper: ACF] [2011-12-23 11:34:41] [3e64eea457df40fcb7af8f28e1ee6256] [Current]
Feedback Forum

Post a new message
Dataseries X:
24.90
25.06
25.10
24.92
25.46
25.89
25.39
25.38
25.25
24.88
25.00
25.00
24.07
23.60
23.18
23.25
23.04
22.77
22.25
22.41
22.50
22.91
22.88
21.69
21.19
21.56
22.00
22.13
22.27
22.30
21.94
22.40
22.77
22.90
23.03
23.05
22.41
22.26
21.90
22.01
22.62
22.76
23.40
23.63
24.05
23.82
23.71
23.95
23.61
23.98
23.56
23.99
24.33
24.48
24.31
24.38
24.63
25.54
25.75
25.73
25.85
25.78
25.86
26.86
27.36
27.38
26.58
27.65
27.73
27.18
27.32
27.30
26.90
26.70
26.75
26.41
26.29
27.51
27.91
27.70
27.28
28.25
27.62
27.30
25.94
24.99
25.50
24.42
26.58
25.84
26.76
26.74
26.68
25.55
26.40
25.19
23.94
24.20
24.20
23.07
24.07
25.02
24.65
24.68
24.63
24.49
25.05
24.31
23.90
23.68
24.50
25.22
25.48
26.00
26.07
26.06
26.22
26.70
27.20
26.77
26.11
25.43
24.99
25.51
24.00
23.86
22.96
23.41
23.17
24.12
23.87
24.27
24.40
24.16
25.15
25.09
24.60
24.33
24.14
24.36
25.40
26.15
26.77
26.94
26.33
26.24
26.23
25.88
27.00
26.91
27.15
27.78
28.73
28.83
28.68
27.56
27.15
27.41
27.47
28.76
28.47
27.94
27.23
27.01
26.15
26.11
27.20
27.36
27.33
27.43
28.92
29.45
29.01
29.25
29.14
29.64
30.40
30.62
31.25
31.75
31.30
30.70
31.03
31.46
31.28
31.03
30.95
31.17
31.29
31.91
32.10
31.71
31.90
32.02
32.65
33.77
33.51
34.26
34.21
34.13
34.73
34.73
34.57
34.80
33.98
34.40
34.21
34.61
35.25
35.23
35.00
34.52
33.82
34.35
34.81
34.96
36.69
36.42
36.44
37.41
36.40
36.15
35.78
36.95
36.14
36.36
37.31
37.58
38.00
37.23
37.00
37.87
37.70
36.17
36.56
37.70
38.77
39.02
39.88
39.56
38.52
37.20
38.58
39.41
39.08
38.81
38.73
38.70
39.23
39.82
39.97
40.37
39.54
39.21
39.07
39.78
39.40
38.92


Summary of computational transaction
Raw Inputview raw input (R code)
Raw Outputview raw output of R engine
Computing time2 seconds
R Server'AstonUniversity' @ aston.wessa.net

\begin{tabular}{lllllllll}
\hline
Summary of computational transaction \tabularnewline
Raw Input & view raw input (R code)  \tabularnewline
Raw Output & view raw output of R engine  \tabularnewline
Computing time & 2 seconds \tabularnewline
R Server & 'AstonUniversity' @ aston.wessa.net \tabularnewline
\hline
\end{tabular}
%Source: https://freestatistics.org/blog/index.php?pk=160296&T=0

[TABLE]
[ROW][C]Summary of computational transaction[/C][/ROW]
[ROW][C]Raw Input[/C][C]view raw input (R code) [/C][/ROW]
[ROW][C]Raw Output[/C][C]view raw output of R engine [/C][/ROW]
[ROW][C]Computing time[/C][C]2 seconds[/C][/ROW]
[ROW][C]R Server[/C][C]'AstonUniversity' @ aston.wessa.net[/C][/ROW]
[/TABLE]
Source: https://freestatistics.org/blog/index.php?pk=160296&T=0

Globally Unique Identifier (entire table): ba.freestatistics.org/blog/index.php?pk=160296&T=0

As an alternative you can also use a QR Code:  

The GUIDs for individual cells are displayed in the table below:

Summary of computational transaction
Raw Inputview raw input (R code)
Raw Outputview raw output of R engine
Computing time2 seconds
R Server'AstonUniversity' @ aston.wessa.net


Autocorrelation Function
Time lag kACF(k)T-STATP-value
10.98544315.82860
20.97012815.58260
30.95464515.33390
40.94089315.1130
50.92777814.90230
60.91554714.70590
70.90165814.48280
80.88783414.26070
90.87428114.0430
100.86132413.83490
110.8495413.64560
120.83595113.42740
130.8200913.17260
140.80292212.89680
150.786412.63150
160.77293712.41520
170.7613712.22940
180.74767312.00940
190.73187611.75570
200.71489711.4830
210.69865511.22210
220.68319210.97370
230.67028510.76640
240.65686610.55080

\begin{tabular}{lllllllll}
\hline
Autocorrelation Function \tabularnewline
Time lag k & ACF(k) & T-STAT & P-value \tabularnewline
1 & 0.985443 & 15.8286 & 0 \tabularnewline
2 & 0.970128 & 15.5826 & 0 \tabularnewline
3 & 0.954645 & 15.3339 & 0 \tabularnewline
4 & 0.940893 & 15.113 & 0 \tabularnewline
5 & 0.927778 & 14.9023 & 0 \tabularnewline
6 & 0.915547 & 14.7059 & 0 \tabularnewline
7 & 0.901658 & 14.4828 & 0 \tabularnewline
8 & 0.887834 & 14.2607 & 0 \tabularnewline
9 & 0.874281 & 14.043 & 0 \tabularnewline
10 & 0.861324 & 13.8349 & 0 \tabularnewline
11 & 0.84954 & 13.6456 & 0 \tabularnewline
12 & 0.835951 & 13.4274 & 0 \tabularnewline
13 & 0.82009 & 13.1726 & 0 \tabularnewline
14 & 0.802922 & 12.8968 & 0 \tabularnewline
15 & 0.7864 & 12.6315 & 0 \tabularnewline
16 & 0.772937 & 12.4152 & 0 \tabularnewline
17 & 0.76137 & 12.2294 & 0 \tabularnewline
18 & 0.747673 & 12.0094 & 0 \tabularnewline
19 & 0.731876 & 11.7557 & 0 \tabularnewline
20 & 0.714897 & 11.483 & 0 \tabularnewline
21 & 0.698655 & 11.2221 & 0 \tabularnewline
22 & 0.683192 & 10.9737 & 0 \tabularnewline
23 & 0.670285 & 10.7664 & 0 \tabularnewline
24 & 0.656866 & 10.5508 & 0 \tabularnewline
\hline
\end{tabular}
%Source: https://freestatistics.org/blog/index.php?pk=160296&T=1

[TABLE]
[ROW][C]Autocorrelation Function[/C][/ROW]
[ROW][C]Time lag k[/C][C]ACF(k)[/C][C]T-STAT[/C][C]P-value[/C][/ROW]
[ROW][C]1[/C][C]0.985443[/C][C]15.8286[/C][C]0[/C][/ROW]
[ROW][C]2[/C][C]0.970128[/C][C]15.5826[/C][C]0[/C][/ROW]
[ROW][C]3[/C][C]0.954645[/C][C]15.3339[/C][C]0[/C][/ROW]
[ROW][C]4[/C][C]0.940893[/C][C]15.113[/C][C]0[/C][/ROW]
[ROW][C]5[/C][C]0.927778[/C][C]14.9023[/C][C]0[/C][/ROW]
[ROW][C]6[/C][C]0.915547[/C][C]14.7059[/C][C]0[/C][/ROW]
[ROW][C]7[/C][C]0.901658[/C][C]14.4828[/C][C]0[/C][/ROW]
[ROW][C]8[/C][C]0.887834[/C][C]14.2607[/C][C]0[/C][/ROW]
[ROW][C]9[/C][C]0.874281[/C][C]14.043[/C][C]0[/C][/ROW]
[ROW][C]10[/C][C]0.861324[/C][C]13.8349[/C][C]0[/C][/ROW]
[ROW][C]11[/C][C]0.84954[/C][C]13.6456[/C][C]0[/C][/ROW]
[ROW][C]12[/C][C]0.835951[/C][C]13.4274[/C][C]0[/C][/ROW]
[ROW][C]13[/C][C]0.82009[/C][C]13.1726[/C][C]0[/C][/ROW]
[ROW][C]14[/C][C]0.802922[/C][C]12.8968[/C][C]0[/C][/ROW]
[ROW][C]15[/C][C]0.7864[/C][C]12.6315[/C][C]0[/C][/ROW]
[ROW][C]16[/C][C]0.772937[/C][C]12.4152[/C][C]0[/C][/ROW]
[ROW][C]17[/C][C]0.76137[/C][C]12.2294[/C][C]0[/C][/ROW]
[ROW][C]18[/C][C]0.747673[/C][C]12.0094[/C][C]0[/C][/ROW]
[ROW][C]19[/C][C]0.731876[/C][C]11.7557[/C][C]0[/C][/ROW]
[ROW][C]20[/C][C]0.714897[/C][C]11.483[/C][C]0[/C][/ROW]
[ROW][C]21[/C][C]0.698655[/C][C]11.2221[/C][C]0[/C][/ROW]
[ROW][C]22[/C][C]0.683192[/C][C]10.9737[/C][C]0[/C][/ROW]
[ROW][C]23[/C][C]0.670285[/C][C]10.7664[/C][C]0[/C][/ROW]
[ROW][C]24[/C][C]0.656866[/C][C]10.5508[/C][C]0[/C][/ROW]
[/TABLE]
Source: https://freestatistics.org/blog/index.php?pk=160296&T=1

Globally Unique Identifier (entire table): ba.freestatistics.org/blog/index.php?pk=160296&T=1

As an alternative you can also use a QR Code:  

The GUIDs for individual cells are displayed in the table below:

Autocorrelation Function
Time lag kACF(k)T-STATP-value
10.98544315.82860
20.97012815.58260
30.95464515.33390
40.94089315.1130
50.92777814.90230
60.91554714.70590
70.90165814.48280
80.88783414.26070
90.87428114.0430
100.86132413.83490
110.8495413.64560
120.83595113.42740
130.8200913.17260
140.80292212.89680
150.786412.63150
160.77293712.41520
170.7613712.22940
180.74767312.00940
190.73187611.75570
200.71489711.4830
210.69865511.22210
220.68319210.97370
230.67028510.76640
240.65686610.55080


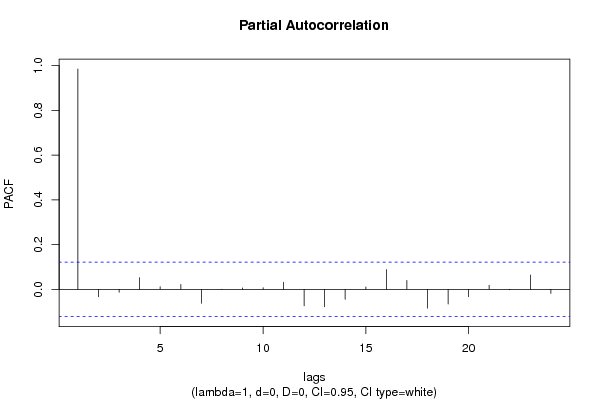
Partial Autocorrelation Function
Time lag kPACF(k)T-STATP-value
10.98544315.82860
2-0.033562-0.53910.295148
3-0.012915-0.20740.417915
40.0523390.84070.20065
50.0119260.19160.424119
60.0220460.35410.361771
7-0.062357-1.00160.158738
8-8.8e-05-0.00140.499438
90.0065740.10560.457992
100.0075840.12180.45157
110.0320170.51430.303752
12-0.073828-1.18580.118386
13-0.078261-1.25710.104934
14-0.044661-0.71740.2369
150.0107690.1730.431404
160.0889681.4290.077101
170.039330.63170.26406
18-0.083947-1.34840.089358
19-0.065692-1.05520.146166
20-0.033488-0.53790.295558
210.0187870.30180.381539
22-0.002002-0.03220.487184
230.0637941.02470.153238
24-0.01798-0.28880.386481

\begin{tabular}{lllllllll}
\hline
Partial Autocorrelation Function \tabularnewline
Time lag k & PACF(k) & T-STAT & P-value \tabularnewline
1 & 0.985443 & 15.8286 & 0 \tabularnewline
2 & -0.033562 & -0.5391 & 0.295148 \tabularnewline
3 & -0.012915 & -0.2074 & 0.417915 \tabularnewline
4 & 0.052339 & 0.8407 & 0.20065 \tabularnewline
5 & 0.011926 & 0.1916 & 0.424119 \tabularnewline
6 & 0.022046 & 0.3541 & 0.361771 \tabularnewline
7 & -0.062357 & -1.0016 & 0.158738 \tabularnewline
8 & -8.8e-05 & -0.0014 & 0.499438 \tabularnewline
9 & 0.006574 & 0.1056 & 0.457992 \tabularnewline
10 & 0.007584 & 0.1218 & 0.45157 \tabularnewline
11 & 0.032017 & 0.5143 & 0.303752 \tabularnewline
12 & -0.073828 & -1.1858 & 0.118386 \tabularnewline
13 & -0.078261 & -1.2571 & 0.104934 \tabularnewline
14 & -0.044661 & -0.7174 & 0.2369 \tabularnewline
15 & 0.010769 & 0.173 & 0.431404 \tabularnewline
16 & 0.088968 & 1.429 & 0.077101 \tabularnewline
17 & 0.03933 & 0.6317 & 0.26406 \tabularnewline
18 & -0.083947 & -1.3484 & 0.089358 \tabularnewline
19 & -0.065692 & -1.0552 & 0.146166 \tabularnewline
20 & -0.033488 & -0.5379 & 0.295558 \tabularnewline
21 & 0.018787 & 0.3018 & 0.381539 \tabularnewline
22 & -0.002002 & -0.0322 & 0.487184 \tabularnewline
23 & 0.063794 & 1.0247 & 0.153238 \tabularnewline
24 & -0.01798 & -0.2888 & 0.386481 \tabularnewline
\hline
\end{tabular}
%Source: https://freestatistics.org/blog/index.php?pk=160296&T=2

[TABLE]
[ROW][C]Partial Autocorrelation Function[/C][/ROW]
[ROW][C]Time lag k[/C][C]PACF(k)[/C][C]T-STAT[/C][C]P-value[/C][/ROW]
[ROW][C]1[/C][C]0.985443[/C][C]15.8286[/C][C]0[/C][/ROW]
[ROW][C]2[/C][C]-0.033562[/C][C]-0.5391[/C][C]0.295148[/C][/ROW]
[ROW][C]3[/C][C]-0.012915[/C][C]-0.2074[/C][C]0.417915[/C][/ROW]
[ROW][C]4[/C][C]0.052339[/C][C]0.8407[/C][C]0.20065[/C][/ROW]
[ROW][C]5[/C][C]0.011926[/C][C]0.1916[/C][C]0.424119[/C][/ROW]
[ROW][C]6[/C][C]0.022046[/C][C]0.3541[/C][C]0.361771[/C][/ROW]
[ROW][C]7[/C][C]-0.062357[/C][C]-1.0016[/C][C]0.158738[/C][/ROW]
[ROW][C]8[/C][C]-8.8e-05[/C][C]-0.0014[/C][C]0.499438[/C][/ROW]
[ROW][C]9[/C][C]0.006574[/C][C]0.1056[/C][C]0.457992[/C][/ROW]
[ROW][C]10[/C][C]0.007584[/C][C]0.1218[/C][C]0.45157[/C][/ROW]
[ROW][C]11[/C][C]0.032017[/C][C]0.5143[/C][C]0.303752[/C][/ROW]
[ROW][C]12[/C][C]-0.073828[/C][C]-1.1858[/C][C]0.118386[/C][/ROW]
[ROW][C]13[/C][C]-0.078261[/C][C]-1.2571[/C][C]0.104934[/C][/ROW]
[ROW][C]14[/C][C]-0.044661[/C][C]-0.7174[/C][C]0.2369[/C][/ROW]
[ROW][C]15[/C][C]0.010769[/C][C]0.173[/C][C]0.431404[/C][/ROW]
[ROW][C]16[/C][C]0.088968[/C][C]1.429[/C][C]0.077101[/C][/ROW]
[ROW][C]17[/C][C]0.03933[/C][C]0.6317[/C][C]0.26406[/C][/ROW]
[ROW][C]18[/C][C]-0.083947[/C][C]-1.3484[/C][C]0.089358[/C][/ROW]
[ROW][C]19[/C][C]-0.065692[/C][C]-1.0552[/C][C]0.146166[/C][/ROW]
[ROW][C]20[/C][C]-0.033488[/C][C]-0.5379[/C][C]0.295558[/C][/ROW]
[ROW][C]21[/C][C]0.018787[/C][C]0.3018[/C][C]0.381539[/C][/ROW]
[ROW][C]22[/C][C]-0.002002[/C][C]-0.0322[/C][C]0.487184[/C][/ROW]
[ROW][C]23[/C][C]0.063794[/C][C]1.0247[/C][C]0.153238[/C][/ROW]
[ROW][C]24[/C][C]-0.01798[/C][C]-0.2888[/C][C]0.386481[/C][/ROW]
[/TABLE]
Source: https://freestatistics.org/blog/index.php?pk=160296&T=2

Globally Unique Identifier (entire table): ba.freestatistics.org/blog/index.php?pk=160296&T=2

As an alternative you can also use a QR Code:  

The GUIDs for individual cells are displayed in the table below:

Partial Autocorrelation Function
Time lag kPACF(k)T-STATP-value
10.98544315.82860
2-0.033562-0.53910.295148
3-0.012915-0.20740.417915
40.0523390.84070.20065
50.0119260.19160.424119
60.0220460.35410.361771
7-0.062357-1.00160.158738
8-8.8e-05-0.00140.499438
90.0065740.10560.457992
100.0075840.12180.45157
110.0320170.51430.303752
12-0.073828-1.18580.118386
13-0.078261-1.25710.104934
14-0.044661-0.71740.2369
150.0107690.1730.431404
160.0889681.4290.077101
170.039330.63170.26406
18-0.083947-1.34840.089358
19-0.065692-1.05520.146166
20-0.033488-0.53790.295558
210.0187870.30180.381539
22-0.002002-0.03220.487184
230.0637941.02470.153238
24-0.01798-0.28880.386481


Parameters (Session):
par1 = Valutakoersen Eur-Dollar ; par4 = 12 ;
Parameters (R input):
par1 = Default ; par2 = 1 ; par3 = 0 ; par4 = 0 ; par5 = 12 ; par6 = White Noise ; par7 = 0.95 ; par8 = ;
R code (references can be found in the software module):
if (par1 == 'Default') {
par1 = 10*log10(length(x))
} else {
par1 <- as.numeric(par1)
}
par2 <- as.numeric(par2)
par3 <- as.numeric(par3)
par4 <- as.numeric(par4)
par5 <- as.numeric(par5)
if (par6 == 'White Noise') par6 <- 'white' else par6 <- 'ma'
par7 <- as.numeric(par7)
if (par8 != '') par8 <- as.numeric(par8)
ox <- x
if (par8 == '') {
if (par2 == 0) {
x <- log(x)
} else {
x <- (x ^ par2 - 1) / par2
}
} else {
x <- log(x,base=par8)
}
if (par3 > 0) x <- diff(x,lag=1,difference=par3)
if (par4 > 0) x <- diff(x,lag=par5,difference=par4)
bitmap(file='picts.png')
op <- par(mfrow=c(2,1))
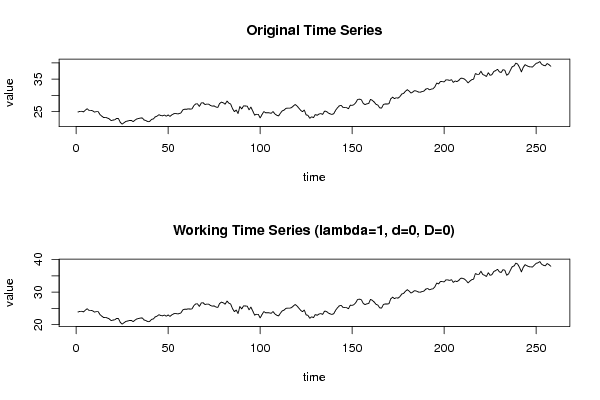
plot(ox,type='l',main='Original Time Series',xlab='time',ylab='value')
if (par8=='') {
mytitle <- paste('Working Time Series (lambda=',par2,', d=',par3,', D=',par4,')',sep='')
mysub <- paste('(lambda=',par2,', d=',par3,', D=',par4,', CI=', par7, ', CI type=',par6,')',sep='')
} else {
mytitle <- paste('Working Time Series (base=',par8,', d=',par3,', D=',par4,')',sep='')
mysub <- paste('(base=',par8,', d=',par3,', D=',par4,', CI=', par7, ', CI type=',par6,')',sep='')
}
plot(x,type='l', main=mytitle,xlab='time',ylab='value')
par(op)
dev.off()
bitmap(file='pic1.png')
racf <- acf(x, par1, main='Autocorrelation', xlab='time lag', ylab='ACF', ci.type=par6, ci=par7, sub=mysub)
dev.off()
bitmap(file='pic2.png')
rpacf <- pacf(x,par1,main='Partial Autocorrelation',xlab='lags',ylab='PACF',sub=mysub)
dev.off()
(myacf <- c(racf$acf))
(mypacf <- c(rpacf$acf))
lengthx <- length(x)
sqrtn <- sqrt(lengthx)
load(file='createtable')
a<-table.start()
a<-table.row.start(a)
a<-table.element(a,'Autocorrelation Function',4,TRUE)
a<-table.row.end(a)
a<-table.row.start(a)
a<-table.element(a,'Time lag k',header=TRUE)
a<-table.element(a,hyperlink('basics.htm','ACF(k)','click here for more information about the Autocorrelation Function'),header=TRUE)
a<-table.element(a,'T-STAT',header=TRUE)
a<-table.element(a,'P-value',header=TRUE)
a<-table.row.end(a)
for (i in 2:(par1+1)) {
a<-table.row.start(a)
a<-table.element(a,i-1,header=TRUE)
a<-table.element(a,round(myacf[i],6))
mytstat <- myacf[i]*sqrtn
a<-table.element(a,round(mytstat,4))
a<-table.element(a,round(1-pt(abs(mytstat),lengthx),6))
a<-table.row.end(a)
}
a<-table.end(a)
table.save(a,file='mytable.tab')
a<-table.start()
a<-table.row.start(a)
a<-table.element(a,'Partial Autocorrelation Function',4,TRUE)
a<-table.row.end(a)
a<-table.row.start(a)
a<-table.element(a,'Time lag k',header=TRUE)
a<-table.element(a,hyperlink('basics.htm','PACF(k)','click here for more information about the Partial Autocorrelation Function'),header=TRUE)
a<-table.element(a,'T-STAT',header=TRUE)
a<-table.element(a,'P-value',header=TRUE)
a<-table.row.end(a)
for (i in 1:par1) {
a<-table.row.start(a)
a<-table.element(a,i,header=TRUE)
a<-table.element(a,round(mypacf[i],6))
mytstat <- mypacf[i]*sqrtn
a<-table.element(a,round(mytstat,4))
a<-table.element(a,round(1-pt(abs(mytstat),lengthx),6))
a<-table.row.end(a)
}
a<-table.end(a)
table.save(a,file='mytable1.tab')