| Multiple Linear Regression - Estimated Regression Equation |
| WERKLOZEN[t] = + 477.412730911941 + 12.6518644068873OVERLIJDENS[t] + 0.00103154326563818INSCHRIJVINGEN[t] + e[t] |
| Multiple Linear Regression - Ordinary Least Squares | |||||
| Variable | Parameter | S.D. | T-STAT H0: parameter = 0 | 2-tail p-value | 1-tail p-value |
| (Intercept) | 477.412730911941 | 40.036756 | 11.9244 | 0 | 0 |
| OVERLIJDENS | 12.6518644068873 | 4.939798 | 2.5612 | 0.013102 | 0.006551 |
| INSCHRIJVINGEN | 0.00103154326563818 | 0.000376 | 2.7411 | 0.008165 | 0.004083 |
| Multiple Linear Regression - Regression Statistics | |
| Multiple R | 0.52089604026947 |
| R-squared | 0.271332684768414 |
| Adjusted R-squared | 0.245765410549761 |
| F-TEST (value) | 10.6124994963471 |
| F-TEST (DF numerator) | 2 |
| F-TEST (DF denominator) | 57 |
| p-value | 0.000120804955369258 |
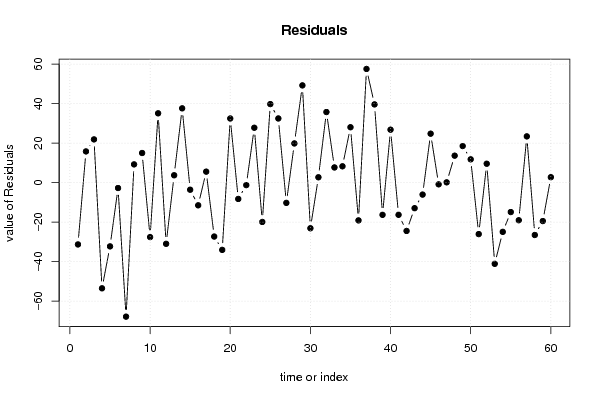
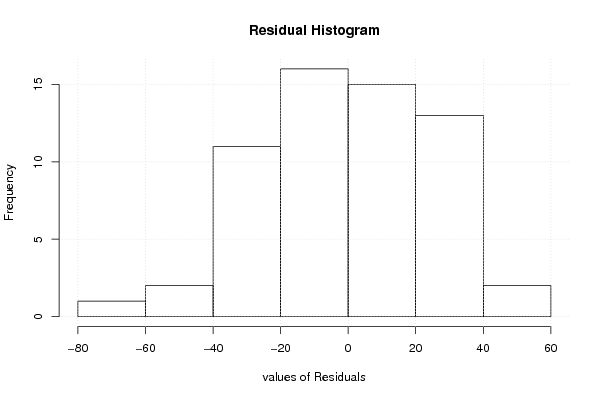
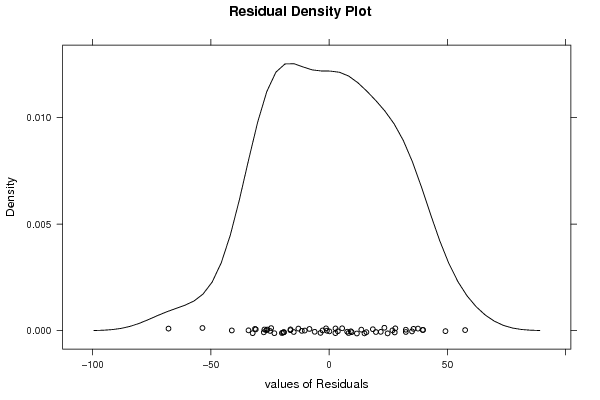
| Multiple Linear Regression - Residual Statistics | |
| Residual Standard Deviation | 26.9689457429041 |
| Sum Squared Residuals | 41457.4699655711 |
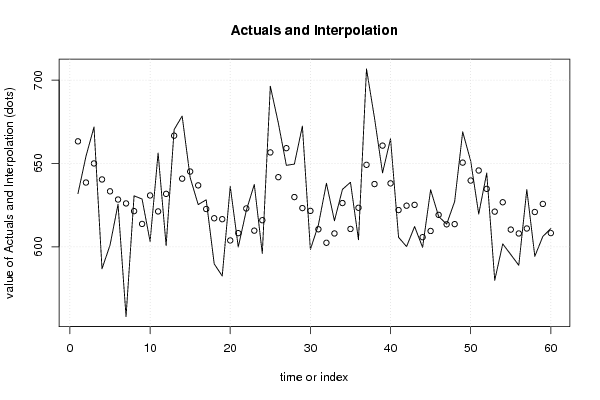
| Multiple Linear Regression - Actuals, Interpolation, and Residuals | |||
| Time or Index | Actuals | Interpolation Forecast | Residuals Prediction Error |
| 1 | 631.923 | 663.262046761124 | -31.3390467611236 |
| 2 | 654.294 | 638.547377243475 | 15.7466227565248 |
| 3 | 671.833 | 649.996783187799 | 21.8362168122011 |
| 4 | 586.84 | 640.38992227428 | -53.54992227428 |
| 5 | 600.969 | 633.294357564807 | -32.3253575648067 |
| 6 | 625.568 | 628.351071461816 | -2.78307146181601 |
| 7 | 558.11 | 626.01339631175 | -67.90339631175 |
| 8 | 630.577 | 621.396066083587 | 9.1809339164131 |
| 9 | 628.654 | 613.705854699109 | 14.948145300891 |
| 10 | 603.184 | 630.808237864937 | -27.6242378649373 |
| 11 | 656.255 | 621.220703728428 | 35.0342962715716 |
| 12 | 600.73 | 631.753529768381 | -31.0235297683809 |
| 13 | 670.326 | 666.648793164645 | 3.67720683535483 |
| 14 | 678.423 | 640.870226364677 | 37.5527736353235 |
| 15 | 641.502 | 645.137809487189 | -3.63580948718915 |
| 16 | 625.311 | 636.851229022472 | -11.5402290224716 |
| 17 | 628.177 | 622.667079005901 | 5.50992099409926 |
| 18 | 589.767 | 617.118993062542 | -27.3519930625415 |
| 19 | 582.471 | 616.565536432488 | -34.0945364324881 |
| 20 | 636.248 | 603.825227951691 | 32.4227720483089 |
| 21 | 599.885 | 608.198668508589 | -8.31366850858868 |
| 22 | 621.694 | 622.993893508456 | -1.29989350845631 |
| 23 | 637.406 | 609.674398104161 | 27.7316018958388 |
| 24 | 595.994 | 615.952487446723 | -19.9584874467227 |
| 25 | 696.308 | 656.600802759101 | 39.7071972408991 |
| 26 | 674.201 | 641.76520774994 | 32.4357922500602 |
| 27 | 648.861 | 659.159499564182 | -10.2984995641817 |
| 28 | 649.605 | 629.819784663307 | 19.7852153366931 |
| 29 | 672.392 | 623.213993097768 | 49.1780069022321 |
| 30 | 598.396 | 621.548127907903 | -23.1521279079026 |
| 31 | 613.177 | 610.516939697504 | 2.66006030249561 |
| 32 | 638.104 | 602.408794572565 | 35.6952054274347 |
| 33 | 615.632 | 608.001002123198 | 7.63099787680209 |
| 34 | 634.465 | 626.251018739099 | 8.21398126090061 |
| 35 | 638.686 | 610.699315697511 | 27.9866843024885 |
| 36 | 604.243 | 623.410525561161 | -19.1675255611606 |
| 37 | 706.669 | 649.168770232378 | 57.5002297676222 |
| 38 | 677.185 | 637.637519440163 | 39.5474805598368 |
| 39 | 644.328 | 660.680301125243 | -16.3523011252427 |
| 40 | 664.825 | 638.071632538107 | 26.753367461893 |
| 41 | 605.707 | 622.044726783305 | -16.3377267833054 |
| 42 | 600.136 | 624.653697812234 | -24.5176978122343 |
| 43 | 612.166 | 625.157881068647 | -12.9918810686473 |
| 44 | 599.659 | 605.772319229748 | -6.11331922974796 |
| 45 | 634.21 | 609.488536752563 | 24.7214632474367 |
| 46 | 618.234 | 619.158744820502 | -0.924744820501995 |
| 47 | 613.576 | 613.481280356426 | 0.0947196435738547 |
| 48 | 627.2 | 613.59723151911 | 13.6027684808904 |
| 49 | 668.973 | 650.492965346634 | 18.4800346533661 |
| 50 | 651.479 | 639.741354905413 | 11.7376450945873 |
| 51 | 619.661 | 645.770396408886 | -26.1093964088855 |
| 52 | 644.26 | 634.745800777171 | 9.51419922282902 |
| 53 | 579.936 | 621.082130299575 | -41.1461302995752 |
| 54 | 601.752 | 626.727619671649 | -24.9756196716494 |
| 55 | 595.376 | 610.320035859757 | -14.9440358597571 |
| 56 | 588.902 | 607.998783068022 | -19.0967830680218 |
| 57 | 634.341 | 610.981505192709 | 23.3594948072908 |
| 58 | 594.305 | 620.865764212481 | -26.5607642124815 |
| 59 | 606.2 | 625.707455326668 | -19.5074553266684 |
| 60 | 610.926 | 608.231846110343 | 2.69415388965708 |
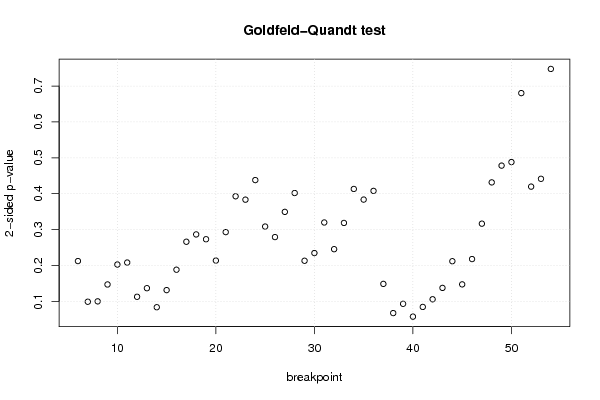
| Goldfeld-Quandt test for Heteroskedasticity | |||
| p-values | Alternative Hypothesis | ||
| breakpoint index | greater | 2-sided | less |
| 6 | 0.893760972394737 | 0.212478055210526 | 0.106239027605263 |
| 7 | 0.950454985095996 | 0.0990900298080072 | 0.0495450149040036 |
| 8 | 0.949912470201587 | 0.100175059596827 | 0.0500875297984134 |
| 9 | 0.926402964164481 | 0.147194071671039 | 0.0735970358355195 |
| 10 | 0.898613142017604 | 0.202773715964791 | 0.101386857982396 |
| 11 | 0.895881387117259 | 0.208237225765482 | 0.104118612882741 |
| 12 | 0.943554839353548 | 0.112890321292905 | 0.0564451606464524 |
| 13 | 0.931584084564181 | 0.136831830871637 | 0.0684159154358186 |
| 14 | 0.958105871072072 | 0.083788257855856 | 0.041894128927928 |
| 15 | 0.934248987096807 | 0.131502025806387 | 0.0657510129031935 |
| 16 | 0.905858399059619 | 0.188283201880761 | 0.0941416009403806 |
| 17 | 0.866889164283586 | 0.266221671432829 | 0.133110835716414 |
| 18 | 0.856700045589071 | 0.286599908821858 | 0.143299954410929 |
| 19 | 0.86337677681253 | 0.273246446374941 | 0.13662322318747 |
| 20 | 0.893104576681559 | 0.213790846636882 | 0.106895423318441 |
| 21 | 0.853445609368821 | 0.293108781262358 | 0.146554390631179 |
| 22 | 0.803551988481647 | 0.392896023036707 | 0.196448011518353 |
| 23 | 0.808270608848347 | 0.383458782303305 | 0.191729391151653 |
| 24 | 0.78099380347567 | 0.43801239304866 | 0.21900619652433 |
| 25 | 0.84572444165619 | 0.30855111668762 | 0.15427555834381 |
| 26 | 0.860375351653256 | 0.279249296693488 | 0.139624648346744 |
| 27 | 0.825275390582736 | 0.349449218834528 | 0.174724609417264 |
| 28 | 0.799017425007605 | 0.401965149984789 | 0.200982574992395 |
| 29 | 0.893365796605191 | 0.213268406789619 | 0.106634203394809 |
| 30 | 0.882665470565585 | 0.23466905886883 | 0.117334529434415 |
| 31 | 0.840047602810085 | 0.319904794379829 | 0.159952397189915 |
| 32 | 0.877249441847433 | 0.245501116305134 | 0.122750558152567 |
| 33 | 0.840705477887488 | 0.318589044225024 | 0.159294522112512 |
| 34 | 0.793364951819141 | 0.413270096361718 | 0.206635048180859 |
| 35 | 0.808162505903441 | 0.383674988193117 | 0.191837494096559 |
| 36 | 0.796057713810674 | 0.407884572378652 | 0.203942286189326 |
| 37 | 0.925597224088699 | 0.148805551822602 | 0.0744027759113008 |
| 38 | 0.966230393408346 | 0.0675392131833083 | 0.0337696065916541 |
| 39 | 0.953343750877786 | 0.0933124982444273 | 0.0466562491222136 |
| 40 | 0.971226567277621 | 0.0575468654447584 | 0.0287734327223792 |
| 41 | 0.957701736658531 | 0.084596526682939 | 0.0422982633414695 |
| 42 | 0.947001229292139 | 0.105997541415722 | 0.0529987707078609 |
| 43 | 0.931188268377098 | 0.137623463245804 | 0.0688117316229021 |
| 44 | 0.894002290216383 | 0.211995419567234 | 0.105997709783617 |
| 45 | 0.926241464880287 | 0.147517070239426 | 0.0737585351197132 |
| 46 | 0.890970756021146 | 0.218058487957707 | 0.109029243978854 |
| 47 | 0.841717475960169 | 0.316565048079662 | 0.158282524039831 |
| 48 | 0.784192448514468 | 0.431615102971064 | 0.215807551485532 |
| 49 | 0.760854821884806 | 0.478290356230387 | 0.239145178115194 |
| 50 | 0.755912356284498 | 0.488175287431005 | 0.244087643715502 |
| 51 | 0.659844740392749 | 0.680310519214502 | 0.340155259607251 |
| 52 | 0.79011116127419 | 0.419777677451621 | 0.20988883872581 |
| 53 | 0.779228314720394 | 0.441543370559211 | 0.220771685279606 |
| 54 | 0.626184848520648 | 0.747630302958705 | 0.373815151479352 |
| Meta Analysis of Goldfeld-Quandt test for Heteroskedasticity | |||
| Description | # significant tests | % significant tests | OK/NOK |
| 1% type I error level | 0 | 0 | OK |
| 5% type I error level | 0 | 0 | OK |
| 10% type I error level | 6 | 0.122448979591837 | NOK |