| Multiple Linear Regression - Estimated Regression Equation |
| OVERLIJDENS[t] = + 2.86996118153291 + 0.00815743505189026WERKLOZEN[t] + 1.46321307875556e-05INSCHRIJVINGEN[t] + e[t] |
| Multiple Linear Regression - Ordinary Least Squares | |||||
| Variable | Parameter | S.D. | T-STAT H0: parameter = 0 | 2-tail p-value | 1-tail p-value |
| (Intercept) | 2.86996118153291 | 1.862038 | 1.5413 | 0.128777 | 0.064389 |
| WERKLOZEN | 0.00815743505189026 | 0.003185 | 2.5612 | 0.013102 | 0.006551 |
| INSCHRIJVINGEN | 1.46321307875556e-05 | 1e-05 | 1.4662 | 0.148091 | 0.074046 |
| Multiple Linear Regression - Regression Statistics | |
| Multiple R | 0.453052915620016 |
| R-squared | 0.205256944351798 |
| Adjusted R-squared | 0.177371223100983 |
| F-TEST (value) | 7.36064678068189 |
| F-TEST (DF numerator) | 2 |
| F-TEST (DF denominator) | 57 |
| p-value | 0.00143371272974002 |
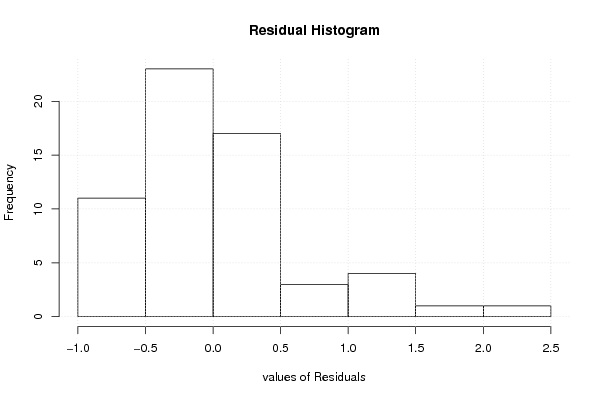
| Multiple Linear Regression - Residual Statistics | |
| Residual Standard Deviation | 0.684799630737921 |
| Sum Squared Residuals | 26.7301804527512 |
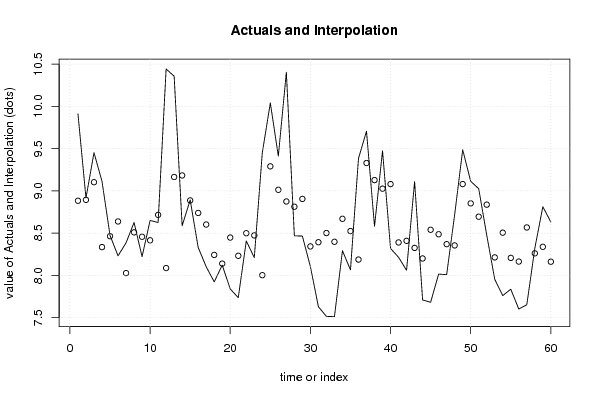
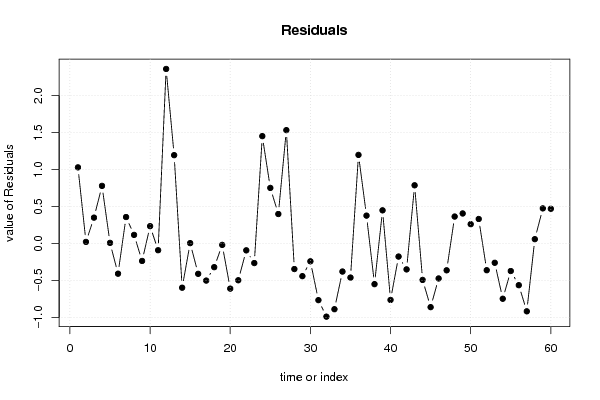
| Multiple Linear Regression - Actuals, Interpolation, and Residuals | |||
| Time or Index | Actuals | Interpolation Forecast | Residuals Prediction Error |
| 1 | 9.911 | 8.88239193302562 | 1.02860806697438 |
| 2 | 8.915 | 8.89305680073319 | 0.0219431992668083 |
| 3 | 9.452 | 9.10216486035253 | 0.349835139647467 |
| 4 | 9.112 | 8.33358693434683 | 0.778413065653174 |
| 5 | 8.472 | 8.4630511331897 | 0.00894886681029972 |
| 6 | 8.23 | 8.63702687147465 | -0.407026871474646 |
| 7 | 8.384 | 8.02594611432194 | 0.358053885678061 |
| 8 | 8.625 | 8.50834496421416 | 0.116655035785842 |
| 9 | 8.221 | 8.45607788964048 | -0.235077889640484 |
| 10 | 8.649 | 8.41409006069184 | 0.234909939308155 |
| 11 | 8.625 | 8.71532411924271 | -0.0903241192427117 |
| 12 | 10.443 | 8.08552397315732 | 2.35747602684268 |
| 13 | 10.357 | 9.16366144129098 | 1.19333855870902 |
| 14 | 8.586 | 9.18187975736161 | -0.595879757361613 |
| 15 | 8.892 | 8.8863178360332 | 0.00568216396680518 |
| 16 | 8.329 | 8.73773576157968 | -0.408735761579676 |
| 17 | 8.101 | 8.60083460979151 | -0.499834609791509 |
| 18 | 7.922 | 8.24093345715162 | -0.318933457151616 |
| 19 | 8.12 | 8.13803254322792 | -0.0180325432279223 |
| 20 | 7.838 | 8.44660602105048 | -0.60860602105048 |
| 21 | 7.735 | 8.23049782598251 | -0.495497825982512 |
| 22 | 8.406 | 8.49784954253351 | -0.0918495425335139 |
| 23 | 8.209 | 8.47244031732263 | -0.263440317322631 |
| 24 | 9.451 | 8.00078451663998 | 1.45021548336002 |
| 25 | 10.041 | 9.28979047174018 | 0.751209528259824 |
| 26 | 9.411 | 9.01207722465686 | 0.398922775343143 |
| 27 | 10.405 | 8.87371450335063 | 1.53128549664937 |
| 28 | 8.467 | 8.811407687859 | -0.344407687858988 |
| 29 | 8.464 | 8.90412838366204 | -0.440128383662045 |
| 30 | 8.102 | 8.34184658903722 | -0.239846589037217 |
| 31 | 7.627 | 8.39119242386539 | -0.764192423865387 |
| 32 | 7.513 | 8.49997997825467 | -0.986979978254671 |
| 33 | 7.51 | 8.39652826760707 | -0.886528267607071 |
| 34 | 8.291 | 8.66886771901876 | -0.377867719018759 |
| 35 | 8.064 | 8.52344210073215 | -0.459442100732155 |
| 36 | 9.383 | 8.18606870105387 | 1.19693129894613 |
| 37 | 9.706 | 9.32900857939454 | 0.37699142060546 |
| 38 | 8.579 | 9.1271821181269 | -0.548182118126903 |
| 39 | 9.474 | 9.02538891250436 | 0.448611087495635 |
| 40 | 8.318 | 9.07935379859807 | -0.761353798598068 |
| 41 | 8.213 | 8.38860932160854 | -0.175609321608539 |
| 42 | 8.059 | 8.40780900475388 | -0.348809004753879 |
| 43 | 9.111 | 8.3242996768314 | 0.786700323168598 |
| 44 | 7.708 | 8.19908270933914 | -0.491082709339135 |
| 45 | 7.68 | 8.5386686359047 | -0.858668635904691 |
| 46 | 8.014 | 8.48557383981241 | -0.471573839812411 |
| 47 | 8.007 | 8.36829962273373 | -0.36129962273373 |
| 48 | 8.718 | 8.3534831360614 | 0.364516863938597 |
| 49 | 9.486 | 9.07977105247453 | 0.40622894752547 |
| 50 | 9.113 | 8.85149618283114 | 0.261503817168862 |
| 51 | 9.025 | 8.69325578792313 | 0.331744212076873 |
| 52 | 8.476 | 8.83606508763058 | -0.36006508763058 |
| 53 | 7.952 | 8.21156973551245 | -0.259569735512451 |
| 54 | 7.759 | 8.50424824397892 | -0.745248243978924 |
| 55 | 7.835 | 8.2058606198872 | -0.37086061988721 |
| 56 | 7.6 | 8.16229689201901 | -0.562296892019009 |
| 57 | 7.651 | 8.56611899170645 | -0.915118991706451 |
| 58 | 8.319 | 8.25985195163289 | 0.0591480483671143 |
| 59 | 8.812 | 8.33708736861956 | 0.47491263138044 |
| 60 | 8.63 | 8.16041539492064 | 0.469584605079364 |
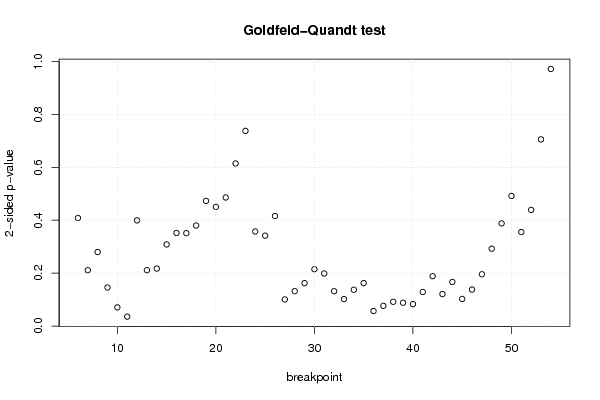
| Goldfeld-Quandt test for Heteroskedasticity | |||
| p-values | Alternative Hypothesis | ||
| breakpoint index | greater | 2-sided | less |
| 6 | 0.204146191449857 | 0.408292382899713 | 0.795853808550143 |
| 7 | 0.105470689029174 | 0.210941378058348 | 0.894529310970826 |
| 8 | 0.139774302253495 | 0.27954860450699 | 0.860225697746505 |
| 9 | 0.0727622454442375 | 0.145524490888475 | 0.927237754555763 |
| 10 | 0.0352198751160908 | 0.0704397502321815 | 0.96478012488391 |
| 11 | 0.0176836800707418 | 0.0353673601414836 | 0.982316319929258 |
| 12 | 0.800404330928436 | 0.399191338143128 | 0.199595669071564 |
| 13 | 0.894469675180941 | 0.211060649638119 | 0.105530324819059 |
| 14 | 0.891442132015659 | 0.217115735968682 | 0.108557867984341 |
| 15 | 0.845792663840215 | 0.308414672319569 | 0.154207336159785 |
| 16 | 0.82420633547657 | 0.35158732904686 | 0.17579366452343 |
| 17 | 0.824525689731898 | 0.350948620536204 | 0.175474310268102 |
| 18 | 0.81008266132522 | 0.37983467734956 | 0.18991733867478 |
| 19 | 0.763533077890405 | 0.472933844219191 | 0.236466922109595 |
| 20 | 0.774910372728061 | 0.450179254543877 | 0.225089627271939 |
| 21 | 0.757114464506853 | 0.485771070986294 | 0.242885535493147 |
| 22 | 0.692887986294979 | 0.614224027410042 | 0.307112013705021 |
| 23 | 0.631211069230339 | 0.737577861539322 | 0.368788930769661 |
| 24 | 0.821376892737402 | 0.357246214525196 | 0.178623107262598 |
| 25 | 0.829244473022547 | 0.341511053954906 | 0.170755526977453 |
| 26 | 0.792158311693187 | 0.415683376613627 | 0.207841688306813 |
| 27 | 0.949783037560804 | 0.100433924878392 | 0.0502169624391959 |
| 28 | 0.93425277751011 | 0.131494444979781 | 0.0657472224898903 |
| 29 | 0.919012158378563 | 0.161975683242874 | 0.0809878416214372 |
| 30 | 0.892643771882975 | 0.21471245623405 | 0.107356228117025 |
| 31 | 0.900737072539932 | 0.198525854920136 | 0.099262927460068 |
| 32 | 0.934192445972261 | 0.131615108055478 | 0.0658075540277389 |
| 33 | 0.949150109360687 | 0.101699781278625 | 0.0508498906393126 |
| 34 | 0.931475801224753 | 0.137048397550493 | 0.0685241987752466 |
| 35 | 0.918902369760907 | 0.162195260478187 | 0.0810976302390933 |
| 36 | 0.971635249629692 | 0.0567295007406169 | 0.0283647503703084 |
| 37 | 0.961876895191048 | 0.0762462096179037 | 0.0381231048089518 |
| 38 | 0.954218729806828 | 0.0915625403863442 | 0.0457812701931721 |
| 39 | 0.956025662599017 | 0.0879486748019651 | 0.0439743374009825 |
| 40 | 0.958646091740628 | 0.0827078165187446 | 0.0413539082593723 |
| 41 | 0.935647393740433 | 0.128705212519133 | 0.0643526062595665 |
| 42 | 0.90583247143817 | 0.188335057123658 | 0.0941675285618292 |
| 43 | 0.93963515570598 | 0.120729688588039 | 0.0603648442940196 |
| 44 | 0.91673727951145 | 0.166525440977099 | 0.0832627204885494 |
| 45 | 0.948812437272411 | 0.102375125455177 | 0.0511875627275885 |
| 46 | 0.931157113465037 | 0.137685773069926 | 0.0688428865349629 |
| 47 | 0.90221133648497 | 0.19557732703006 | 0.0977886635150298 |
| 48 | 0.853909448722108 | 0.292181102555785 | 0.146090551277892 |
| 49 | 0.806018393491644 | 0.387963213016713 | 0.193981606508357 |
| 50 | 0.754182083860796 | 0.491635832278408 | 0.245817916139204 |
| 51 | 0.822419781004756 | 0.355160437990487 | 0.177580218995244 |
| 52 | 0.780589938571748 | 0.438820122856505 | 0.219410061428252 |
| 53 | 0.647307089236663 | 0.705385821526673 | 0.352692910763337 |
| 54 | 0.485781974778738 | 0.971563949557476 | 0.514218025221262 |
| Meta Analysis of Goldfeld-Quandt test for Heteroskedasticity | |||
| Description | # significant tests | % significant tests | OK/NOK |
| 1% type I error level | 0 | 0 | OK |
| 5% type I error level | 1 | 0.0204081632653061 | OK |
| 10% type I error level | 7 | 0.142857142857143 | NOK |