Free Statistics
of Irreproducible Research!
Description of Statistical Computation | |||||||||||||||||||||||||||||||||||||||||||||||||||||||||||||||||||||||||||||||||||||||||||||||||||
|---|---|---|---|---|---|---|---|---|---|---|---|---|---|---|---|---|---|---|---|---|---|---|---|---|---|---|---|---|---|---|---|---|---|---|---|---|---|---|---|---|---|---|---|---|---|---|---|---|---|---|---|---|---|---|---|---|---|---|---|---|---|---|---|---|---|---|---|---|---|---|---|---|---|---|---|---|---|---|---|---|---|---|---|---|---|---|---|---|---|---|---|---|---|---|---|---|---|---|---|
| Author's title | |||||||||||||||||||||||||||||||||||||||||||||||||||||||||||||||||||||||||||||||||||||||||||||||||||
| Author | *The author of this computation has been verified* | ||||||||||||||||||||||||||||||||||||||||||||||||||||||||||||||||||||||||||||||||||||||||||||||||||
| R Software Module | rwasp_correlation.wasp | ||||||||||||||||||||||||||||||||||||||||||||||||||||||||||||||||||||||||||||||||||||||||||||||||||
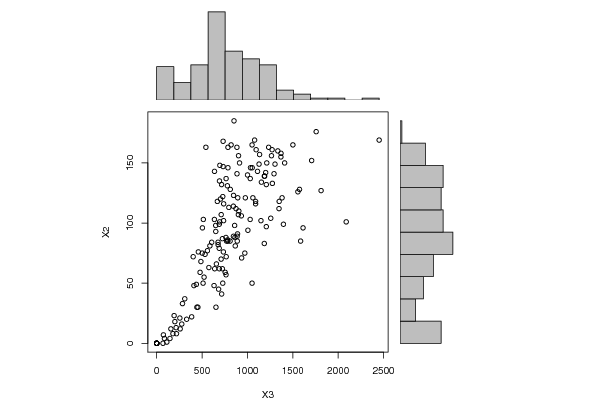
| Title produced by software | Pearson Correlation | ||||||||||||||||||||||||||||||||||||||||||||||||||||||||||||||||||||||||||||||||||||||||||||||||||
| Date of computation | Fri, 23 Dec 2011 05:09:11 -0500 | ||||||||||||||||||||||||||||||||||||||||||||||||||||||||||||||||||||||||||||||||||||||||||||||||||
| Cite this page as follows | Statistical Computations at FreeStatistics.org, Office for Research Development and Education, URL https://freestatistics.org/blog/index.php?v=date/2011/Dec/23/t1324634980nwyca8651thewun.htm/, Retrieved Mon, 29 Apr 2024 23:47:20 +0000 | ||||||||||||||||||||||||||||||||||||||||||||||||||||||||||||||||||||||||||||||||||||||||||||||||||
| Statistical Computations at FreeStatistics.org, Office for Research Development and Education, URL https://freestatistics.org/blog/index.php?pk=160229, Retrieved Mon, 29 Apr 2024 23:47:20 +0000 | |||||||||||||||||||||||||||||||||||||||||||||||||||||||||||||||||||||||||||||||||||||||||||||||||||
| QR Codes: | |||||||||||||||||||||||||||||||||||||||||||||||||||||||||||||||||||||||||||||||||||||||||||||||||||
|
| |||||||||||||||||||||||||||||||||||||||||||||||||||||||||||||||||||||||||||||||||||||||||||||||||||
| Original text written by user: | |||||||||||||||||||||||||||||||||||||||||||||||||||||||||||||||||||||||||||||||||||||||||||||||||||
| IsPrivate? | No (this computation is public) | ||||||||||||||||||||||||||||||||||||||||||||||||||||||||||||||||||||||||||||||||||||||||||||||||||
| User-defined keywords | |||||||||||||||||||||||||||||||||||||||||||||||||||||||||||||||||||||||||||||||||||||||||||||||||||
| Estimated Impact | 86 | ||||||||||||||||||||||||||||||||||||||||||||||||||||||||||||||||||||||||||||||||||||||||||||||||||
Tree of Dependent Computations | |||||||||||||||||||||||||||||||||||||||||||||||||||||||||||||||||||||||||||||||||||||||||||||||||||
| Family? (F = Feedback message, R = changed R code, M = changed R Module, P = changed Parameters, D = changed Data) | |||||||||||||||||||||||||||||||||||||||||||||||||||||||||||||||||||||||||||||||||||||||||||||||||||
| - [Multiple Regression] [] [2010-12-05 18:56:24] [b98453cac15ba1066b407e146608df68] - R PD [Multiple Regression] [bambix] [2011-12-09 12:38:27] [379dab8110dbf77cfcc4b7951c3a599f] - P [Multiple Regression] [bambix] [2011-12-09 12:42:52] [379dab8110dbf77cfcc4b7951c3a599f] - [Multiple Regression] [Multiple Regression] [2011-12-09 13:03:13] [74b1e5a3104ff0b2404b2865a63336ad] - D [Multiple Regression] [Multiple Linear R...] [2011-12-09 14:02:33] [74b1e5a3104ff0b2404b2865a63336ad] - [Multiple Regression] [Multiple linear r...] [2011-12-23 09:00:38] [74b1e5a3104ff0b2404b2865a63336ad] - RMPD [Pearson Correlation] [Multicolinearitei...] [2011-12-23 10:09:11] [f9bdb25068ab2a4592adc645515299ca] [Current] | |||||||||||||||||||||||||||||||||||||||||||||||||||||||||||||||||||||||||||||||||||||||||||||||||||
| Feedback Forum | |||||||||||||||||||||||||||||||||||||||||||||||||||||||||||||||||||||||||||||||||||||||||||||||||||
Post a new message | |||||||||||||||||||||||||||||||||||||||||||||||||||||||||||||||||||||||||||||||||||||||||||||||||||
Dataset | |||||||||||||||||||||||||||||||||||||||||||||||||||||||||||||||||||||||||||||||||||||||||||||||||||
| Dataseries X: | |||||||||||||||||||||||||||||||||||||||||||||||||||||||||||||||||||||||||||||||||||||||||||||||||||
504 502 710 1154 402 179 2452 111 763 650 933 728 764 1186 724 1758 845 1382 514 692 847 1397 533 636 1370 1090 1149 715 639 1213 1111 728 885 410 1293 1186 1348 689 284 1304 1556 770 676 487 1051 2089 330 694 1410 1090 690 218 862 255 454 1208 785 1208 1096 887 1335 1190 1257 1030 658 542 651 888 913 637 900 385 784 891 779 1001 1265 586 765 737 766 1272 653 703 437 936 459 1586 1053 1051 846 732 632 1128 971 711 738 820 1369 1501 893 902 782 214 795 874 1275 1079 443 977 677 696 156 785 192 606 1234 146 866 200 1350 735 522 724 276 859 1031 511 1708 884 1201 559 478 1005 1574 575 1812 755 668 905 682 1613 811 716 1034 732 1060 852 0 85 0 0 0 0 809 1134 0 0 74 259 69 309 0 690 | |||||||||||||||||||||||||||||||||||||||||||||||||||||||||||||||||||||||||||||||||||||||||||||||||||
| Dataseries Y: | |||||||||||||||||||||||||||||||||||||||||||||||||||||||||||||||||||||||||||||||||||||||||||||||||||
96 75 70 134 72 8 169 1 88 98 106 122 57 139 87 176 114 121 103 135 123 99 74 103 158 116 102 132 62 150 143 50 141 48 141 83 112 79 33 149 126 85 84 68 50 101 20 101 150 118 99 8 88 21 30 97 163 132 161 89 160 139 104 103 66 163 93 85 150 143 107 22 85 91 131 140 156 81 137 102 72 161 30 120 49 71 76 85 146 165 89 168 48 149 75 107 116 165 155 165 121 156 86 13 113 112 133 169 30 121 82 148 12 146 23 84 163 4 81 18 118 76 55 62 16 98 137 50 152 163 142 77 59 94 128 63 127 59 118 110 45 96 128 41 146 147 121 185 0 4 0 0 0 0 85 157 0 0 7 12 0 37 0 62 | |||||||||||||||||||||||||||||||||||||||||||||||||||||||||||||||||||||||||||||||||||||||||||||||||||
Tables (Output of Computation) | |||||||||||||||||||||||||||||||||||||||||||||||||||||||||||||||||||||||||||||||||||||||||||||||||||
| |||||||||||||||||||||||||||||||||||||||||||||||||||||||||||||||||||||||||||||||||||||||||||||||||||
Figures (Output of Computation) | |||||||||||||||||||||||||||||||||||||||||||||||||||||||||||||||||||||||||||||||||||||||||||||||||||
Input Parameters & R Code | |||||||||||||||||||||||||||||||||||||||||||||||||||||||||||||||||||||||||||||||||||||||||||||||||||
| Parameters (Session): | |||||||||||||||||||||||||||||||||||||||||||||||||||||||||||||||||||||||||||||||||||||||||||||||||||
| Parameters (R input): | |||||||||||||||||||||||||||||||||||||||||||||||||||||||||||||||||||||||||||||||||||||||||||||||||||
| R code (references can be found in the software module): | |||||||||||||||||||||||||||||||||||||||||||||||||||||||||||||||||||||||||||||||||||||||||||||||||||
bitmap(file='test1.png') | |||||||||||||||||||||||||||||||||||||||||||||||||||||||||||||||||||||||||||||||||||||||||||||||||||