Free Statistics
of Irreproducible Research!
Description of Statistical Computation | |||||||||||||||||||||||||||||||||||||||||||||||||||||||||||||||||||||||||||||||||||||||||||||||||||||||||||||||||||||||||||||||||||||||||||||||||||||||||||||||||||||||||||||||||||||||||||||||||
|---|---|---|---|---|---|---|---|---|---|---|---|---|---|---|---|---|---|---|---|---|---|---|---|---|---|---|---|---|---|---|---|---|---|---|---|---|---|---|---|---|---|---|---|---|---|---|---|---|---|---|---|---|---|---|---|---|---|---|---|---|---|---|---|---|---|---|---|---|---|---|---|---|---|---|---|---|---|---|---|---|---|---|---|---|---|---|---|---|---|---|---|---|---|---|---|---|---|---|---|---|---|---|---|---|---|---|---|---|---|---|---|---|---|---|---|---|---|---|---|---|---|---|---|---|---|---|---|---|---|---|---|---|---|---|---|---|---|---|---|---|---|---|---|---|---|---|---|---|---|---|---|---|---|---|---|---|---|---|---|---|---|---|---|---|---|---|---|---|---|---|---|---|---|---|---|---|---|---|---|---|---|---|---|---|---|---|---|---|---|---|---|---|---|
| Author's title | |||||||||||||||||||||||||||||||||||||||||||||||||||||||||||||||||||||||||||||||||||||||||||||||||||||||||||||||||||||||||||||||||||||||||||||||||||||||||||||||||||||||||||||||||||||||||||||||||
| Author | *The author of this computation has been verified* | ||||||||||||||||||||||||||||||||||||||||||||||||||||||||||||||||||||||||||||||||||||||||||||||||||||||||||||||||||||||||||||||||||||||||||||||||||||||||||||||||||||||||||||||||||||||||||||||||
| R Software Module | rwasp_pairs.wasp | ||||||||||||||||||||||||||||||||||||||||||||||||||||||||||||||||||||||||||||||||||||||||||||||||||||||||||||||||||||||||||||||||||||||||||||||||||||||||||||||||||||||||||||||||||||||||||||||||
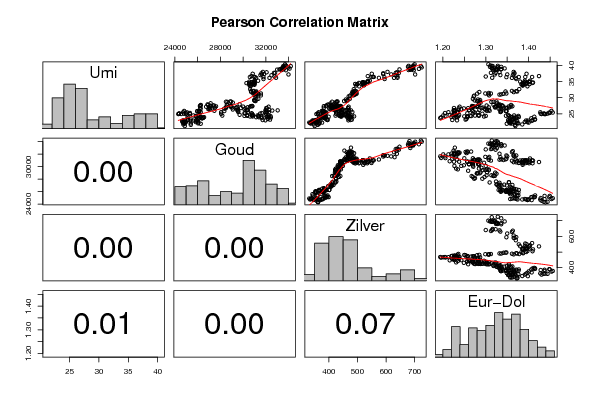
| Title produced by software | Kendall tau Correlation Matrix | ||||||||||||||||||||||||||||||||||||||||||||||||||||||||||||||||||||||||||||||||||||||||||||||||||||||||||||||||||||||||||||||||||||||||||||||||||||||||||||||||||||||||||||||||||||||||||||||||
| Date of computation | Fri, 23 Dec 2011 04:39:07 -0500 | ||||||||||||||||||||||||||||||||||||||||||||||||||||||||||||||||||||||||||||||||||||||||||||||||||||||||||||||||||||||||||||||||||||||||||||||||||||||||||||||||||||||||||||||||||||||||||||||||
| Cite this page as follows | Statistical Computations at FreeStatistics.org, Office for Research Development and Education, URL https://freestatistics.org/blog/index.php?v=date/2011/Dec/23/t1324633199e8u0kl3lslo6k6r.htm/, Retrieved Mon, 29 Apr 2024 22:25:55 +0000 | ||||||||||||||||||||||||||||||||||||||||||||||||||||||||||||||||||||||||||||||||||||||||||||||||||||||||||||||||||||||||||||||||||||||||||||||||||||||||||||||||||||||||||||||||||||||||||||||||
| Statistical Computations at FreeStatistics.org, Office for Research Development and Education, URL https://freestatistics.org/blog/index.php?pk=160220, Retrieved Mon, 29 Apr 2024 22:25:55 +0000 | |||||||||||||||||||||||||||||||||||||||||||||||||||||||||||||||||||||||||||||||||||||||||||||||||||||||||||||||||||||||||||||||||||||||||||||||||||||||||||||||||||||||||||||||||||||||||||||||||
| QR Codes: | |||||||||||||||||||||||||||||||||||||||||||||||||||||||||||||||||||||||||||||||||||||||||||||||||||||||||||||||||||||||||||||||||||||||||||||||||||||||||||||||||||||||||||||||||||||||||||||||||
|
| |||||||||||||||||||||||||||||||||||||||||||||||||||||||||||||||||||||||||||||||||||||||||||||||||||||||||||||||||||||||||||||||||||||||||||||||||||||||||||||||||||||||||||||||||||||||||||||||||
| Original text written by user: | |||||||||||||||||||||||||||||||||||||||||||||||||||||||||||||||||||||||||||||||||||||||||||||||||||||||||||||||||||||||||||||||||||||||||||||||||||||||||||||||||||||||||||||||||||||||||||||||||
| IsPrivate? | No (this computation is public) | ||||||||||||||||||||||||||||||||||||||||||||||||||||||||||||||||||||||||||||||||||||||||||||||||||||||||||||||||||||||||||||||||||||||||||||||||||||||||||||||||||||||||||||||||||||||||||||||||
| User-defined keywords | |||||||||||||||||||||||||||||||||||||||||||||||||||||||||||||||||||||||||||||||||||||||||||||||||||||||||||||||||||||||||||||||||||||||||||||||||||||||||||||||||||||||||||||||||||||||||||||||||
| Estimated Impact | 102 | ||||||||||||||||||||||||||||||||||||||||||||||||||||||||||||||||||||||||||||||||||||||||||||||||||||||||||||||||||||||||||||||||||||||||||||||||||||||||||||||||||||||||||||||||||||||||||||||||
Tree of Dependent Computations | |||||||||||||||||||||||||||||||||||||||||||||||||||||||||||||||||||||||||||||||||||||||||||||||||||||||||||||||||||||||||||||||||||||||||||||||||||||||||||||||||||||||||||||||||||||||||||||||||
| Family? (F = Feedback message, R = changed R code, M = changed R Module, P = changed Parameters, D = changed Data) | |||||||||||||||||||||||||||||||||||||||||||||||||||||||||||||||||||||||||||||||||||||||||||||||||||||||||||||||||||||||||||||||||||||||||||||||||||||||||||||||||||||||||||||||||||||||||||||||||
| - [Histogram] [Bad example of Hi...] [2010-09-25 09:28:23] [b98453cac15ba1066b407e146608df68] - R P [Histogram] [Workshop 1: Task 3] [2011-10-04 18:01:03] [f722e8e78b9e5c5ebaa2263f273aa636] - [Histogram] [Paper: Histogram] [2011-12-21 11:23:29] [f722e8e78b9e5c5ebaa2263f273aa636] - RMPD [Univariate Data Series] [Paper: Run Sequen...] [2011-12-21 23:42:11] [f722e8e78b9e5c5ebaa2263f273aa636] - R [Univariate Data Series] [Paper: Run Sequen...] [2011-12-21 23:57:05] [f722e8e78b9e5c5ebaa2263f273aa636] - RMP [Percentiles] [Paper: Q-Q plot] [2011-12-22 20:16:49] [f722e8e78b9e5c5ebaa2263f273aa636] - R D [Percentiles] [Paper: Q-Q plot] [2011-12-22 20:20:03] [f722e8e78b9e5c5ebaa2263f273aa636] - PD [Percentiles] [Paper: Q-Q plot Z...] [2011-12-23 09:02:43] [f722e8e78b9e5c5ebaa2263f273aa636] - RM D [Kendall tau Correlation Matrix] [Paper: Pearson Co...] [2011-12-23 09:39:07] [3e64eea457df40fcb7af8f28e1ee6256] [Current] | |||||||||||||||||||||||||||||||||||||||||||||||||||||||||||||||||||||||||||||||||||||||||||||||||||||||||||||||||||||||||||||||||||||||||||||||||||||||||||||||||||||||||||||||||||||||||||||||||
| Feedback Forum | |||||||||||||||||||||||||||||||||||||||||||||||||||||||||||||||||||||||||||||||||||||||||||||||||||||||||||||||||||||||||||||||||||||||||||||||||||||||||||||||||||||||||||||||||||||||||||||||||
Post a new message | |||||||||||||||||||||||||||||||||||||||||||||||||||||||||||||||||||||||||||||||||||||||||||||||||||||||||||||||||||||||||||||||||||||||||||||||||||||||||||||||||||||||||||||||||||||||||||||||||
Dataset | |||||||||||||||||||||||||||||||||||||||||||||||||||||||||||||||||||||||||||||||||||||||||||||||||||||||||||||||||||||||||||||||||||||||||||||||||||||||||||||||||||||||||||||||||||||||||||||||||
| Dataseries X: | |||||||||||||||||||||||||||||||||||||||||||||||||||||||||||||||||||||||||||||||||||||||||||||||||||||||||||||||||||||||||||||||||||||||||||||||||||||||||||||||||||||||||||||||||||||||||||||||||
24.90 24300 362 1,439 25.06 24375 361 1,444 25.10 24375 361 1,435 24.92 24550 356 1,430 25.46 24725 364 1,427 25.89 24825 375 1,453 25.39 25100 391 1,448 25.38 24950 379 1,456 25.25 25325 389 1,449 24.88 25325 387 1,437 25.00 24800 379 1,437 25.00 24975 385 1,428 24.07 25125 399 1,413 23.60 25125 388 1,406 23.18 25125 392 1,414 23.25 25400 395 1,415 23.04 25175 395 1,409 22.77 24650 370 1,407 22.25 24775 376 1,400 22.41 24675 367 1,397 22.50 24825 356 1,391 22.91 24775 362 1,394 22.88 24675 346 1,398 21.69 24750 347 1,385 21.19 24875 350 1,369 21.56 25400 361 1,368 22.00 25400 358 1,376 22.13 24750 334 1,374 22.27 24900 331 1,372 22.30 24825 337 1,357 21.94 24875 337 1,361 22.40 24975 341 1,365 22.77 25375 344 1,373 22.90 25600 342 1,357 23.03 26000 353 1,352 23.05 25900 355 1,363 22.41 25850 354 1,358 22.26 26075 353 1,355 21.90 26275 365 1,349 22.01 26050 366 1,357 22.62 26000 354 1,353 22.76 25825 353 1,355 23.40 26075 363 1,364 23.63 26150 368 1,367 24.05 26275 366 1,358 23.82 26475 376 1,366 23.71 26500 383 1,356 23.95 26575 382 1,361 23.61 26425 386 1,366 23.98 26275 389 1,377 23.56 26375 388 1,371 23.99 25900 382 1,372 24.33 25850 379 1,376 24.48 25625 374 1,366 24.31 25900 380 1,355 24.38 26050 383 1,347 24.63 26150 384 1,352 25.54 26275 385 1,334 25.75 26100 378 1,336 25.73 25975 378 1,335 25.85 25975 378 1,347 25.78 26125 383 1,348 25.86 26175 381 1,348 26.86 26225 382 1,347 27.36 26225 382 1,340 27.38 26200 390 1,334 26.58 26275 401 1,330 27.65 26275 392 1,338 27.73 26275 401 1,359 27.18 26750 406 1,358 27.32 27075 408 1,362 27.30 27475 421 1,354 26.90 27525 412 1,354 26.70 27125 407 1,343 26.75 27000 411 1,349 26.41 26950 405 1,337 26.29 27075 416 1,334 27.51 27150 410 1,331 27.91 26875 397 1,332 27.70 26925 409 1,329 27.28 27150 406 1,325 28.25 27150 406 1,326 27.62 27425 412 1,332 27.30 27625 426 1,324 25.94 27475 423 1,309 24.99 28075 425 1,292 25.50 28075 425 1,273 24.42 28175 423 1,275 26.58 28350 434 1,297 25.84 28350 434 1,270 26.76 28500 440 1,267 26.74 29350 422 1,259 26.68 30225 431 1,249 25.55 29575 442 1,235 26.40 30125 448 1,243 25.19 30125 448 1,227 23.94 31150 475 1,233 24.20 31350 481 1,250 24.20 32175 488 1,236 23.07 31725 476 1,222 24.07 31600 474 1,231 25.02 30800 455 1,226 24.65 30800 455 1,238 24.68 29700 434 1,231 24.63 30875 447 1,216 24.49 31275 455 1,222 25.05 31500 459 1,227 24.31 31375 465 1,206 23.90 31400 464 1,196 23.68 31650 468 1,194 24.50 31975 467 1,201 25.22 31650 468 1,205 25.48 31975 467 1,213 26.00 32575 454 1,225 26.07 32025 470 1,226 26.06 33050 477 1,228 26.22 32300 462 1,236 26.70 32100 467 1,237 27.20 32250 469 1,239 26.77 32050 467 1,226 26.11 31975 469 1,227 25.43 32100 466 1,226 24.99 32025 469 1,229 25.51 32275 482 1,234 24.00 32100 474 1,220 23.86 32275 477 1,227 22.96 31975 468 1,233 23.41 32175 469 1,255 23.17 32375 480 1,253 24.12 32300 474 1,258 23.87 32450 474 1,257 24.27 32425 471 1,266 24.40 30800 443 1,264 24.16 30850 441 1,257 25.15 30750 440 1,257 25.09 30175 436 1,270 24.60 30350 442 1,283 24.33 30125 437 1,300 24.14 30625 444 1,296 24.36 30375 440 1,284 25.40 30425 444 1,282 26.15 30325 440 1,285 26.77 29825 438 1,290 26.94 29450 427 1,293 26.33 29100 421 1,303 26.24 29450 424 1,299 26.23 29550 422 1,307 25.88 29575 436 1,303 27.00 29425 435 1,307 26.91 29050 433 1,322 27.15 28525 420 1,321 27.78 28575 417 1,318 28.73 28500 411 1,318 28.83 28875 430 1,325 28.68 28625 428 1,313 27.56 28625 428 1,302 27.15 28925 426 1,279 27.41 28925 432 1,280 27.47 28950 426 1,282 28.76 28950 426 1,286 28.47 29100 424 1,288 27.94 29700 424 1,284 27.23 30000 431 1,271 27.01 30400 441 1,270 26.15 30375 444 1,261 26.11 30425 447 1,261 27.20 30625 440 1,269 27.36 30700 442 1,271 27.33 30825 439 1,270 27.43 30800 439 1,268 28.92 31100 453 1,280 29.45 31175 459 1,282 29.01 31025 462 1,283 29.25 30975 466 1,287 29.14 31025 464 1,274 29.64 31350 473 1,270 30.40 31075 469 1,272 30.62 31125 474 1,273 31.25 30900 480 1,280 31.75 31150 482 1,285 31.30 31575 486 1,299 30.70 31575 486 1,308 31.03 31375 484 1,306 31.46 31100 484 1,307 31.28 30975 487 1,312 31.03 31200 490 1,336 30.95 31125 491 1,332 31.17 31075 495 1,341 31.29 31275 497 1,348 31.91 31175 496 1,346 32.10 30950 489 1,361 31.71 30725 485 1,365 31.90 30900 490 1,373 32.02 30700 493 1,371 32.65 30625 487 1,378 33.77 30700 495 1,386 33.51 30650 506 1,397 34.26 30525 492 1,387 34.21 30850 500 1,394 34.13 30725 499 1,383 34.73 31025 518 1,396 34.73 30975 517 1,410 34.57 30550 505 1,409 34.80 30900 522 1,390 33.98 31000 519 1,386 34.40 31000 519 1,386 34.21 31000 522 1,402 34.61 31000 519 1,393 35.25 31325 543 1,403 35.23 31000 537 1,391 35.00 31000 537 1,380 34.52 30300 520 1,386 33.82 30575 523 1,386 34.35 30575 526 1,393 34.81 30775 537 1,402 34.96 30550 534 1,401 36.69 30750 536 1,424 36.42 31025 557 1,408 36.44 31000 554 1,392 37.41 30850 550 1,395 36.40 30600 549 1,377 36.15 31150 575 1,370 35.78 31800 595 1,371 36.95 32500 636 1,363 36.14 32325 628 1,361 36.36 31800 594 1,348 37.31 31850 590 1,365 37.58 31625 590 1,367 38.00 31750 605 1,365 37.23 31650 618 1,350 37.00 31525 630 1,334 37.87 32075 638 1,332 37.70 32725 645 1,323 36.17 32900 640 1,315 36.56 32775 640 1,300 37.70 32825 634 1,312 38.77 33200 647 1,316 39.02 34100 682 1,325 39.88 33800 679 1,328 39.56 33525 677 1,336 38.52 33775 697 1,320 37.20 34000 702 1,321 38.58 33425 679 1,324 39.41 33550 685 1,327 39.08 33400 695 1,344 38.81 33300 685 1,336 38.73 33400 688 1,324 38.70 33000 685 1,326 39.23 33500 694 1,315 39.82 33550 694 1,316 39.97 33725 697 1,311 40.37 33700 700 1,306 39.54 33600 695 1,310 39.21 33550 693 1,314 39.07 33500 693 1,320 39.78 34200 722 1,314 39.40 34000 725 1,328 38.92 33600 715 1,336 | |||||||||||||||||||||||||||||||||||||||||||||||||||||||||||||||||||||||||||||||||||||||||||||||||||||||||||||||||||||||||||||||||||||||||||||||||||||||||||||||||||||||||||||||||||||||||||||||||
Tables (Output of Computation) | |||||||||||||||||||||||||||||||||||||||||||||||||||||||||||||||||||||||||||||||||||||||||||||||||||||||||||||||||||||||||||||||||||||||||||||||||||||||||||||||||||||||||||||||||||||||||||||||||
| |||||||||||||||||||||||||||||||||||||||||||||||||||||||||||||||||||||||||||||||||||||||||||||||||||||||||||||||||||||||||||||||||||||||||||||||||||||||||||||||||||||||||||||||||||||||||||||||||
Figures (Output of Computation) | |||||||||||||||||||||||||||||||||||||||||||||||||||||||||||||||||||||||||||||||||||||||||||||||||||||||||||||||||||||||||||||||||||||||||||||||||||||||||||||||||||||||||||||||||||||||||||||||||
Input Parameters & R Code | |||||||||||||||||||||||||||||||||||||||||||||||||||||||||||||||||||||||||||||||||||||||||||||||||||||||||||||||||||||||||||||||||||||||||||||||||||||||||||||||||||||||||||||||||||||||||||||||||
| Parameters (Session): | |||||||||||||||||||||||||||||||||||||||||||||||||||||||||||||||||||||||||||||||||||||||||||||||||||||||||||||||||||||||||||||||||||||||||||||||||||||||||||||||||||||||||||||||||||||||||||||||||
| par1 = Valutakoersen Eur-Dollar ; par4 = 12 ; | |||||||||||||||||||||||||||||||||||||||||||||||||||||||||||||||||||||||||||||||||||||||||||||||||||||||||||||||||||||||||||||||||||||||||||||||||||||||||||||||||||||||||||||||||||||||||||||||||
| Parameters (R input): | |||||||||||||||||||||||||||||||||||||||||||||||||||||||||||||||||||||||||||||||||||||||||||||||||||||||||||||||||||||||||||||||||||||||||||||||||||||||||||||||||||||||||||||||||||||||||||||||||
| par1 = pearson ; | |||||||||||||||||||||||||||||||||||||||||||||||||||||||||||||||||||||||||||||||||||||||||||||||||||||||||||||||||||||||||||||||||||||||||||||||||||||||||||||||||||||||||||||||||||||||||||||||||
| R code (references can be found in the software module): | |||||||||||||||||||||||||||||||||||||||||||||||||||||||||||||||||||||||||||||||||||||||||||||||||||||||||||||||||||||||||||||||||||||||||||||||||||||||||||||||||||||||||||||||||||||||||||||||||
panel.tau <- function(x, y, digits=2, prefix='', cex.cor) | |||||||||||||||||||||||||||||||||||||||||||||||||||||||||||||||||||||||||||||||||||||||||||||||||||||||||||||||||||||||||||||||||||||||||||||||||||||||||||||||||||||||||||||||||||||||||||||||||