Free Statistics
of Irreproducible Research!
Description of Statistical Computation | |||||||||||||||||||||||||||||||||||||||||||||||||||||||||||||||||||||||||||||||||||||||||||||||||||
|---|---|---|---|---|---|---|---|---|---|---|---|---|---|---|---|---|---|---|---|---|---|---|---|---|---|---|---|---|---|---|---|---|---|---|---|---|---|---|---|---|---|---|---|---|---|---|---|---|---|---|---|---|---|---|---|---|---|---|---|---|---|---|---|---|---|---|---|---|---|---|---|---|---|---|---|---|---|---|---|---|---|---|---|---|---|---|---|---|---|---|---|---|---|---|---|---|---|---|---|
| Author's title | |||||||||||||||||||||||||||||||||||||||||||||||||||||||||||||||||||||||||||||||||||||||||||||||||||
| Author | *The author of this computation has been verified* | ||||||||||||||||||||||||||||||||||||||||||||||||||||||||||||||||||||||||||||||||||||||||||||||||||
| R Software Module | rwasp_correlation.wasp | ||||||||||||||||||||||||||||||||||||||||||||||||||||||||||||||||||||||||||||||||||||||||||||||||||
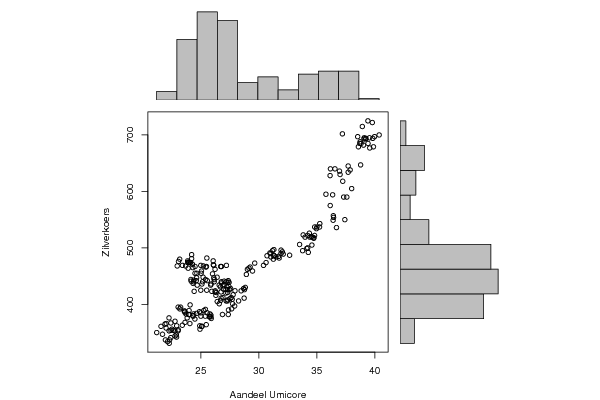
| Title produced by software | Pearson Correlation | ||||||||||||||||||||||||||||||||||||||||||||||||||||||||||||||||||||||||||||||||||||||||||||||||||
| Date of computation | Fri, 23 Dec 2011 03:37:15 -0500 | ||||||||||||||||||||||||||||||||||||||||||||||||||||||||||||||||||||||||||||||||||||||||||||||||||
| Cite this page as follows | Statistical Computations at FreeStatistics.org, Office for Research Development and Education, URL https://freestatistics.org/blog/index.php?v=date/2011/Dec/23/t1324629462c74kdfms0cye7zk.htm/, Retrieved Mon, 29 Apr 2024 18:09:40 +0000 | ||||||||||||||||||||||||||||||||||||||||||||||||||||||||||||||||||||||||||||||||||||||||||||||||||
| Statistical Computations at FreeStatistics.org, Office for Research Development and Education, URL https://freestatistics.org/blog/index.php?pk=160194, Retrieved Mon, 29 Apr 2024 18:09:40 +0000 | |||||||||||||||||||||||||||||||||||||||||||||||||||||||||||||||||||||||||||||||||||||||||||||||||||
| QR Codes: | |||||||||||||||||||||||||||||||||||||||||||||||||||||||||||||||||||||||||||||||||||||||||||||||||||
|
| |||||||||||||||||||||||||||||||||||||||||||||||||||||||||||||||||||||||||||||||||||||||||||||||||||
| Original text written by user: | |||||||||||||||||||||||||||||||||||||||||||||||||||||||||||||||||||||||||||||||||||||||||||||||||||
| IsPrivate? | No (this computation is public) | ||||||||||||||||||||||||||||||||||||||||||||||||||||||||||||||||||||||||||||||||||||||||||||||||||
| User-defined keywords | |||||||||||||||||||||||||||||||||||||||||||||||||||||||||||||||||||||||||||||||||||||||||||||||||||
| Estimated Impact | 130 | ||||||||||||||||||||||||||||||||||||||||||||||||||||||||||||||||||||||||||||||||||||||||||||||||||
Tree of Dependent Computations | |||||||||||||||||||||||||||||||||||||||||||||||||||||||||||||||||||||||||||||||||||||||||||||||||||
| Family? (F = Feedback message, R = changed R code, M = changed R Module, P = changed Parameters, D = changed Data) | |||||||||||||||||||||||||||||||||||||||||||||||||||||||||||||||||||||||||||||||||||||||||||||||||||
| - [Pearson Correlation] [Connected vs Sepa...] [2010-10-04 07:35:56] [b98453cac15ba1066b407e146608df68] - R PD [Pearson Correlation] [Paper: Scatterplot] [2011-12-21 15:12:04] [f722e8e78b9e5c5ebaa2263f273aa636] - PD [Pearson Correlation] [Paper: Scatterplo...] [2011-12-22 21:49:19] [f722e8e78b9e5c5ebaa2263f273aa636] - PD [Pearson Correlation] [Paper: Scatterplo...] [2011-12-23 08:36:11] [f722e8e78b9e5c5ebaa2263f273aa636] - D [Pearson Correlation] [Paper: Scatterplo...] [2011-12-23 08:37:15] [3e64eea457df40fcb7af8f28e1ee6256] [Current] - D [Pearson Correlation] [Paper: Scatterplo...] [2011-12-23 08:38:29] [f722e8e78b9e5c5ebaa2263f273aa636] - RM D [Kendall tau Correlation Matrix] [Paper: Kendall ta...] [2011-12-23 08:54:00] [f722e8e78b9e5c5ebaa2263f273aa636] - RM [Kendall tau Correlation Matrix] [Paper: Pearson Co...] [2011-12-23 08:55:08] [f722e8e78b9e5c5ebaa2263f273aa636] | |||||||||||||||||||||||||||||||||||||||||||||||||||||||||||||||||||||||||||||||||||||||||||||||||||
| Feedback Forum | |||||||||||||||||||||||||||||||||||||||||||||||||||||||||||||||||||||||||||||||||||||||||||||||||||
Post a new message | |||||||||||||||||||||||||||||||||||||||||||||||||||||||||||||||||||||||||||||||||||||||||||||||||||
Dataset | |||||||||||||||||||||||||||||||||||||||||||||||||||||||||||||||||||||||||||||||||||||||||||||||||||
| Dataseries X: | |||||||||||||||||||||||||||||||||||||||||||||||||||||||||||||||||||||||||||||||||||||||||||||||||||
24.90 25.06 25.10 24.92 25.46 25.89 25.39 25.38 25.25 24.88 25.00 25.00 24.07 23.60 23.18 23.25 23.04 22.77 22.25 22.41 22.50 22.91 22.88 21.69 21.19 21.56 22.00 22.13 22.27 22.30 21.94 22.40 22.77 22.90 23.03 23.05 22.41 22.26 21.90 22.01 22.62 22.76 23.40 23.63 24.05 23.82 23.71 23.95 23.61 23.98 23.56 23.99 24.33 24.48 24.31 24.38 24.63 25.54 25.75 25.73 25.85 25.78 25.86 26.86 27.36 27.38 26.58 27.65 27.73 27.18 27.32 27.30 26.90 26.70 26.75 26.41 26.29 27.51 27.91 27.70 27.28 28.25 27.62 27.30 25.94 24.99 25.50 24.42 26.58 25.84 26.76 26.74 26.68 25.55 26.40 25.19 23.94 24.20 24.20 23.07 24.07 25.02 24.65 24.68 24.63 24.49 25.05 24.31 23.90 23.68 24.50 25.22 25.48 26.00 26.07 26.06 26.22 26.70 27.20 26.77 26.11 25.43 24.99 25.51 24.00 23.86 22.96 23.41 23.17 24.12 23.87 24.27 24.40 24.16 25.15 25.09 24.60 24.33 24.14 24.36 25.40 26.15 26.77 26.94 26.33 26.24 26.23 25.88 27.00 26.91 27.15 27.78 28.73 28.83 28.68 27.56 27.15 27.41 27.47 28.76 28.47 27.94 27.23 27.01 26.15 26.11 27.20 27.36 27.33 27.43 28.92 29.45 29.01 29.25 29.14 29.64 30.40 30.62 31.25 31.75 31.30 30.70 31.03 31.46 31.28 31.03 30.95 31.17 31.29 31.91 32.10 31.71 31.90 32.02 32.65 33.77 33.51 34.26 34.21 34.13 34.73 34.73 34.57 34.80 33.98 34.40 34.21 34.61 35.25 35.23 35.00 34.52 33.82 34.35 34.81 34.96 36.69 36.42 36.44 37.41 36.40 36.15 35.78 36.95 36.14 36.36 37.31 37.58 38.00 37.23 37.00 37.87 37.70 36.17 36.56 37.70 38.77 39.02 39.88 39.56 38.52 37.20 38.58 39.41 39.08 38.81 38.73 38.70 39.23 39.82 39.97 40.37 39.54 39.21 39.07 39.78 39.40 38.92 | |||||||||||||||||||||||||||||||||||||||||||||||||||||||||||||||||||||||||||||||||||||||||||||||||||
| Dataseries Y: | |||||||||||||||||||||||||||||||||||||||||||||||||||||||||||||||||||||||||||||||||||||||||||||||||||
362 361 361 356 364 375 391 379 389 387 379 385 399 388 392 395 395 370 376 367 356 362 346 347 350 361 358 334 331 337 337 341 344 342 353 355 354 353 365 366 354 353 363 368 366 376 383 382 386 389 388 382 379 374 380 383 384 385 378 378 378 383 381 382 382 390 401 392 401 406 408 421 412 407 411 405 416 410 397 409 406 406 412 426 423 425 425 423 434 434 440 422 431 442 448 448 475 481 488 476 474 455 455 434 447 455 459 465 464 468 467 468 467 454 470 477 462 467 469 467 469 466 469 482 474 477 468 469 480 474 474 471 443 441 440 436 442 437 444 440 444 440 438 427 421 424 422 436 435 433 420 417 411 430 428 428 426 432 426 426 424 424 431 441 444 447 440 442 439 439 453 459 462 466 464 473 469 474 480 482 486 486 484 484 487 490 491 495 497 496 489 485 490 493 487 495 506 492 500 499 518 517 505 522 519 519 522 519 543 537 537 520 523 526 537 534 536 557 554 550 549 575 595 636 628 594 590 590 605 618 630 638 645 640 640 634 647 682 679 677 697 702 679 685 695 685 688 685 694 694 697 700 695 693 693 722 725 715 | |||||||||||||||||||||||||||||||||||||||||||||||||||||||||||||||||||||||||||||||||||||||||||||||||||
Tables (Output of Computation) | |||||||||||||||||||||||||||||||||||||||||||||||||||||||||||||||||||||||||||||||||||||||||||||||||||
| |||||||||||||||||||||||||||||||||||||||||||||||||||||||||||||||||||||||||||||||||||||||||||||||||||
Figures (Output of Computation) | |||||||||||||||||||||||||||||||||||||||||||||||||||||||||||||||||||||||||||||||||||||||||||||||||||
Input Parameters & R Code | |||||||||||||||||||||||||||||||||||||||||||||||||||||||||||||||||||||||||||||||||||||||||||||||||||
| Parameters (Session): | |||||||||||||||||||||||||||||||||||||||||||||||||||||||||||||||||||||||||||||||||||||||||||||||||||
| par1 = Valutakoersen Eur-Dollar ; par4 = 12 ; | |||||||||||||||||||||||||||||||||||||||||||||||||||||||||||||||||||||||||||||||||||||||||||||||||||
| Parameters (R input): | |||||||||||||||||||||||||||||||||||||||||||||||||||||||||||||||||||||||||||||||||||||||||||||||||||
| R code (references can be found in the software module): | |||||||||||||||||||||||||||||||||||||||||||||||||||||||||||||||||||||||||||||||||||||||||||||||||||
bitmap(file='test1.png') | |||||||||||||||||||||||||||||||||||||||||||||||||||||||||||||||||||||||||||||||||||||||||||||||||||