Free Statistics
of Irreproducible Research!
Description of Statistical Computation | |||||||||||||||||||||||||||||||||||||||||||||||||||||||||||||||||||||||||||||||||||||||||||||||||||
|---|---|---|---|---|---|---|---|---|---|---|---|---|---|---|---|---|---|---|---|---|---|---|---|---|---|---|---|---|---|---|---|---|---|---|---|---|---|---|---|---|---|---|---|---|---|---|---|---|---|---|---|---|---|---|---|---|---|---|---|---|---|---|---|---|---|---|---|---|---|---|---|---|---|---|---|---|---|---|---|---|---|---|---|---|---|---|---|---|---|---|---|---|---|---|---|---|---|---|---|
| Author's title | |||||||||||||||||||||||||||||||||||||||||||||||||||||||||||||||||||||||||||||||||||||||||||||||||||
| Author | *The author of this computation has been verified* | ||||||||||||||||||||||||||||||||||||||||||||||||||||||||||||||||||||||||||||||||||||||||||||||||||
| R Software Module | rwasp_correlation.wasp | ||||||||||||||||||||||||||||||||||||||||||||||||||||||||||||||||||||||||||||||||||||||||||||||||||
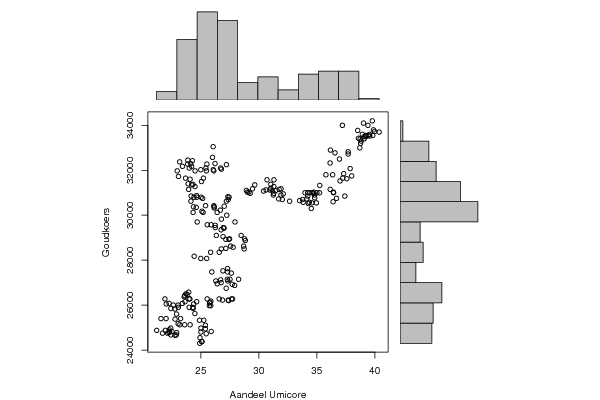
| Title produced by software | Pearson Correlation | ||||||||||||||||||||||||||||||||||||||||||||||||||||||||||||||||||||||||||||||||||||||||||||||||||
| Date of computation | Fri, 23 Dec 2011 03:36:11 -0500 | ||||||||||||||||||||||||||||||||||||||||||||||||||||||||||||||||||||||||||||||||||||||||||||||||||
| Cite this page as follows | Statistical Computations at FreeStatistics.org, Office for Research Development and Education, URL https://freestatistics.org/blog/index.php?v=date/2011/Dec/23/t1324629386cbmf65veeer0vuk.htm/, Retrieved Mon, 29 Apr 2024 22:41:32 +0000 | ||||||||||||||||||||||||||||||||||||||||||||||||||||||||||||||||||||||||||||||||||||||||||||||||||
| Statistical Computations at FreeStatistics.org, Office for Research Development and Education, URL https://freestatistics.org/blog/index.php?pk=160193, Retrieved Mon, 29 Apr 2024 22:41:32 +0000 | |||||||||||||||||||||||||||||||||||||||||||||||||||||||||||||||||||||||||||||||||||||||||||||||||||
| QR Codes: | |||||||||||||||||||||||||||||||||||||||||||||||||||||||||||||||||||||||||||||||||||||||||||||||||||
|
| |||||||||||||||||||||||||||||||||||||||||||||||||||||||||||||||||||||||||||||||||||||||||||||||||||
| Original text written by user: | |||||||||||||||||||||||||||||||||||||||||||||||||||||||||||||||||||||||||||||||||||||||||||||||||||
| IsPrivate? | No (this computation is public) | ||||||||||||||||||||||||||||||||||||||||||||||||||||||||||||||||||||||||||||||||||||||||||||||||||
| User-defined keywords | |||||||||||||||||||||||||||||||||||||||||||||||||||||||||||||||||||||||||||||||||||||||||||||||||||
| Estimated Impact | 134 | ||||||||||||||||||||||||||||||||||||||||||||||||||||||||||||||||||||||||||||||||||||||||||||||||||
Tree of Dependent Computations | |||||||||||||||||||||||||||||||||||||||||||||||||||||||||||||||||||||||||||||||||||||||||||||||||||
| Family? (F = Feedback message, R = changed R code, M = changed R Module, P = changed Parameters, D = changed Data) | |||||||||||||||||||||||||||||||||||||||||||||||||||||||||||||||||||||||||||||||||||||||||||||||||||
| - [Pearson Correlation] [Connected vs Sepa...] [2010-10-04 07:35:56] [b98453cac15ba1066b407e146608df68] - R PD [Pearson Correlation] [Paper: Scatterplot] [2011-12-21 15:12:04] [f722e8e78b9e5c5ebaa2263f273aa636] - PD [Pearson Correlation] [Paper: Scatterplo...] [2011-12-22 21:49:19] [f722e8e78b9e5c5ebaa2263f273aa636] - PD [Pearson Correlation] [Paper: Scatterplo...] [2011-12-23 08:36:11] [3e64eea457df40fcb7af8f28e1ee6256] [Current] - D [Pearson Correlation] [Paper: Scatterplo...] [2011-12-23 08:37:15] [f722e8e78b9e5c5ebaa2263f273aa636] - D [Pearson Correlation] [Paper: Scatterplo...] [2011-12-23 08:38:29] [f722e8e78b9e5c5ebaa2263f273aa636] - RM D [Kendall tau Correlation Matrix] [Paper: Kendall ta...] [2011-12-23 08:54:00] [f722e8e78b9e5c5ebaa2263f273aa636] - RM [Kendall tau Correlation Matrix] [Paper: Pearson Co...] [2011-12-23 08:55:08] [f722e8e78b9e5c5ebaa2263f273aa636] | |||||||||||||||||||||||||||||||||||||||||||||||||||||||||||||||||||||||||||||||||||||||||||||||||||
| Feedback Forum | |||||||||||||||||||||||||||||||||||||||||||||||||||||||||||||||||||||||||||||||||||||||||||||||||||
Post a new message | |||||||||||||||||||||||||||||||||||||||||||||||||||||||||||||||||||||||||||||||||||||||||||||||||||
Dataset | |||||||||||||||||||||||||||||||||||||||||||||||||||||||||||||||||||||||||||||||||||||||||||||||||||
| Dataseries X: | |||||||||||||||||||||||||||||||||||||||||||||||||||||||||||||||||||||||||||||||||||||||||||||||||||
24.90 25.06 25.10 24.92 25.46 25.89 25.39 25.38 25.25 24.88 25.00 25.00 24.07 23.60 23.18 23.25 23.04 22.77 22.25 22.41 22.50 22.91 22.88 21.69 21.19 21.56 22.00 22.13 22.27 22.30 21.94 22.40 22.77 22.90 23.03 23.05 22.41 22.26 21.90 22.01 22.62 22.76 23.40 23.63 24.05 23.82 23.71 23.95 23.61 23.98 23.56 23.99 24.33 24.48 24.31 24.38 24.63 25.54 25.75 25.73 25.85 25.78 25.86 26.86 27.36 27.38 26.58 27.65 27.73 27.18 27.32 27.30 26.90 26.70 26.75 26.41 26.29 27.51 27.91 27.70 27.28 28.25 27.62 27.30 25.94 24.99 25.50 24.42 26.58 25.84 26.76 26.74 26.68 25.55 26.40 25.19 23.94 24.20 24.20 23.07 24.07 25.02 24.65 24.68 24.63 24.49 25.05 24.31 23.90 23.68 24.50 25.22 25.48 26.00 26.07 26.06 26.22 26.70 27.20 26.77 26.11 25.43 24.99 25.51 24.00 23.86 22.96 23.41 23.17 24.12 23.87 24.27 24.40 24.16 25.15 25.09 24.60 24.33 24.14 24.36 25.40 26.15 26.77 26.94 26.33 26.24 26.23 25.88 27.00 26.91 27.15 27.78 28.73 28.83 28.68 27.56 27.15 27.41 27.47 28.76 28.47 27.94 27.23 27.01 26.15 26.11 27.20 27.36 27.33 27.43 28.92 29.45 29.01 29.25 29.14 29.64 30.40 30.62 31.25 31.75 31.30 30.70 31.03 31.46 31.28 31.03 30.95 31.17 31.29 31.91 32.10 31.71 31.90 32.02 32.65 33.77 33.51 34.26 34.21 34.13 34.73 34.73 34.57 34.80 33.98 34.40 34.21 34.61 35.25 35.23 35.00 34.52 33.82 34.35 34.81 34.96 36.69 36.42 36.44 37.41 36.40 36.15 35.78 36.95 36.14 36.36 37.31 37.58 38.00 37.23 37.00 37.87 37.70 36.17 36.56 37.70 38.77 39.02 39.88 39.56 38.52 37.20 38.58 39.41 39.08 38.81 38.73 38.70 39.23 39.82 39.97 40.37 39.54 39.21 39.07 39.78 39.40 38.92 | |||||||||||||||||||||||||||||||||||||||||||||||||||||||||||||||||||||||||||||||||||||||||||||||||||
| Dataseries Y: | |||||||||||||||||||||||||||||||||||||||||||||||||||||||||||||||||||||||||||||||||||||||||||||||||||
24300 24375 24375 24550 24725 24825 25100 24950 25325 25325 24800 24975 25125 25125 25125 25400 25175 24650 24775 24675 24825 24775 24675 24750 24875 25400 25400 24750 24900 24825 24875 24975 25375 25600 26000 25900 25850 26075 26275 26050 26000 25825 26075 26150 26275 26475 26500 26575 26425 26275 26375 25900 25850 25625 25900 26050 26150 26275 26100 25975 25975 26125 26175 26225 26225 26200 26275 26275 26275 26750 27075 27475 27525 27125 27000 26950 27075 27150 26875 26925 27150 27150 27425 27625 27475 28075 28075 28175 28350 28350 28500 29350 30225 29575 30125 30125 31150 31350 32175 31725 31600 30800 30800 29700 30875 31275 31500 31375 31400 31650 31975 31650 31975 32575 32025 33050 32300 32100 32250 32050 31975 32100 32025 32275 32100 32275 31975 32175 32375 32300 32450 32425 30800 30850 30750 30175 30350 30125 30625 30375 30425 30325 29825 29450 29100 29450 29550 29575 29425 29050 28525 28575 28500 28875 28625 28625 28925 28925 28950 28950 29100 29700 30000 30400 30375 30425 30625 30700 30825 30800 31100 31175 31025 30975 31025 31350 31075 31125 30900 31150 31575 31575 31375 31100 30975 31200 31125 31075 31275 31175 30950 30725 30900 30700 30625 30700 30650 30525 30850 30725 31025 30975 30550 30900 31000 31000 31000 31000 31325 31000 31000 30300 30575 30575 30775 30550 30750 31025 31000 30850 30600 31150 31800 32500 32325 31800 31850 31625 31750 31650 31525 32075 32725 32900 32775 32825 33200 34100 33800 33525 33775 34000 33425 33550 33400 33300 33400 33000 33500 33550 33725 33700 33600 33550 33500 34200 34000 33600 | |||||||||||||||||||||||||||||||||||||||||||||||||||||||||||||||||||||||||||||||||||||||||||||||||||
Tables (Output of Computation) | |||||||||||||||||||||||||||||||||||||||||||||||||||||||||||||||||||||||||||||||||||||||||||||||||||
| |||||||||||||||||||||||||||||||||||||||||||||||||||||||||||||||||||||||||||||||||||||||||||||||||||
Figures (Output of Computation) | |||||||||||||||||||||||||||||||||||||||||||||||||||||||||||||||||||||||||||||||||||||||||||||||||||
Input Parameters & R Code | |||||||||||||||||||||||||||||||||||||||||||||||||||||||||||||||||||||||||||||||||||||||||||||||||||
| Parameters (Session): | |||||||||||||||||||||||||||||||||||||||||||||||||||||||||||||||||||||||||||||||||||||||||||||||||||
| par1 = Valutakoersen Eur-Dollar ; par4 = 12 ; | |||||||||||||||||||||||||||||||||||||||||||||||||||||||||||||||||||||||||||||||||||||||||||||||||||
| Parameters (R input): | |||||||||||||||||||||||||||||||||||||||||||||||||||||||||||||||||||||||||||||||||||||||||||||||||||
| R code (references can be found in the software module): | |||||||||||||||||||||||||||||||||||||||||||||||||||||||||||||||||||||||||||||||||||||||||||||||||||
bitmap(file='test1.png') | |||||||||||||||||||||||||||||||||||||||||||||||||||||||||||||||||||||||||||||||||||||||||||||||||||