| Multiple Linear Regression - Estimated Regression Equation |
| X5[t] = + 0.822382366636281 -4.4504311416862e-06Y[t] + 0.0105913466602133X1[t] -0.221866252035594X2[t] + 0.0667948630590553X3[t] -2.92105665097489e-05X4[t] + 1.04519097864273X6[t] + e[t] |
| Multiple Linear Regression - Ordinary Least Squares | |||||
| Variable | Parameter | S.D. | T-STAT H0: parameter = 0 | 2-tail p-value | 1-tail p-value |
| (Intercept) | 0.822382366636281 | 1.479106 | 0.556 | 0.581233 | 0.290616 |
| Y | -4.4504311416862e-06 | 9e-06 | -0.4954 | 0.622963 | 0.311481 |
| X1 | 0.0105913466602133 | 0.02759 | 0.3839 | 0.703044 | 0.351522 |
| X2 | -0.221866252035594 | 0.104961 | -2.1138 | 0.040661 | 0.020331 |
| X3 | 0.0667948630590553 | 0.030118 | 2.2178 | 0.032169 | 0.016085 |
| X4 | -2.92105665097489e-05 | 2.5e-05 | -1.1552 | 0.254709 | 0.127354 |
| X6 | 1.04519097864273 | 0.026359 | 39.6521 | 0 | 0 |
| Multiple Linear Regression - Regression Statistics | |
| Multiple R | 0.998071940196716 |
| R-squared | 0.996147597808037 |
| Adjusted R-squared | 0.995583831633603 |
| F-TEST (value) | 1766.95169554782 |
| F-TEST (DF numerator) | 6 |
| F-TEST (DF denominator) | 41 |
| p-value | 0 |
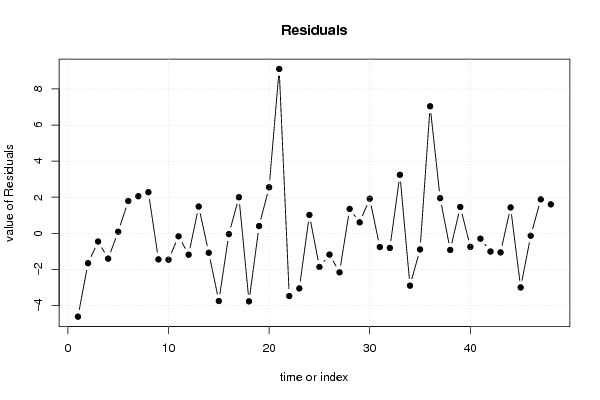
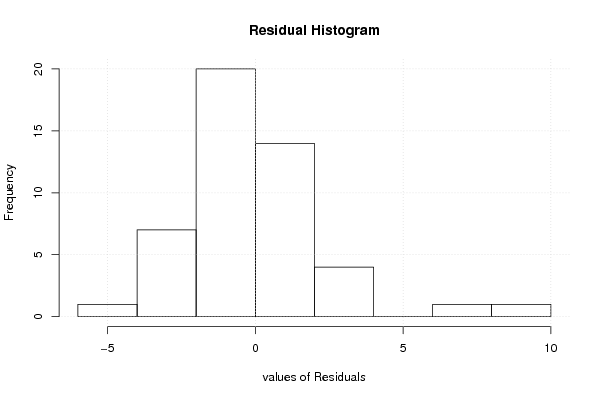
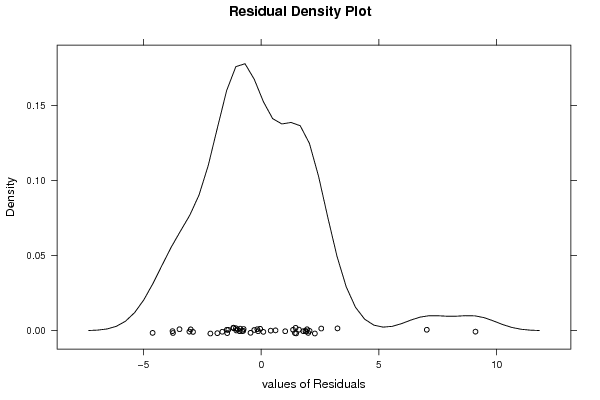
| Multiple Linear Regression - Residual Statistics | |
| Residual Standard Deviation | 2.72631923434946 |
| Sum Squared Residuals | 304.745479270938 |
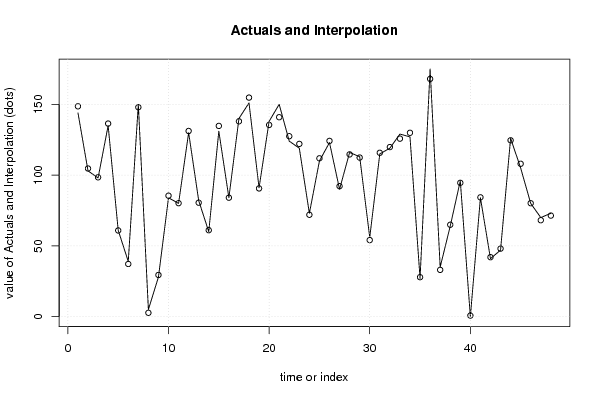
| Multiple Linear Regression - Actuals, Interpolation, and Residuals | |||
| Time or Index | Actuals | Interpolation Forecast | Residuals Prediction Error |
| 1 | 144 | 148.615984681125 | -4.61598468112516 |
| 2 | 103 | 104.653516001451 | -1.65351600145106 |
| 3 | 98 | 98.4539771404292 | -0.45397714042923 |
| 4 | 135 | 136.401379701215 | -1.40137970121476 |
| 5 | 61 | 60.90952464071 | 0.090475359290019 |
| 6 | 39 | 37.2109743270851 | 1.7890256729149 |
| 7 | 150 | 147.945946217015 | 2.05405378298484 |
| 8 | 5 | 2.72099686581108 | 2.27900313418892 |
| 9 | 28 | 29.4441995423157 | -1.44419954231565 |
| 10 | 84 | 85.4603581204667 | -1.46035812046672 |
| 11 | 80 | 80.1644510501631 | -0.16445105016307 |
| 12 | 130 | 131.183231068445 | -1.18323106844525 |
| 13 | 82 | 80.5158568993419 | 1.48414310065807 |
| 14 | 60 | 61.0747538338747 | -1.07475383387467 |
| 15 | 131 | 134.749902286143 | -3.74990228614276 |
| 16 | 84 | 84.0432852064716 | -0.0432852064716211 |
| 17 | 140 | 138.001605252418 | 1.9983947475817 |
| 18 | 151 | 154.769803982302 | -3.7698039823015 |
| 19 | 91 | 90.5967637421903 | 0.403236257809663 |
| 20 | 138 | 135.448018980771 | 2.55198101922894 |
| 21 | 150 | 140.893531446089 | 9.1064685539106 |
| 22 | 124 | 127.47274169288 | -3.47274169287999 |
| 23 | 119 | 122.051601471166 | -3.05160147116553 |
| 24 | 73 | 71.9795130164996 | 1.02048698350044 |
| 25 | 110 | 111.86442976006 | -1.86442976006048 |
| 26 | 123 | 124.178377658782 | -1.17837765878167 |
| 27 | 90 | 92.160824389705 | -2.16082438970496 |
| 28 | 116 | 114.64641535909 | 1.35358464090963 |
| 29 | 113 | 112.391373393008 | 0.608626606991689 |
| 30 | 56 | 54.0807916150248 | 1.91920838497518 |
| 31 | 115 | 115.760345864202 | -0.760345864202308 |
| 32 | 119 | 119.808917487989 | -0.808917487989119 |
| 33 | 129 | 125.757939195993 | 3.24206080400651 |
| 34 | 127 | 129.898102433784 | -2.89810243378403 |
| 35 | 27 | 27.8943533576387 | -0.894353357638746 |
| 36 | 175 | 167.962560725749 | 7.03743927425124 |
| 37 | 35 | 33.0520946471237 | 1.94790535287628 |
| 38 | 64 | 64.921973178507 | -0.921973178507033 |
| 39 | 96 | 94.5378118501347 | 1.46218814986532 |
| 40 | 0 | 0.748879436620154 | -0.748879436620154 |
| 41 | 84 | 84.2958270405348 | -0.295827040534832 |
| 42 | 41 | 42.0085542408478 | -1.00855424084778 |
| 43 | 47 | 48.056213615713 | -1.05621361571298 |
| 44 | 126 | 124.566905241573 | 1.43309475842658 |
| 45 | 105 | 107.99815339001 | -2.99815339001022 |
| 46 | 80 | 80.1326478753214 | -0.132647875321407 |
| 47 | 70 | 68.1187005719673 | 1.88129942803268 |
| 48 | 73 | 71.3958905042405 | 1.6041094957595 |
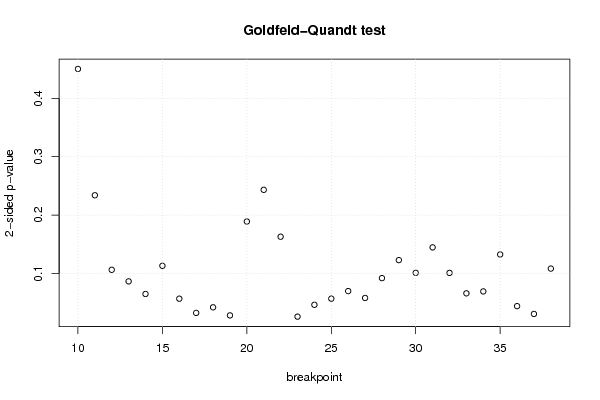
| Goldfeld-Quandt test for Heteroskedasticity | |||
| p-values | Alternative Hypothesis | ||
| breakpoint index | greater | 2-sided | less |
| 10 | 0.225239398631372 | 0.450478797262743 | 0.774760601368628 |
| 11 | 0.116934173229176 | 0.233868346458353 | 0.883065826770824 |
| 12 | 0.0530271906753877 | 0.106054381350775 | 0.946972809324612 |
| 13 | 0.043092431958987 | 0.0861848639179741 | 0.956907568041013 |
| 14 | 0.0322857247061832 | 0.0645714494123663 | 0.967714275293817 |
| 15 | 0.0564218675707825 | 0.112843735141565 | 0.943578132429218 |
| 16 | 0.0282442869252096 | 0.0564885738504191 | 0.97175571307479 |
| 17 | 0.016036479972045 | 0.0320729599440901 | 0.983963520027955 |
| 18 | 0.0208408458786152 | 0.0416816917572303 | 0.979159154121385 |
| 19 | 0.0139195776282065 | 0.0278391552564131 | 0.986080422371793 |
| 20 | 0.0944244239331796 | 0.188848847866359 | 0.90557557606682 |
| 21 | 0.878393032823772 | 0.243213934352456 | 0.121606967176228 |
| 22 | 0.918607370089518 | 0.162785259820965 | 0.0813926299104823 |
| 23 | 0.987158207295458 | 0.0256835854090834 | 0.0128417927045417 |
| 24 | 0.976978421203681 | 0.0460431575926374 | 0.0230215787963187 |
| 25 | 0.971739217080743 | 0.0565215658385143 | 0.0282607829192571 |
| 26 | 0.965225944381653 | 0.0695481112366945 | 0.0347740556183473 |
| 27 | 0.971132077733105 | 0.0577358445337891 | 0.0288679222668946 |
| 28 | 0.954119379994273 | 0.091761240011454 | 0.045880620005727 |
| 29 | 0.938672631854101 | 0.122654736291798 | 0.061327368145899 |
| 30 | 0.949584293135122 | 0.100831413729757 | 0.0504157068648784 |
| 31 | 0.92776566689346 | 0.144468666213081 | 0.0722343331065405 |
| 32 | 0.949659818447875 | 0.10068036310425 | 0.0503401815521249 |
| 33 | 0.967167183454304 | 0.0656656330913912 | 0.0328328165456956 |
| 34 | 0.965522163884748 | 0.0689556722305042 | 0.0344778361152521 |
| 35 | 0.933819686089202 | 0.132360627821595 | 0.0661803139107976 |
| 36 | 0.978146112840611 | 0.0437077743187776 | 0.0218538871593888 |
| 37 | 0.984833860534761 | 0.0303322789304774 | 0.0151661394652387 |
| 38 | 0.945945978633163 | 0.108108042733674 | 0.054054021366837 |
| Meta Analysis of Goldfeld-Quandt test for Heteroskedasticity | |||
| Description | # significant tests | % significant tests | OK/NOK |
| 1% type I error level | 0 | 0 | OK |
| 5% type I error level | 7 | 0.241379310344828 | NOK |
| 10% type I error level | 16 | 0.551724137931034 | NOK |