\begin{tabular}{lllllllll}
\hline
Summary of computational transaction \tabularnewline
Raw Input & view raw input (R code)  \tabularnewline
Raw Output & view raw output of R engine  \tabularnewline
Computing time & 1 seconds \tabularnewline
R Server & 'Gertrude Mary Cox' @ cox.wessa.net \tabularnewline
\hline
\end{tabular}
%Source: https://freestatistics.org/blog/index.php?pk=160183&T=0
[TABLE]
[ROW][C]Summary of computational transaction[/C][/ROW]
[ROW][C]Raw Input[/C][C]view raw input (R code) [/C][/ROW]
[ROW][C]Raw Output[/C][C]view raw output of R engine [/C][/ROW]
[ROW][C]Computing time[/C][C]1 seconds[/C][/ROW]
[ROW][C]R Server[/C][C]'Gertrude Mary Cox' @ cox.wessa.net[/C][/ROW]
[/TABLE]
Source: https://freestatistics.org/blog/index.php?pk=160183&T=0
If you paste this QR Code into your document, anyone with a smartphone or tablet will be able to scan it and view this table in a browser.
If you paste this QR Code into your document, anyone with a smartphone or tablet will be able to scan it and view this table in a browser.
If you paste this QR Code into your document, anyone with a smartphone or tablet will be able to scan it and view this table in a browser.
If you paste this QR Code into your document, anyone with a smartphone or tablet will be able to scan it and view this table in a browser.
If you paste this QR Code into your document, anyone with a smartphone or tablet will be able to scan it and view this table in a browser.
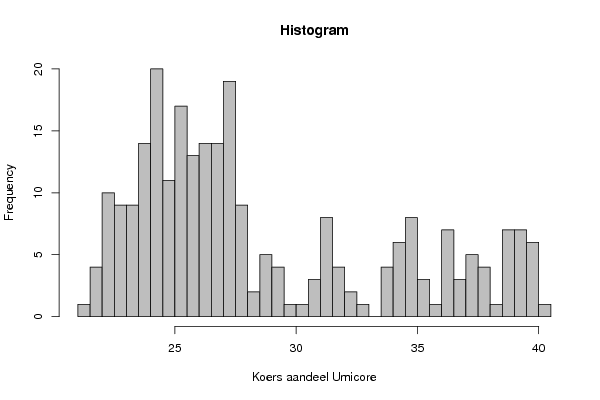
| Frequency Table (Histogram) | | Bins | Midpoint | Abs. Frequency | Rel. Frequency | Cumul. Rel. Freq. | Density | | [21,21.5[ | 21.25 | 1 | 0.003876 | 0.003876 | 0.007752 | | [21.5,22[ | 21.75 | 4 | 0.015504 | 0.01938 | 0.031008 | | [22,22.5[ | 22.25 | 10 | 0.03876 | 0.05814 | 0.077519 | | [22.5,23[ | 22.75 | 9 | 0.034884 | 0.093023 | 0.069767 | | [23,23.5[ | 23.25 | 9 | 0.034884 | 0.127907 | 0.069767 | | [23.5,24[ | 23.75 | 14 | 0.054264 | 0.182171 | 0.108527 | | [24,24.5[ | 24.25 | 20 | 0.077519 | 0.25969 | 0.155039 | | [24.5,25[ | 24.75 | 11 | 0.042636 | 0.302326 | 0.085271 | | [25,25.5[ | 25.25 | 17 | 0.065891 | 0.368217 | 0.131783 | | [25.5,26[ | 25.75 | 13 | 0.050388 | 0.418605 | 0.100775 | | [26,26.5[ | 26.25 | 14 | 0.054264 | 0.472868 | 0.108527 | | [26.5,27[ | 26.75 | 14 | 0.054264 | 0.527132 | 0.108527 | | [27,27.5[ | 27.25 | 19 | 0.073643 | 0.600775 | 0.147287 | | [27.5,28[ | 27.75 | 9 | 0.034884 | 0.635659 | 0.069767 | | [28,28.5[ | 28.25 | 2 | 0.007752 | 0.643411 | 0.015504 | | [28.5,29[ | 28.75 | 5 | 0.01938 | 0.662791 | 0.03876 | | [29,29.5[ | 29.25 | 4 | 0.015504 | 0.678295 | 0.031008 | | [29.5,30[ | 29.75 | 1 | 0.003876 | 0.682171 | 0.007752 | | [30,30.5[ | 30.25 | 1 | 0.003876 | 0.686047 | 0.007752 | | [30.5,31[ | 30.75 | 3 | 0.011628 | 0.697674 | 0.023256 | | [31,31.5[ | 31.25 | 8 | 0.031008 | 0.728682 | 0.062016 | | [31.5,32[ | 31.75 | 4 | 0.015504 | 0.744186 | 0.031008 | | [32,32.5[ | 32.25 | 2 | 0.007752 | 0.751938 | 0.015504 | | [32.5,33[ | 32.75 | 1 | 0.003876 | 0.755814 | 0.007752 | | [33,33.5[ | 33.25 | 0 | 0 | 0.755814 | 0 | | [33.5,34[ | 33.75 | 4 | 0.015504 | 0.771318 | 0.031008 | | [34,34.5[ | 34.25 | 6 | 0.023256 | 0.794574 | 0.046512 | | [34.5,35[ | 34.75 | 8 | 0.031008 | 0.825581 | 0.062016 | | [35,35.5[ | 35.25 | 3 | 0.011628 | 0.837209 | 0.023256 | | [35.5,36[ | 35.75 | 1 | 0.003876 | 0.841085 | 0.007752 | | [36,36.5[ | 36.25 | 7 | 0.027132 | 0.868217 | 0.054264 | | [36.5,37[ | 36.75 | 3 | 0.011628 | 0.879845 | 0.023256 | | [37,37.5[ | 37.25 | 5 | 0.01938 | 0.899225 | 0.03876 | | [37.5,38[ | 37.75 | 4 | 0.015504 | 0.914729 | 0.031008 | | [38,38.5[ | 38.25 | 1 | 0.003876 | 0.918605 | 0.007752 | | [38.5,39[ | 38.75 | 7 | 0.027132 | 0.945736 | 0.054264 | | [39,39.5[ | 39.25 | 7 | 0.027132 | 0.972868 | 0.054264 | | [39.5,40[ | 39.75 | 6 | 0.023256 | 0.996124 | 0.046512 | | [40,40.5] | 40.25 | 1 | 0.003876 | 1 | 0.007752 |
\begin{tabular}{lllllllll}
\hline
Frequency Table (Histogram) \tabularnewline
Bins & Midpoint & Abs. Frequency & Rel. Frequency & Cumul. Rel. Freq. & Density \tabularnewline
[21,21.5[ & 21.25 & 1 & 0.003876 & 0.003876 & 0.007752 \tabularnewline
[21.5,22[ & 21.75 & 4 & 0.015504 & 0.01938 & 0.031008 \tabularnewline
[22,22.5[ & 22.25 & 10 & 0.03876 & 0.05814 & 0.077519 \tabularnewline
[22.5,23[ & 22.75 & 9 & 0.034884 & 0.093023 & 0.069767 \tabularnewline
[23,23.5[ & 23.25 & 9 & 0.034884 & 0.127907 & 0.069767 \tabularnewline
[23.5,24[ & 23.75 & 14 & 0.054264 & 0.182171 & 0.108527 \tabularnewline
[24,24.5[ & 24.25 & 20 & 0.077519 & 0.25969 & 0.155039 \tabularnewline
[24.5,25[ & 24.75 & 11 & 0.042636 & 0.302326 & 0.085271 \tabularnewline
[25,25.5[ & 25.25 & 17 & 0.065891 & 0.368217 & 0.131783 \tabularnewline
[25.5,26[ & 25.75 & 13 & 0.050388 & 0.418605 & 0.100775 \tabularnewline
[26,26.5[ & 26.25 & 14 & 0.054264 & 0.472868 & 0.108527 \tabularnewline
[26.5,27[ & 26.75 & 14 & 0.054264 & 0.527132 & 0.108527 \tabularnewline
[27,27.5[ & 27.25 & 19 & 0.073643 & 0.600775 & 0.147287 \tabularnewline
[27.5,28[ & 27.75 & 9 & 0.034884 & 0.635659 & 0.069767 \tabularnewline
[28,28.5[ & 28.25 & 2 & 0.007752 & 0.643411 & 0.015504 \tabularnewline
[28.5,29[ & 28.75 & 5 & 0.01938 & 0.662791 & 0.03876 \tabularnewline
[29,29.5[ & 29.25 & 4 & 0.015504 & 0.678295 & 0.031008 \tabularnewline
[29.5,30[ & 29.75 & 1 & 0.003876 & 0.682171 & 0.007752 \tabularnewline
[30,30.5[ & 30.25 & 1 & 0.003876 & 0.686047 & 0.007752 \tabularnewline
[30.5,31[ & 30.75 & 3 & 0.011628 & 0.697674 & 0.023256 \tabularnewline
[31,31.5[ & 31.25 & 8 & 0.031008 & 0.728682 & 0.062016 \tabularnewline
[31.5,32[ & 31.75 & 4 & 0.015504 & 0.744186 & 0.031008 \tabularnewline
[32,32.5[ & 32.25 & 2 & 0.007752 & 0.751938 & 0.015504 \tabularnewline
[32.5,33[ & 32.75 & 1 & 0.003876 & 0.755814 & 0.007752 \tabularnewline
[33,33.5[ & 33.25 & 0 & 0 & 0.755814 & 0 \tabularnewline
[33.5,34[ & 33.75 & 4 & 0.015504 & 0.771318 & 0.031008 \tabularnewline
[34,34.5[ & 34.25 & 6 & 0.023256 & 0.794574 & 0.046512 \tabularnewline
[34.5,35[ & 34.75 & 8 & 0.031008 & 0.825581 & 0.062016 \tabularnewline
[35,35.5[ & 35.25 & 3 & 0.011628 & 0.837209 & 0.023256 \tabularnewline
[35.5,36[ & 35.75 & 1 & 0.003876 & 0.841085 & 0.007752 \tabularnewline
[36,36.5[ & 36.25 & 7 & 0.027132 & 0.868217 & 0.054264 \tabularnewline
[36.5,37[ & 36.75 & 3 & 0.011628 & 0.879845 & 0.023256 \tabularnewline
[37,37.5[ & 37.25 & 5 & 0.01938 & 0.899225 & 0.03876 \tabularnewline
[37.5,38[ & 37.75 & 4 & 0.015504 & 0.914729 & 0.031008 \tabularnewline
[38,38.5[ & 38.25 & 1 & 0.003876 & 0.918605 & 0.007752 \tabularnewline
[38.5,39[ & 38.75 & 7 & 0.027132 & 0.945736 & 0.054264 \tabularnewline
[39,39.5[ & 39.25 & 7 & 0.027132 & 0.972868 & 0.054264 \tabularnewline
[39.5,40[ & 39.75 & 6 & 0.023256 & 0.996124 & 0.046512 \tabularnewline
[40,40.5] & 40.25 & 1 & 0.003876 & 1 & 0.007752 \tabularnewline
\hline
\end{tabular}
%Source: https://freestatistics.org/blog/index.php?pk=160183&T=1
[TABLE]
[ROW][C]Frequency Table (Histogram)[/C][/ROW]
[ROW][C]Bins[/C][C]Midpoint[/C][C]Abs. Frequency[/C][C]Rel. Frequency[/C][C]Cumul. Rel. Freq.[/C][C]Density[/C][/ROW]
[ROW][C][21,21.5[[/C][C]21.25[/C][C]1[/C][C]0.003876[/C][C]0.003876[/C][C]0.007752[/C][/ROW]
[ROW][C][21.5,22[[/C][C]21.75[/C][C]4[/C][C]0.015504[/C][C]0.01938[/C][C]0.031008[/C][/ROW]
[ROW][C][22,22.5[[/C][C]22.25[/C][C]10[/C][C]0.03876[/C][C]0.05814[/C][C]0.077519[/C][/ROW]
[ROW][C][22.5,23[[/C][C]22.75[/C][C]9[/C][C]0.034884[/C][C]0.093023[/C][C]0.069767[/C][/ROW]
[ROW][C][23,23.5[[/C][C]23.25[/C][C]9[/C][C]0.034884[/C][C]0.127907[/C][C]0.069767[/C][/ROW]
[ROW][C][23.5,24[[/C][C]23.75[/C][C]14[/C][C]0.054264[/C][C]0.182171[/C][C]0.108527[/C][/ROW]
[ROW][C][24,24.5[[/C][C]24.25[/C][C]20[/C][C]0.077519[/C][C]0.25969[/C][C]0.155039[/C][/ROW]
[ROW][C][24.5,25[[/C][C]24.75[/C][C]11[/C][C]0.042636[/C][C]0.302326[/C][C]0.085271[/C][/ROW]
[ROW][C][25,25.5[[/C][C]25.25[/C][C]17[/C][C]0.065891[/C][C]0.368217[/C][C]0.131783[/C][/ROW]
[ROW][C][25.5,26[[/C][C]25.75[/C][C]13[/C][C]0.050388[/C][C]0.418605[/C][C]0.100775[/C][/ROW]
[ROW][C][26,26.5[[/C][C]26.25[/C][C]14[/C][C]0.054264[/C][C]0.472868[/C][C]0.108527[/C][/ROW]
[ROW][C][26.5,27[[/C][C]26.75[/C][C]14[/C][C]0.054264[/C][C]0.527132[/C][C]0.108527[/C][/ROW]
[ROW][C][27,27.5[[/C][C]27.25[/C][C]19[/C][C]0.073643[/C][C]0.600775[/C][C]0.147287[/C][/ROW]
[ROW][C][27.5,28[[/C][C]27.75[/C][C]9[/C][C]0.034884[/C][C]0.635659[/C][C]0.069767[/C][/ROW]
[ROW][C][28,28.5[[/C][C]28.25[/C][C]2[/C][C]0.007752[/C][C]0.643411[/C][C]0.015504[/C][/ROW]
[ROW][C][28.5,29[[/C][C]28.75[/C][C]5[/C][C]0.01938[/C][C]0.662791[/C][C]0.03876[/C][/ROW]
[ROW][C][29,29.5[[/C][C]29.25[/C][C]4[/C][C]0.015504[/C][C]0.678295[/C][C]0.031008[/C][/ROW]
[ROW][C][29.5,30[[/C][C]29.75[/C][C]1[/C][C]0.003876[/C][C]0.682171[/C][C]0.007752[/C][/ROW]
[ROW][C][30,30.5[[/C][C]30.25[/C][C]1[/C][C]0.003876[/C][C]0.686047[/C][C]0.007752[/C][/ROW]
[ROW][C][30.5,31[[/C][C]30.75[/C][C]3[/C][C]0.011628[/C][C]0.697674[/C][C]0.023256[/C][/ROW]
[ROW][C][31,31.5[[/C][C]31.25[/C][C]8[/C][C]0.031008[/C][C]0.728682[/C][C]0.062016[/C][/ROW]
[ROW][C][31.5,32[[/C][C]31.75[/C][C]4[/C][C]0.015504[/C][C]0.744186[/C][C]0.031008[/C][/ROW]
[ROW][C][32,32.5[[/C][C]32.25[/C][C]2[/C][C]0.007752[/C][C]0.751938[/C][C]0.015504[/C][/ROW]
[ROW][C][32.5,33[[/C][C]32.75[/C][C]1[/C][C]0.003876[/C][C]0.755814[/C][C]0.007752[/C][/ROW]
[ROW][C][33,33.5[[/C][C]33.25[/C][C]0[/C][C]0[/C][C]0.755814[/C][C]0[/C][/ROW]
[ROW][C][33.5,34[[/C][C]33.75[/C][C]4[/C][C]0.015504[/C][C]0.771318[/C][C]0.031008[/C][/ROW]
[ROW][C][34,34.5[[/C][C]34.25[/C][C]6[/C][C]0.023256[/C][C]0.794574[/C][C]0.046512[/C][/ROW]
[ROW][C][34.5,35[[/C][C]34.75[/C][C]8[/C][C]0.031008[/C][C]0.825581[/C][C]0.062016[/C][/ROW]
[ROW][C][35,35.5[[/C][C]35.25[/C][C]3[/C][C]0.011628[/C][C]0.837209[/C][C]0.023256[/C][/ROW]
[ROW][C][35.5,36[[/C][C]35.75[/C][C]1[/C][C]0.003876[/C][C]0.841085[/C][C]0.007752[/C][/ROW]
[ROW][C][36,36.5[[/C][C]36.25[/C][C]7[/C][C]0.027132[/C][C]0.868217[/C][C]0.054264[/C][/ROW]
[ROW][C][36.5,37[[/C][C]36.75[/C][C]3[/C][C]0.011628[/C][C]0.879845[/C][C]0.023256[/C][/ROW]
[ROW][C][37,37.5[[/C][C]37.25[/C][C]5[/C][C]0.01938[/C][C]0.899225[/C][C]0.03876[/C][/ROW]
[ROW][C][37.5,38[[/C][C]37.75[/C][C]4[/C][C]0.015504[/C][C]0.914729[/C][C]0.031008[/C][/ROW]
[ROW][C][38,38.5[[/C][C]38.25[/C][C]1[/C][C]0.003876[/C][C]0.918605[/C][C]0.007752[/C][/ROW]
[ROW][C][38.5,39[[/C][C]38.75[/C][C]7[/C][C]0.027132[/C][C]0.945736[/C][C]0.054264[/C][/ROW]
[ROW][C][39,39.5[[/C][C]39.25[/C][C]7[/C][C]0.027132[/C][C]0.972868[/C][C]0.054264[/C][/ROW]
[ROW][C][39.5,40[[/C][C]39.75[/C][C]6[/C][C]0.023256[/C][C]0.996124[/C][C]0.046512[/C][/ROW]
[ROW][C][40,40.5][/C][C]40.25[/C][C]1[/C][C]0.003876[/C][C]1[/C][C]0.007752[/C][/ROW]
[/TABLE]
Source: https://freestatistics.org/blog/index.php?pk=160183&T=1
Globally Unique Identifier (entire table): ba.freestatistics.org/blog/index.php?pk=160183&T=1
As an alternative you can also use a QR Code:
The GUIDs for individual cells are displayed in the table below:
| Frequency Table (Histogram) | | Bins | Midpoint | Abs. Frequency | Rel. Frequency | Cumul. Rel. Freq. | Density | | [21,21.5[ | 21.25 | 1 | 0.003876 | 0.003876 | 0.007752 | | [21.5,22[ | 21.75 | 4 | 0.015504 | 0.01938 | 0.031008 | | [22,22.5[ | 22.25 | 10 | 0.03876 | 0.05814 | 0.077519 | | [22.5,23[ | 22.75 | 9 | 0.034884 | 0.093023 | 0.069767 | | [23,23.5[ | 23.25 | 9 | 0.034884 | 0.127907 | 0.069767 | | [23.5,24[ | 23.75 | 14 | 0.054264 | 0.182171 | 0.108527 | | [24,24.5[ | 24.25 | 20 | 0.077519 | 0.25969 | 0.155039 | | [24.5,25[ | 24.75 | 11 | 0.042636 | 0.302326 | 0.085271 | | [25,25.5[ | 25.25 | 17 | 0.065891 | 0.368217 | 0.131783 | | [25.5,26[ | 25.75 | 13 | 0.050388 | 0.418605 | 0.100775 | | [26,26.5[ | 26.25 | 14 | 0.054264 | 0.472868 | 0.108527 | | [26.5,27[ | 26.75 | 14 | 0.054264 | 0.527132 | 0.108527 | | [27,27.5[ | 27.25 | 19 | 0.073643 | 0.600775 | 0.147287 | | [27.5,28[ | 27.75 | 9 | 0.034884 | 0.635659 | 0.069767 | | [28,28.5[ | 28.25 | 2 | 0.007752 | 0.643411 | 0.015504 | | [28.5,29[ | 28.75 | 5 | 0.01938 | 0.662791 | 0.03876 | | [29,29.5[ | 29.25 | 4 | 0.015504 | 0.678295 | 0.031008 | | [29.5,30[ | 29.75 | 1 | 0.003876 | 0.682171 | 0.007752 | | [30,30.5[ | 30.25 | 1 | 0.003876 | 0.686047 | 0.007752 | | [30.5,31[ | 30.75 | 3 | 0.011628 | 0.697674 | 0.023256 | | [31,31.5[ | 31.25 | 8 | 0.031008 | 0.728682 | 0.062016 | | [31.5,32[ | 31.75 | 4 | 0.015504 | 0.744186 | 0.031008 | | [32,32.5[ | 32.25 | 2 | 0.007752 | 0.751938 | 0.015504 | | [32.5,33[ | 32.75 | 1 | 0.003876 | 0.755814 | 0.007752 | | [33,33.5[ | 33.25 | 0 | 0 | 0.755814 | 0 | | [33.5,34[ | 33.75 | 4 | 0.015504 | 0.771318 | 0.031008 | | [34,34.5[ | 34.25 | 6 | 0.023256 | 0.794574 | 0.046512 | | [34.5,35[ | 34.75 | 8 | 0.031008 | 0.825581 | 0.062016 | | [35,35.5[ | 35.25 | 3 | 0.011628 | 0.837209 | 0.023256 | | [35.5,36[ | 35.75 | 1 | 0.003876 | 0.841085 | 0.007752 | | [36,36.5[ | 36.25 | 7 | 0.027132 | 0.868217 | 0.054264 | | [36.5,37[ | 36.75 | 3 | 0.011628 | 0.879845 | 0.023256 | | [37,37.5[ | 37.25 | 5 | 0.01938 | 0.899225 | 0.03876 | | [37.5,38[ | 37.75 | 4 | 0.015504 | 0.914729 | 0.031008 | | [38,38.5[ | 38.25 | 1 | 0.003876 | 0.918605 | 0.007752 | | [38.5,39[ | 38.75 | 7 | 0.027132 | 0.945736 | 0.054264 | | [39,39.5[ | 39.25 | 7 | 0.027132 | 0.972868 | 0.054264 | | [39.5,40[ | 39.75 | 6 | 0.023256 | 0.996124 | 0.046512 | | [40,40.5] | 40.25 | 1 | 0.003876 | 1 | 0.007752 |
If you paste this QR Code into your document, anyone with a smartphone or tablet will be able to scan it and view this table in a browser.
If you paste this QR Code into your document, anyone with a smartphone or tablet will be able to scan it and view this table in a browser.
If you paste this QR Code into your document, anyone with a smartphone or tablet will be able to scan it and view this table in a browser.
If you paste this QR Code into your document, anyone with a smartphone or tablet will be able to scan it and view this table in a browser.
If you paste this QR Code into your document, anyone with a smartphone or tablet will be able to scan it and view this table in a browser.
|