Free Statistics
of Irreproducible Research!
Description of Statistical Computation | |||||||||||||||||||||||||||||||||
|---|---|---|---|---|---|---|---|---|---|---|---|---|---|---|---|---|---|---|---|---|---|---|---|---|---|---|---|---|---|---|---|---|---|
| Author's title | |||||||||||||||||||||||||||||||||
| Author | *Unverified author* | ||||||||||||||||||||||||||||||||
| R Software Module | rwasp_meanversusmedian.wasp | ||||||||||||||||||||||||||||||||
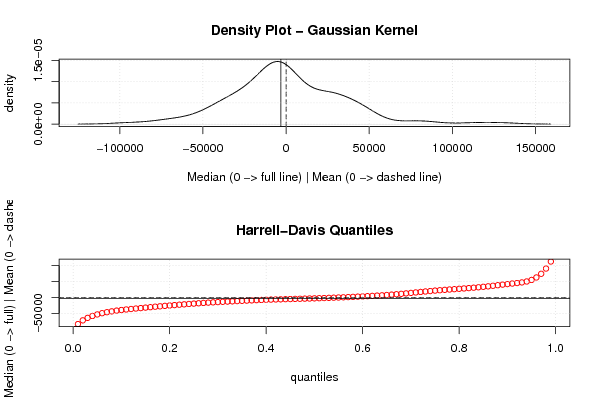
| Title produced by software | Mean versus Median | ||||||||||||||||||||||||||||||||
| Date of computation | Fri, 23 Dec 2011 03:10:53 -0500 | ||||||||||||||||||||||||||||||||
| Cite this page as follows | Statistical Computations at FreeStatistics.org, Office for Research Development and Education, URL https://freestatistics.org/blog/index.php?v=date/2011/Dec/23/t1324627979k4guroo31qk97hi.htm/, Retrieved Mon, 29 Apr 2024 19:32:50 +0000 | ||||||||||||||||||||||||||||||||
| Statistical Computations at FreeStatistics.org, Office for Research Development and Education, URL https://freestatistics.org/blog/index.php?pk=160180, Retrieved Mon, 29 Apr 2024 19:32:50 +0000 | |||||||||||||||||||||||||||||||||
| QR Codes: | |||||||||||||||||||||||||||||||||
|
| |||||||||||||||||||||||||||||||||
| Original text written by user: | |||||||||||||||||||||||||||||||||
| IsPrivate? | No (this computation is public) | ||||||||||||||||||||||||||||||||
| User-defined keywords | |||||||||||||||||||||||||||||||||
| Estimated Impact | 152 | ||||||||||||||||||||||||||||||||
Tree of Dependent Computations | |||||||||||||||||||||||||||||||||
| Family? (F = Feedback message, R = changed R code, M = changed R Module, P = changed Parameters, D = changed Data) | |||||||||||||||||||||||||||||||||
| - [Mean versus Median] [Paper, MR, mean v...] [2011-12-22 09:05:09] [75512e061a94450f738c2449abbaac12] - R D [Mean versus Median] [mean vs median] [2011-12-23 08:10:53] [d41d8cd98f00b204e9800998ecf8427e] [Current] | |||||||||||||||||||||||||||||||||
| Feedback Forum | |||||||||||||||||||||||||||||||||
Post a new message | |||||||||||||||||||||||||||||||||
Dataset | |||||||||||||||||||||||||||||||||
| Dataseries X: | |||||||||||||||||||||||||||||||||
919.389758388658 44251.4122052056 -12513.6654771173 -62475.9769850588 -38269.6032913212 -26433.5793144674 24342.1534154 23505.5674955919 -4069.38700205302 72151.8163681993 -47495.6634828155 -12576.2938058643 -59418.2144751869 -34652.2762189172 44411.8767687205 7597.28229474211 -44964.9200131698 -5773.07229225834 -68977.674821896 -50475.3281912243 -17256.2257107146 -16971.9008486908 40794.9015936341 -49989.1041945531 -13075.6608257843 48399.996730286 5288.55206600465 36107.6564347825 129622.84625155 31275.8796531673 24448.5482352195 37050.5555680899 -50938.6030426967 -35611.3452302493 23846.7550483907 -5877.06899025109 43383.8087212696 -15525.1551593278 -11110.5952798899 37512.4832264053 48538.3167412087 -7456.70072347462 -6265.02954656174 2689.79223073755 -3128.72455359062 45622.5273849873 -7026.83730091046 32659.8643944869 31412.9597997446 -37566.8285240439 -23748.2542421216 -21563.3257290206 84625.2655373932 56023.545590683 21113.2468679188 35319.4931141074 48312.4763147551 1531.63116191048 26420.4180348139 -10476.3689495533 19469.5038226566 -37599.4384978871 27467.3790101194 2485.04484376091 45061.1961370999 -26443.4601079792 -3262.53974823148 -95576.4952865121 -11949.1839849309 -12163.6574567382 31308.5895827809 18529.7826072853 -26521.8875914469 -26897.52398508 -79185.2215755373 -25401.3560761515 -30435.2366624086 -70459.9527763131 -8174.04130782662 -44863.1255061461 -29894.1298246692 112746.19527799 -23851.6725313611 -4641.0995597634 -24077.5585175183 9425.09057880312 -13693.3598574151 -17518.8141300065 -1803.95811306701 17659.6283079347 182.749065110148 -37689.0723188402 28104.5764560943 12457.9424713109 -33057.4664827595 32698.2875250512 5963.28184556008 -7027.87541392703 45199.5934499621 -20757.7434595314 3369.05811206089 -16380.0657361025 3905.3965698384 14786.4620090207 5803.97634944544 -28568.7385636487 -6675.53096538564 25268.2899001662 -5684.36365302935 -34836.959348979 -4430.31661104503 16607.9628092971 4681.24311339866 -14964.9634516811 -7326.34686653538 -5684.36365302935 80832.9823040114 -19583.0719180619 40.4970240628855 26663.7704260553 -14265.0924189724 6362.35857527158 5984.08377729442 -40535.9634865151 -2216.86625387061 -7678.06148673653 26267.683374449 24911.2765088984 -1976.09748465309 -11801.0776556145 -1980.41896115322 1997.27424961065 -2317.28925003426 17791.9655003272 -5124.42561696742 -2587.75144886963 -5684.36365302935 10695.181940815 -37580.1264211433 -1184.79393707387 -17190.731149322 -3624.14131703423 14058.0924310476 6543.76133893449 | |||||||||||||||||||||||||||||||||
Tables (Output of Computation) | |||||||||||||||||||||||||||||||||
| |||||||||||||||||||||||||||||||||
Figures (Output of Computation) | |||||||||||||||||||||||||||||||||
Input Parameters & R Code | |||||||||||||||||||||||||||||||||
| Parameters (Session): | |||||||||||||||||||||||||||||||||
| Parameters (R input): | |||||||||||||||||||||||||||||||||
| R code (references can be found in the software module): | |||||||||||||||||||||||||||||||||
library(Hmisc) | |||||||||||||||||||||||||||||||||