Free Statistics

of Irreproducible Research!

Author's title

Author*The author of this computation has been verified*
R Software Modulerwasp_regression_trees1.wasp
Title produced by softwareRecursive Partitioning (Regression Trees)
Date of computationThu, 22 Dec 2011 16:19:40 -0500
Cite this page as followsStatistical Computations at FreeStatistics.org, Office for Research Development and Education, URL https://freestatistics.org/blog/index.php?v=date/2011/Dec/22/t1324588808hrfjwcr6v1jdudh.htm/, Retrieved Fri, 03 May 2024 13:25:59 +0000
Statistical Computations at FreeStatistics.org, Office for Research Development and Education, URL https://freestatistics.org/blog/index.php?pk=159991, Retrieved Fri, 03 May 2024 13:25:59 +0000
QR Codes:

Original text written by user:
IsPrivate?No (this computation is public)
User-defined keywords
Estimated Impact100
Family? (F = Feedback message, R = changed R code, M = changed R Module, P = changed Parameters, D = changed Data)
-     [Kendall tau Correlation Matrix] [] [2010-12-05 18:04:16] [b98453cac15ba1066b407e146608df68]
- RMPD    [Recursive Partitioning (Regression Trees)] [] [2011-12-22 21:19:40] [aedc5b8e4f26bdca34b1a0cf88d6dfa2] [Current]
Feedback Forum

Post a new message
Dataseries X:
1826	161442	93	48	20	20465	23975
1728	189695	60	53	20	33629	85634
192	7215	18	0	0	1423	1929
2295	129098	95	51	27	25629	36294
3509	245678	137	79	31	54002	72255
6861	515038	263	136	36	151036	189748
1801	183078	57	62	23	33287	61834
1681	185559	59	83	30	31172	68167
1897	154581	44	55	30	28113	38462
2974	298001	96	67	26	57803	101219
1946	121844	75	50	24	49830	43270
2363	203796	71	88	30	52143	76183
1839	101647	100	46	22	21055	31476
3189	220490	120	79	28	47007	62157
1486	170952	61	56	18	28735	46261
1567	154647	88	54	22	59147	50063
1759	142025	58	81	33	78950	64483
1247	79030	61	6	15	13497	2341
2779	167047	87	74	34	46154	48149
727	27997	25	13	18	53249	12743
1117	84588	61	31	15	10726	18743
2805	241082	100	99	30	83700	97057
1760	195820	72	38	25	40400	17675
2266	142001	54	59	34	33797	33106
1937	157178	87	54	21	36205	53311
1665	183744	32	50	21	30165	42754
2145	212298	165	66	25	58534	59056
1453	201403	95	90	31	44663	101621
2741	354924	118	60	31	92556	118120
2112	192399	44	52	20	40078	79572
1684	182286	44	61	28	34711	42744
1617	181590	46	60	22	31076	65931
2233	134868	106	53	17	74608	38575
3122	235002	125	76	25	58092	28795
2511	228872	54	70	24	42009	94440
1	0	1	0	0	0	0
2099	223044	63	54	28	36022	38229
1669	100129	51	44	14	23333	31972
2137	145864	49	42	35	53349	40071
2176	252386	67	83	34	92596	132480
2390	242379	71	105	22	49598	62797
1783	156399	60	42	34	44093	40429
1049	103623	33	25	23	84205	45545
2161	195891	78	64	24	63369	57568
1364	139654	51	71	26	60132	39019
1228	167934	96	44	22	37403	53866
745	81293	32	23	35	24460	38345
2410	246211	104	78	24	46456	50210
2289	233155	89	59	31	66616	80947
2639	160344	59	68	26	41554	43461
658	48188	28	12	22	22346	14812
1917	161922	69	99	21	30874	37819
2583	311044	75	80	27	68701	102738
2026	235223	79	56	30	35728	54509
1911	195583	59	67	33	29010	62956
1751	155574	57	44	11	23110	55411
1852	208834	67	53	26	38844	50611
1044	101687	25	26	26	27084	26692
1177	151985	66	67	23	35139	60056
2878	201027	99	36	38	57476	25155
1783	163061	62	54	32	33277	42840
2191	144556	82	51	20	31141	39358
1331	129561	61	46	22	61281	47241
1307	122204	38	57	26	25820	49611
1256	160930	35	27	26	23284	41833
1378	109798	42	45	33	35378	48930
2311	192811	71	72	36	74990	110600
2897	138708	65	93	25	29653	52235
1103	114408	38	59	24	64622	53986
340	31970	15	5	21	4157	4105
2791	225558	112	53	19	29245	59331
1367	142907	74	40	12	50008	47796
1441	113612	68	72	30	52338	38302
1681	119537	72	53	21	13310	14063
2650	162203	67	81	34	92901	54414
1499	100098	44	27	32	10956	9903
2302	174768	60	94	28	34241	53987
2540	158459	97	71	28	75043	88937
1040	88128	32	23	21	21152	21928
1234	84971	71	34	31	42249	29487
927	80545	68	54	26	42005	35334
2176	287191	64	49	29	41152	57596
984	67006	29	26	23	14399	29750
1551	134091	40	48	25	28263	41029
1204	95803	47	54	22	17215	12416
1858	173833	58	38	26	48140	51158
2716	241469	237	63	33	62897	79935
1207	115367	114	58	24	22883	26552
1392	115603	63	44	24	41622	25807
1525	155537	53	45	21	40715	50620
1829	153133	41	49	28	65897	61467
2354	177260	81	75	28	76542	65292
1233	151517	57	39	25	37477	55516
1366	133686	59	28	15	53216	42006
953	61350	41	24	13	40911	26273
2319	245196	117	52	36	57021	90248
1857	195576	70	96	24	73116	61476
223	19349	12	13	1	3895	9604
2502	242863	107	43	24	46609	45108
2033	157269	81	41	31	29351	47232
747	66802	30	28	4	2325	3439
1062	91762	24	54	21	31747	30553
1422	151077	57	73	27	32665	24751
1303	133642	63	39	23	19249	34458
823	85338	40	36	12	15292	24649
596	27676	22	2	16	5842	2342
1644	162934	49	96	29	33994	52739
1130	122417	37	29	26	13018	6245
0	0	0	0	0	0	0
1082	91529	32	46	25	98177	35381
1135	107205	67	25	21	37941	19595
1367	144664	45	51	23	31032	50848
1506	146445	63	60	21	32683	39443
910	84940	61	36	21	34545	27023
78	3616	5	0	0	0	0
0	0	0	0	0	0	0
1130	183088	44	40	23	27525	61022
1612	148089	88	72	33	66856	63528
2100	173083	100	29	30	28549	34835
970	128944	39	41	23	38610	37172
778	43410	19	7	1	2781	13
1752	175774	73	70	29	41211	62548
957	95401	42	30	18	22698	31334
2098	134837	55	69	33	41194	20839
731	60493	40	3	12	32689	5084
285	19764	12	10	2	5752	9927
1834	164062	56	46	21	26757	53229
1167	138469	34	35	28	22527	29877
1646	155367	54	54	29	44810	37310
256	11796	9	1	2	0	0
98	10674	9	0	0	0	0
1409	144927	58	39	18	100674	50067
41	6836	3	0	1	0	0
1824	162563	63	48	21	57786	47708
42	5118	3	5	0	0	0
528	40248	16	8	4	5444	6012
0	0	0	0	0	0	0
1086	124079	48	38	26	28470	27749
1305	88837	38	21	26	61849	47555
81	7131	4	0	0	0	0
261	9056	14	0	4	2179	1336
934	76611	24	15	17	8019	11017
1279	142829	53	53	21	39644	55184
1148	100681	20	17	22	23494	43485


Summary of computational transaction
Raw Inputview raw input (R code)
Raw Outputview raw output of R engine
Computing time4 seconds
R Server'Herman Ole Andreas Wold' @ wold.wessa.net

\begin{tabular}{lllllllll}
\hline
Summary of computational transaction \tabularnewline
Raw Input & view raw input (R code)  \tabularnewline
Raw Output & view raw output of R engine  \tabularnewline
Computing time & 4 seconds \tabularnewline
R Server & 'Herman Ole Andreas Wold' @ wold.wessa.net \tabularnewline
\hline
\end{tabular}
%Source: https://freestatistics.org/blog/index.php?pk=159991&T=0

[TABLE]
[ROW][C]Summary of computational transaction[/C][/ROW]
[ROW][C]Raw Input[/C][C]view raw input (R code) [/C][/ROW]
[ROW][C]Raw Output[/C][C]view raw output of R engine [/C][/ROW]
[ROW][C]Computing time[/C][C]4 seconds[/C][/ROW]
[ROW][C]R Server[/C][C]'Herman Ole Andreas Wold' @ wold.wessa.net[/C][/ROW]
[/TABLE]
Source: https://freestatistics.org/blog/index.php?pk=159991&T=0

Globally Unique Identifier (entire table): ba.freestatistics.org/blog/index.php?pk=159991&T=0

As an alternative you can also use a QR Code:  

The GUIDs for individual cells are displayed in the table below:

Summary of computational transaction
Raw Inputview raw input (R code)
Raw Outputview raw output of R engine
Computing time4 seconds
R Server'Herman Ole Andreas Wold' @ wold.wessa.net


Confusion Matrix (predicted in columns / actuals in rows)
C1C2C3
C137110
C22415
C301830

\begin{tabular}{lllllllll}
\hline
Confusion Matrix (predicted in columns / actuals in rows) \tabularnewline
 & C1 & C2 & C3 \tabularnewline
C1 & 37 & 11 & 0 \tabularnewline
C2 & 2 & 41 & 5 \tabularnewline
C3 & 0 & 18 & 30 \tabularnewline
\hline
\end{tabular}
%Source: https://freestatistics.org/blog/index.php?pk=159991&T=1

[TABLE]
[ROW][C]Confusion Matrix (predicted in columns / actuals in rows)[/C][/ROW]
[ROW][C][/C][C]C1[/C][C]C2[/C][C]C3[/C][/ROW]
[ROW][C]C1[/C][C]37[/C][C]11[/C][C]0[/C][/ROW]
[ROW][C]C2[/C][C]2[/C][C]41[/C][C]5[/C][/ROW]
[ROW][C]C3[/C][C]0[/C][C]18[/C][C]30[/C][/ROW]
[/TABLE]
Source: https://freestatistics.org/blog/index.php?pk=159991&T=1

Globally Unique Identifier (entire table): ba.freestatistics.org/blog/index.php?pk=159991&T=1

As an alternative you can also use a QR Code:  

The GUIDs for individual cells are displayed in the table below:

Confusion Matrix (predicted in columns / actuals in rows)
C1C2C3
C137110
C22415
C301830


Parameters (Session):
par1 = 12 ;
Parameters (R input):
par1 = 2 ; par2 = quantiles ; par3 = 3 ; par4 = no ;
R code (references can be found in the software module):
library(party)
library(Hmisc)
par1 <- as.numeric(par1)
par3 <- as.numeric(par3)
x <- data.frame(t(y))
is.data.frame(x)
x <- x[!is.na(x[,par1]),]
k <- length(x[1,])
n <- length(x[,1])
colnames(x)[par1]
x[,par1]
if (par2 == 'kmeans') {
cl <- kmeans(x[,par1], par3)
print(cl)
clm <- matrix(cbind(cl$centers,1:par3),ncol=2)
clm <- clm[sort.list(clm[,1]),]
for (i in 1:par3) {
cl$cluster[cl$cluster==clm[i,2]] <- paste('C',i,sep='')
}
cl$cluster <- as.factor(cl$cluster)
print(cl$cluster)
x[,par1] <- cl$cluster
}
if (par2 == 'quantiles') {
x[,par1] <- cut2(x[,par1],g=par3)
}
if (par2 == 'hclust') {
hc <- hclust(dist(x[,par1])^2, 'cen')
print(hc)
memb <- cutree(hc, k = par3)
dum <- c(mean(x[memb==1,par1]))
for (i in 2:par3) {
dum <- c(dum, mean(x[memb==i,par1]))
}
hcm <- matrix(cbind(dum,1:par3),ncol=2)
hcm <- hcm[sort.list(hcm[,1]),]
for (i in 1:par3) {
memb[memb==hcm[i,2]] <- paste('C',i,sep='')
}
memb <- as.factor(memb)
print(memb)
x[,par1] <- memb
}
if (par2=='equal') {
ed <- cut(as.numeric(x[,par1]),par3,labels=paste('C',1:par3,sep=''))
x[,par1] <- as.factor(ed)
}
table(x[,par1])
colnames(x)
colnames(x)[par1]
x[,par1]
if (par2 == 'none') {
m <- ctree(as.formula(paste(colnames(x)[par1],' ~ .',sep='')),data = x)
}
load(file='createtable')
if (par2 != 'none') {
m <- ctree(as.formula(paste('as.factor(',colnames(x)[par1],') ~ .',sep='')),data = x)
if (par4=='yes') {
a<-table.start()
a<-table.row.start(a)
a<-table.element(a,'10-Fold Cross Validation',3+2*par3,TRUE)
a<-table.row.end(a)
a<-table.row.start(a)
a<-table.element(a,'',1,TRUE)
a<-table.element(a,'Prediction (training)',par3+1,TRUE)
a<-table.element(a,'Prediction (testing)',par3+1,TRUE)
a<-table.row.end(a)
a<-table.row.start(a)
a<-table.element(a,'Actual',1,TRUE)
for (jjj in 1:par3) a<-table.element(a,paste('C',jjj,sep=''),1,TRUE)
a<-table.element(a,'CV',1,TRUE)
for (jjj in 1:par3) a<-table.element(a,paste('C',jjj,sep=''),1,TRUE)
a<-table.element(a,'CV',1,TRUE)
a<-table.row.end(a)
for (i in 1:10) {
ind <- sample(2, nrow(x), replace=T, prob=c(0.9,0.1))
m.ct <- ctree(as.formula(paste('as.factor(',colnames(x)[par1],') ~ .',sep='')),data =x[ind==1,])
if (i==1) {
m.ct.i.pred <- predict(m.ct, newdata=x[ind==1,])
m.ct.i.actu <- x[ind==1,par1]
m.ct.x.pred <- predict(m.ct, newdata=x[ind==2,])
m.ct.x.actu <- x[ind==2,par1]
} else {
m.ct.i.pred <- c(m.ct.i.pred,predict(m.ct, newdata=x[ind==1,]))
m.ct.i.actu <- c(m.ct.i.actu,x[ind==1,par1])
m.ct.x.pred <- c(m.ct.x.pred,predict(m.ct, newdata=x[ind==2,]))
m.ct.x.actu <- c(m.ct.x.actu,x[ind==2,par1])
}
}
print(m.ct.i.tab <- table(m.ct.i.actu,m.ct.i.pred))
numer <- 0
for (i in 1:par3) {
print(m.ct.i.tab[i,i] / sum(m.ct.i.tab[i,]))
numer <- numer + m.ct.i.tab[i,i]
}
print(m.ct.i.cp <- numer / sum(m.ct.i.tab))
print(m.ct.x.tab <- table(m.ct.x.actu,m.ct.x.pred))
numer <- 0
for (i in 1:par3) {
print(m.ct.x.tab[i,i] / sum(m.ct.x.tab[i,]))
numer <- numer + m.ct.x.tab[i,i]
}
print(m.ct.x.cp <- numer / sum(m.ct.x.tab))
for (i in 1:par3) {
a<-table.row.start(a)
a<-table.element(a,paste('C',i,sep=''),1,TRUE)
for (jjj in 1:par3) a<-table.element(a,m.ct.i.tab[i,jjj])
a<-table.element(a,round(m.ct.i.tab[i,i]/sum(m.ct.i.tab[i,]),4))
for (jjj in 1:par3) a<-table.element(a,m.ct.x.tab[i,jjj])
a<-table.element(a,round(m.ct.x.tab[i,i]/sum(m.ct.x.tab[i,]),4))
a<-table.row.end(a)
}
a<-table.row.start(a)
a<-table.element(a,'Overall',1,TRUE)
for (jjj in 1:par3) a<-table.element(a,'-')
a<-table.element(a,round(m.ct.i.cp,4))
for (jjj in 1:par3) a<-table.element(a,'-')
a<-table.element(a,round(m.ct.x.cp,4))
a<-table.row.end(a)
a<-table.end(a)
table.save(a,file='mytable3.tab')
}
}
m
bitmap(file='test1.png')
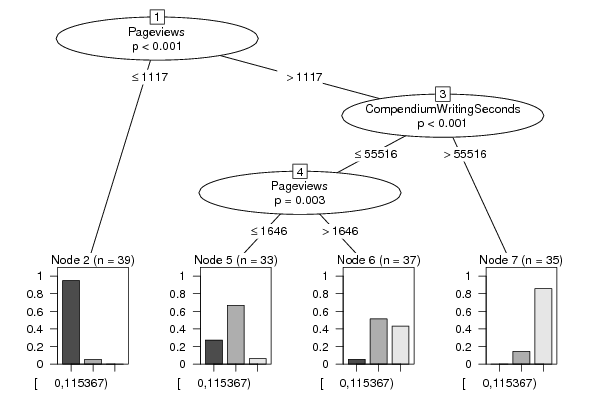
plot(m)
dev.off()
bitmap(file='test1a.png')
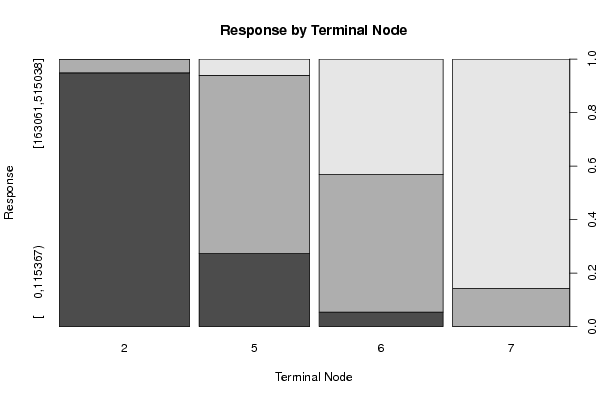
plot(x[,par1] ~ as.factor(where(m)),main='Response by Terminal Node',xlab='Terminal Node',ylab='Response')
dev.off()
if (par2 == 'none') {
forec <- predict(m)
result <- as.data.frame(cbind(x[,par1],forec,x[,par1]-forec))
colnames(result) <- c('Actuals','Forecasts','Residuals')
print(result)
}
if (par2 != 'none') {
print(cbind(as.factor(x[,par1]),predict(m)))
myt <- table(as.factor(x[,par1]),predict(m))
print(myt)
}
bitmap(file='test2.png')
if(par2=='none') {
op <- par(mfrow=c(2,2))
plot(density(result$Actuals),main='Kernel Density Plot of Actuals')
plot(density(result$Residuals),main='Kernel Density Plot of Residuals')
plot(result$Forecasts,result$Actuals,main='Actuals versus Predictions',xlab='Predictions',ylab='Actuals')
plot(density(result$Forecasts),main='Kernel Density Plot of Predictions')
par(op)
}
if(par2!='none') {
plot(myt,main='Confusion Matrix',xlab='Actual',ylab='Predicted')
}
dev.off()
if (par2 == 'none') {
detcoef <- cor(result$Forecasts,result$Actuals)
a<-table.start()
a<-table.row.start(a)
a<-table.element(a,'Goodness of Fit',2,TRUE)
a<-table.row.end(a)
a<-table.row.start(a)
a<-table.element(a,'Correlation',1,TRUE)
a<-table.element(a,round(detcoef,4))
a<-table.row.end(a)
a<-table.row.start(a)
a<-table.element(a,'R-squared',1,TRUE)
a<-table.element(a,round(detcoef*detcoef,4))
a<-table.row.end(a)
a<-table.row.start(a)
a<-table.element(a,'RMSE',1,TRUE)
a<-table.element(a,round(sqrt(mean((result$Residuals)^2)),4))
a<-table.row.end(a)
a<-table.end(a)
table.save(a,file='mytable1.tab')
a<-table.start()
a<-table.row.start(a)
a<-table.element(a,'Actuals, Predictions, and Residuals',4,TRUE)
a<-table.row.end(a)
a<-table.row.start(a)
a<-table.element(a,'#',header=TRUE)
a<-table.element(a,'Actuals',header=TRUE)
a<-table.element(a,'Forecasts',header=TRUE)
a<-table.element(a,'Residuals',header=TRUE)
a<-table.row.end(a)
for (i in 1:length(result$Actuals)) {
a<-table.row.start(a)
a<-table.element(a,i,header=TRUE)
a<-table.element(a,result$Actuals[i])
a<-table.element(a,result$Forecasts[i])
a<-table.element(a,result$Residuals[i])
a<-table.row.end(a)
}
a<-table.end(a)
table.save(a,file='mytable.tab')
}
if (par2 != 'none') {
a<-table.start()
a<-table.row.start(a)
a<-table.element(a,'Confusion Matrix (predicted in columns / actuals in rows)',par3+1,TRUE)
a<-table.row.end(a)
a<-table.row.start(a)
a<-table.element(a,'',1,TRUE)
for (i in 1:par3) {
a<-table.element(a,paste('C',i,sep=''),1,TRUE)
}
a<-table.row.end(a)
for (i in 1:par3) {
a<-table.row.start(a)
a<-table.element(a,paste('C',i,sep=''),1,TRUE)
for (j in 1:par3) {
a<-table.element(a,myt[i,j])
}
a<-table.row.end(a)
}
a<-table.end(a)
table.save(a,file='mytable2.tab')
}