Free Statistics

of Irreproducible Research!

Author's title

Author*The author of this computation has been verified*
R Software Modulerwasp_autocorrelation.wasp
Title produced by software(Partial) Autocorrelation Function
Date of computationThu, 22 Dec 2011 11:32:30 -0500
Cite this page as followsStatistical Computations at FreeStatistics.org, Office for Research Development and Education, URL https://freestatistics.org/blog/index.php?v=date/2011/Dec/22/t1324571563eaf9xcbcf7chq7o.htm/, Retrieved Fri, 03 May 2024 09:23:12 +0000
Statistical Computations at FreeStatistics.org, Office for Research Development and Education, URL https://freestatistics.org/blog/index.php?pk=159696, Retrieved Fri, 03 May 2024 09:23:12 +0000
QR Codes:

Original text written by user:
IsPrivate?No (this computation is public)
User-defined keywords
Estimated Impact131
Family? (F = Feedback message, R = changed R code, M = changed R Module, P = changed Parameters, D = changed Data)
-     [(Partial) Autocorrelation Function] [] [2011-12-06 13:49:56] [ad2d4c5ace9fa07b356a7b5098237581]
- R  D  [(Partial) Autocorrelation Function] [] [2011-12-22 16:18:57] [ad2d4c5ace9fa07b356a7b5098237581]
-   P     [(Partial) Autocorrelation Function] [] [2011-12-22 16:25:34] [ad2d4c5ace9fa07b356a7b5098237581]
-   P         [(Partial) Autocorrelation Function] [] [2011-12-22 16:32:30] [daf26cf00f2f7a7ee0a1368c8ac8117e] [Current]
Feedback Forum

Post a new message
Dataseries X:
315.71
317.45
317.5
317.12
315.86
314.93
313.2
312.6
313.33
314.67
315.62
316.38
316.71
317.72
318.29
318.16
316.55
314.8
313.84
313.26
314.8
315.59
316.43
316.97
317.58
319.02
320.02
319.59
318.18
315.91
314.16
313.83
315
316.19
316.93
317.7
318.54
319.48
320.58
319.77
318.58
316.79
314.8
315.38
316.1
317.01
317.94
318.55
319.68
320.63
321.01
320.55
319.58
317.4
316.26
315.42
316.69
317.7
318.74
319.08
319.86
321.39
322.24
321.47
319.74
317.77
316.21
315.99
317.12
318.31
319.57
320.08
320.75
321.8
322.24
321.89
320.44
318.7
316.7
316.79
317.79
318.71
319.44
320.44
320.89
322.13
322.16
321.87
321.39
318.8
317.81
317.3
318.87
319.42
320.62
321.59
322.39
323.87
324.01
323.75
322.4
320.37
318.64
318.1
319.78
321.08
322.06
322.5
323.04
324.42
325
324.09
322.55
320.92
319.31
319.31
320.72
321.96
322.57
323.15
323.89
325.02
325.57
325.36
324.14
322.03
320.41
320.25
321.31
322.84
324
324.42
325.64
326.66
327.34
326.76
325.88
323.67
322.38
321.78
322.85
324.12
325.03
325.99
326.87
328.14
328.07
327.66
326.35
324.69
323.1
323.16
323.98
325.13
326.17
326.68
327.18
327.78
328.92
328.57
327.34
325.46
323.36
323.56
324.8
326.01
326.77
327.63
327.75
329.72
330.07
329.09
328.05
326.32
324.93
325.06
326.5
327.55
328.55
329.56
330.3
331.5
332.48
332.07
330.87
329.31
327.51
327.18
328.16
328.64
329.35
330.71
331.48
332.65
333.15
332.13
330.99
329.17
327.41
327.21
328.34
329.5
330.68
331.41
331.85
333.29
333.91
333.4
331.74
329.88
328.57
328.35
329.33
330.58
331.66
332.75
333.46
334.78
334.79
334.05
332.95
330.64
328.96
328.77
330.18
331.65
332.69
333.23
334.97
336.03
336.82
336.1
334.79
332.53
331.19
331.21
332.35
333.47
335.09
335.26
336.62
337.77
338
337.98
336.48
334.37
332.33
332.4
333.76
334.83
336.21
336.64
338.13
338.96
339.02
339.2
337.6
335.56
333.93
334.12
335.26
336.77
337.8
338.28
340.04
340.86
341.47
341.26
339.34
337.45
336.1
336.05
337.21
338.29
339.36
340.51
341.57
342.56
343.01
342.52
340.71
338.51
336.96
337.13
338.58
339.91
340.92
341.69
342.87
343.83
344.3
343.42
341.85
339.82
337.98
338.09
339.24
340.67
341.42
342.67


Summary of computational transaction
Raw Inputview raw input (R code)
Raw Outputview raw output of R engine
Computing time2 seconds
R Server'Gertrude Mary Cox' @ cox.wessa.net

\begin{tabular}{lllllllll}
\hline
Summary of computational transaction \tabularnewline
Raw Input & view raw input (R code)  \tabularnewline
Raw Output & view raw output of R engine  \tabularnewline
Computing time & 2 seconds \tabularnewline
R Server & 'Gertrude Mary Cox' @ cox.wessa.net \tabularnewline
\hline
\end{tabular}
%Source: https://freestatistics.org/blog/index.php?pk=159696&T=0

[TABLE]
[ROW][C]Summary of computational transaction[/C][/ROW]
[ROW][C]Raw Input[/C][C]view raw input (R code) [/C][/ROW]
[ROW][C]Raw Output[/C][C]view raw output of R engine [/C][/ROW]
[ROW][C]Computing time[/C][C]2 seconds[/C][/ROW]
[ROW][C]R Server[/C][C]'Gertrude Mary Cox' @ cox.wessa.net[/C][/ROW]
[/TABLE]
Source: https://freestatistics.org/blog/index.php?pk=159696&T=0

Globally Unique Identifier (entire table): ba.freestatistics.org/blog/index.php?pk=159696&T=0

As an alternative you can also use a QR Code:  

The GUIDs for individual cells are displayed in the table below:

Summary of computational transaction
Raw Inputview raw input (R code)
Raw Outputview raw output of R engine
Computing time2 seconds
R Server'Gertrude Mary Cox' @ cox.wessa.net


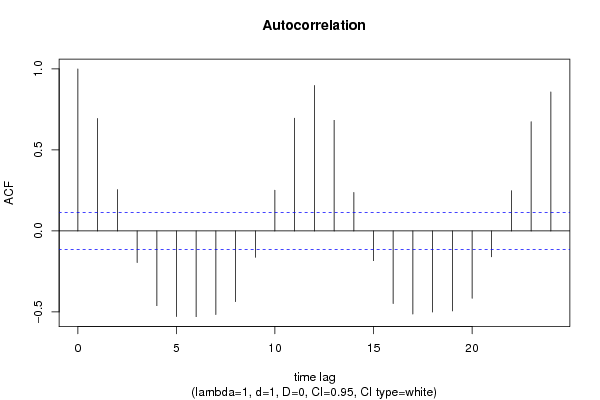
Autocorrelation Function
Time lag kACF(k)T-STATP-value
10.69452612.00950
20.2553364.41527e-06
3-0.194857-3.36940.000426
4-0.46107-7.97260
5-0.527979-9.12960
6-0.528846-9.14460
7-0.515284-8.91010
8-0.435931-7.53790
9-0.162538-2.81050.002636
100.2516334.35119e-06
110.69579912.03150
120.89803615.52850
130.68263211.80380
140.2375664.10792.6e-05
15-0.183299-3.16950.000843
16-0.447988-7.74640
17-0.512358-8.85950
18-0.500197-8.64920
19-0.493394-8.53160
20-0.415182-7.17920
21-0.159506-2.75810.003086
220.2478884.28641.2e-05
230.67396311.65390
240.85760414.82940

\begin{tabular}{lllllllll}
\hline
Autocorrelation Function \tabularnewline
Time lag k & ACF(k) & T-STAT & P-value \tabularnewline
1 & 0.694526 & 12.0095 & 0 \tabularnewline
2 & 0.255336 & 4.4152 & 7e-06 \tabularnewline
3 & -0.194857 & -3.3694 & 0.000426 \tabularnewline
4 & -0.46107 & -7.9726 & 0 \tabularnewline
5 & -0.527979 & -9.1296 & 0 \tabularnewline
6 & -0.528846 & -9.1446 & 0 \tabularnewline
7 & -0.515284 & -8.9101 & 0 \tabularnewline
8 & -0.435931 & -7.5379 & 0 \tabularnewline
9 & -0.162538 & -2.8105 & 0.002636 \tabularnewline
10 & 0.251633 & 4.3511 & 9e-06 \tabularnewline
11 & 0.695799 & 12.0315 & 0 \tabularnewline
12 & 0.898036 & 15.5285 & 0 \tabularnewline
13 & 0.682632 & 11.8038 & 0 \tabularnewline
14 & 0.237566 & 4.1079 & 2.6e-05 \tabularnewline
15 & -0.183299 & -3.1695 & 0.000843 \tabularnewline
16 & -0.447988 & -7.7464 & 0 \tabularnewline
17 & -0.512358 & -8.8595 & 0 \tabularnewline
18 & -0.500197 & -8.6492 & 0 \tabularnewline
19 & -0.493394 & -8.5316 & 0 \tabularnewline
20 & -0.415182 & -7.1792 & 0 \tabularnewline
21 & -0.159506 & -2.7581 & 0.003086 \tabularnewline
22 & 0.247888 & 4.2864 & 1.2e-05 \tabularnewline
23 & 0.673963 & 11.6539 & 0 \tabularnewline
24 & 0.857604 & 14.8294 & 0 \tabularnewline
\hline
\end{tabular}
%Source: https://freestatistics.org/blog/index.php?pk=159696&T=1

[TABLE]
[ROW][C]Autocorrelation Function[/C][/ROW]
[ROW][C]Time lag k[/C][C]ACF(k)[/C][C]T-STAT[/C][C]P-value[/C][/ROW]
[ROW][C]1[/C][C]0.694526[/C][C]12.0095[/C][C]0[/C][/ROW]
[ROW][C]2[/C][C]0.255336[/C][C]4.4152[/C][C]7e-06[/C][/ROW]
[ROW][C]3[/C][C]-0.194857[/C][C]-3.3694[/C][C]0.000426[/C][/ROW]
[ROW][C]4[/C][C]-0.46107[/C][C]-7.9726[/C][C]0[/C][/ROW]
[ROW][C]5[/C][C]-0.527979[/C][C]-9.1296[/C][C]0[/C][/ROW]
[ROW][C]6[/C][C]-0.528846[/C][C]-9.1446[/C][C]0[/C][/ROW]
[ROW][C]7[/C][C]-0.515284[/C][C]-8.9101[/C][C]0[/C][/ROW]
[ROW][C]8[/C][C]-0.435931[/C][C]-7.5379[/C][C]0[/C][/ROW]
[ROW][C]9[/C][C]-0.162538[/C][C]-2.8105[/C][C]0.002636[/C][/ROW]
[ROW][C]10[/C][C]0.251633[/C][C]4.3511[/C][C]9e-06[/C][/ROW]
[ROW][C]11[/C][C]0.695799[/C][C]12.0315[/C][C]0[/C][/ROW]
[ROW][C]12[/C][C]0.898036[/C][C]15.5285[/C][C]0[/C][/ROW]
[ROW][C]13[/C][C]0.682632[/C][C]11.8038[/C][C]0[/C][/ROW]
[ROW][C]14[/C][C]0.237566[/C][C]4.1079[/C][C]2.6e-05[/C][/ROW]
[ROW][C]15[/C][C]-0.183299[/C][C]-3.1695[/C][C]0.000843[/C][/ROW]
[ROW][C]16[/C][C]-0.447988[/C][C]-7.7464[/C][C]0[/C][/ROW]
[ROW][C]17[/C][C]-0.512358[/C][C]-8.8595[/C][C]0[/C][/ROW]
[ROW][C]18[/C][C]-0.500197[/C][C]-8.6492[/C][C]0[/C][/ROW]
[ROW][C]19[/C][C]-0.493394[/C][C]-8.5316[/C][C]0[/C][/ROW]
[ROW][C]20[/C][C]-0.415182[/C][C]-7.1792[/C][C]0[/C][/ROW]
[ROW][C]21[/C][C]-0.159506[/C][C]-2.7581[/C][C]0.003086[/C][/ROW]
[ROW][C]22[/C][C]0.247888[/C][C]4.2864[/C][C]1.2e-05[/C][/ROW]
[ROW][C]23[/C][C]0.673963[/C][C]11.6539[/C][C]0[/C][/ROW]
[ROW][C]24[/C][C]0.857604[/C][C]14.8294[/C][C]0[/C][/ROW]
[/TABLE]
Source: https://freestatistics.org/blog/index.php?pk=159696&T=1

Globally Unique Identifier (entire table): ba.freestatistics.org/blog/index.php?pk=159696&T=1

As an alternative you can also use a QR Code:  

The GUIDs for individual cells are displayed in the table below:

Autocorrelation Function
Time lag kACF(k)T-STATP-value
10.69452612.00950
20.2553364.41527e-06
3-0.194857-3.36940.000426
4-0.46107-7.97260
5-0.527979-9.12960
6-0.528846-9.14460
7-0.515284-8.91010
8-0.435931-7.53790
9-0.162538-2.81050.002636
100.2516334.35119e-06
110.69579912.03150
120.89803615.52850
130.68263211.80380
140.2375664.10792.6e-05
15-0.183299-3.16950.000843
16-0.447988-7.74640
17-0.512358-8.85950
18-0.500197-8.64920
19-0.493394-8.53160
20-0.415182-7.17920
21-0.159506-2.75810.003086
220.2478884.28641.2e-05
230.67396311.65390
240.85760414.82940


Partial Autocorrelation Function
Time lag kPACF(k)T-STATP-value
10.69452612.00950
2-0.438592-7.5840
3-0.347701-6.01230
4-0.085233-1.47380.07079
5-0.112413-1.94380.026429
6-0.393978-6.81250
7-0.495388-8.56610
8-0.501981-8.68010
9-0.309533-5.35230
10-0.243905-4.21751.6e-05
110.11566420.023201
120.3163215.46970
13-0.034234-0.5920.277163
14-0.164298-2.8410.002403
150.0545870.94390.172994
160.0083820.14490.442428
170.0406480.70290.241342
180.0968241.67420.047565
190.010670.18450.426871
20-0.090627-1.56710.059075
21-0.03619-0.62580.265968
22-0.01597-0.27610.391313
230.0565790.97830.164348
240.071791.24140.107721

\begin{tabular}{lllllllll}
\hline
Partial Autocorrelation Function \tabularnewline
Time lag k & PACF(k) & T-STAT & P-value \tabularnewline
1 & 0.694526 & 12.0095 & 0 \tabularnewline
2 & -0.438592 & -7.584 & 0 \tabularnewline
3 & -0.347701 & -6.0123 & 0 \tabularnewline
4 & -0.085233 & -1.4738 & 0.07079 \tabularnewline
5 & -0.112413 & -1.9438 & 0.026429 \tabularnewline
6 & -0.393978 & -6.8125 & 0 \tabularnewline
7 & -0.495388 & -8.5661 & 0 \tabularnewline
8 & -0.501981 & -8.6801 & 0 \tabularnewline
9 & -0.309533 & -5.3523 & 0 \tabularnewline
10 & -0.243905 & -4.2175 & 1.6e-05 \tabularnewline
11 & 0.115664 & 2 & 0.023201 \tabularnewline
12 & 0.316321 & 5.4697 & 0 \tabularnewline
13 & -0.034234 & -0.592 & 0.277163 \tabularnewline
14 & -0.164298 & -2.841 & 0.002403 \tabularnewline
15 & 0.054587 & 0.9439 & 0.172994 \tabularnewline
16 & 0.008382 & 0.1449 & 0.442428 \tabularnewline
17 & 0.040648 & 0.7029 & 0.241342 \tabularnewline
18 & 0.096824 & 1.6742 & 0.047565 \tabularnewline
19 & 0.01067 & 0.1845 & 0.426871 \tabularnewline
20 & -0.090627 & -1.5671 & 0.059075 \tabularnewline
21 & -0.03619 & -0.6258 & 0.265968 \tabularnewline
22 & -0.01597 & -0.2761 & 0.391313 \tabularnewline
23 & 0.056579 & 0.9783 & 0.164348 \tabularnewline
24 & 0.07179 & 1.2414 & 0.107721 \tabularnewline
\hline
\end{tabular}
%Source: https://freestatistics.org/blog/index.php?pk=159696&T=2

[TABLE]
[ROW][C]Partial Autocorrelation Function[/C][/ROW]
[ROW][C]Time lag k[/C][C]PACF(k)[/C][C]T-STAT[/C][C]P-value[/C][/ROW]
[ROW][C]1[/C][C]0.694526[/C][C]12.0095[/C][C]0[/C][/ROW]
[ROW][C]2[/C][C]-0.438592[/C][C]-7.584[/C][C]0[/C][/ROW]
[ROW][C]3[/C][C]-0.347701[/C][C]-6.0123[/C][C]0[/C][/ROW]
[ROW][C]4[/C][C]-0.085233[/C][C]-1.4738[/C][C]0.07079[/C][/ROW]
[ROW][C]5[/C][C]-0.112413[/C][C]-1.9438[/C][C]0.026429[/C][/ROW]
[ROW][C]6[/C][C]-0.393978[/C][C]-6.8125[/C][C]0[/C][/ROW]
[ROW][C]7[/C][C]-0.495388[/C][C]-8.5661[/C][C]0[/C][/ROW]
[ROW][C]8[/C][C]-0.501981[/C][C]-8.6801[/C][C]0[/C][/ROW]
[ROW][C]9[/C][C]-0.309533[/C][C]-5.3523[/C][C]0[/C][/ROW]
[ROW][C]10[/C][C]-0.243905[/C][C]-4.2175[/C][C]1.6e-05[/C][/ROW]
[ROW][C]11[/C][C]0.115664[/C][C]2[/C][C]0.023201[/C][/ROW]
[ROW][C]12[/C][C]0.316321[/C][C]5.4697[/C][C]0[/C][/ROW]
[ROW][C]13[/C][C]-0.034234[/C][C]-0.592[/C][C]0.277163[/C][/ROW]
[ROW][C]14[/C][C]-0.164298[/C][C]-2.841[/C][C]0.002403[/C][/ROW]
[ROW][C]15[/C][C]0.054587[/C][C]0.9439[/C][C]0.172994[/C][/ROW]
[ROW][C]16[/C][C]0.008382[/C][C]0.1449[/C][C]0.442428[/C][/ROW]
[ROW][C]17[/C][C]0.040648[/C][C]0.7029[/C][C]0.241342[/C][/ROW]
[ROW][C]18[/C][C]0.096824[/C][C]1.6742[/C][C]0.047565[/C][/ROW]
[ROW][C]19[/C][C]0.01067[/C][C]0.1845[/C][C]0.426871[/C][/ROW]
[ROW][C]20[/C][C]-0.090627[/C][C]-1.5671[/C][C]0.059075[/C][/ROW]
[ROW][C]21[/C][C]-0.03619[/C][C]-0.6258[/C][C]0.265968[/C][/ROW]
[ROW][C]22[/C][C]-0.01597[/C][C]-0.2761[/C][C]0.391313[/C][/ROW]
[ROW][C]23[/C][C]0.056579[/C][C]0.9783[/C][C]0.164348[/C][/ROW]
[ROW][C]24[/C][C]0.07179[/C][C]1.2414[/C][C]0.107721[/C][/ROW]
[/TABLE]
Source: https://freestatistics.org/blog/index.php?pk=159696&T=2

Globally Unique Identifier (entire table): ba.freestatistics.org/blog/index.php?pk=159696&T=2

As an alternative you can also use a QR Code:  

The GUIDs for individual cells are displayed in the table below:

Partial Autocorrelation Function
Time lag kPACF(k)T-STATP-value
10.69452612.00950
2-0.438592-7.5840
3-0.347701-6.01230
4-0.085233-1.47380.07079
5-0.112413-1.94380.026429
6-0.393978-6.81250
7-0.495388-8.56610
8-0.501981-8.68010
9-0.309533-5.35230
10-0.243905-4.21751.6e-05
110.11566420.023201
120.3163215.46970
13-0.034234-0.5920.277163
14-0.164298-2.8410.002403
150.0545870.94390.172994
160.0083820.14490.442428
170.0406480.70290.241342
180.0968241.67420.047565
190.010670.18450.426871
20-0.090627-1.56710.059075
21-0.03619-0.62580.265968
22-0.01597-0.27610.391313
230.0565790.97830.164348
240.071791.24140.107721


Parameters (Session):
par1 = Default ; par2 = 1 ; par3 = 1 ; par4 = 0 ; par5 = 12 ; par6 = White Noise ; par7 = 0.95 ;
Parameters (R input):
par1 = Default ; par2 = 1 ; par3 = 1 ; par4 = 0 ; par5 = 12 ; par6 = White Noise ; par7 = 0.95 ; par8 = ;
R code (references can be found in the software module):
if (par1 == 'Default') {
par1 = 10*log10(length(x))
} else {
par1 <- as.numeric(par1)
}
par2 <- as.numeric(par2)
par3 <- as.numeric(par3)
par4 <- as.numeric(par4)
par5 <- as.numeric(par5)
if (par6 == 'White Noise') par6 <- 'white' else par6 <- 'ma'
par7 <- as.numeric(par7)
if (par8 != '') par8 <- as.numeric(par8)
ox <- x
if (par8 == '') {
if (par2 == 0) {
x <- log(x)
} else {
x <- (x ^ par2 - 1) / par2
}
} else {
x <- log(x,base=par8)
}
if (par3 > 0) x <- diff(x,lag=1,difference=par3)
if (par4 > 0) x <- diff(x,lag=par5,difference=par4)
bitmap(file='picts.png')
op <- par(mfrow=c(2,1))
plot(ox,type='l',main='Original Time Series',xlab='time',ylab='value')
if (par8=='') {
mytitle <- paste('Working Time Series (lambda=',par2,', d=',par3,', D=',par4,')',sep='')
mysub <- paste('(lambda=',par2,', d=',par3,', D=',par4,', CI=', par7, ', CI type=',par6,')',sep='')
} else {
mytitle <- paste('Working Time Series (base=',par8,', d=',par3,', D=',par4,')',sep='')
mysub <- paste('(base=',par8,', d=',par3,', D=',par4,', CI=', par7, ', CI type=',par6,')',sep='')
}
plot(x,type='l', main=mytitle,xlab='time',ylab='value')
par(op)
dev.off()
bitmap(file='pic1.png')
racf <- acf(x, par1, main='Autocorrelation', xlab='time lag', ylab='ACF', ci.type=par6, ci=par7, sub=mysub)
dev.off()
bitmap(file='pic2.png')
rpacf <- pacf(x,par1,main='Partial Autocorrelation',xlab='lags',ylab='PACF',sub=mysub)
dev.off()
(myacf <- c(racf$acf))
(mypacf <- c(rpacf$acf))
lengthx <- length(x)
sqrtn <- sqrt(lengthx)
load(file='createtable')
a<-table.start()
a<-table.row.start(a)
a<-table.element(a,'Autocorrelation Function',4,TRUE)
a<-table.row.end(a)
a<-table.row.start(a)
a<-table.element(a,'Time lag k',header=TRUE)
a<-table.element(a,hyperlink('basics.htm','ACF(k)','click here for more information about the Autocorrelation Function'),header=TRUE)
a<-table.element(a,'T-STAT',header=TRUE)
a<-table.element(a,'P-value',header=TRUE)
a<-table.row.end(a)
for (i in 2:(par1+1)) {
a<-table.row.start(a)
a<-table.element(a,i-1,header=TRUE)
a<-table.element(a,round(myacf[i],6))
mytstat <- myacf[i]*sqrtn
a<-table.element(a,round(mytstat,4))
a<-table.element(a,round(1-pt(abs(mytstat),lengthx),6))
a<-table.row.end(a)
}
a<-table.end(a)
table.save(a,file='mytable.tab')
a<-table.start()
a<-table.row.start(a)
a<-table.element(a,'Partial Autocorrelation Function',4,TRUE)
a<-table.row.end(a)
a<-table.row.start(a)
a<-table.element(a,'Time lag k',header=TRUE)
a<-table.element(a,hyperlink('basics.htm','PACF(k)','click here for more information about the Partial Autocorrelation Function'),header=TRUE)
a<-table.element(a,'T-STAT',header=TRUE)
a<-table.element(a,'P-value',header=TRUE)
a<-table.row.end(a)
for (i in 1:par1) {
a<-table.row.start(a)
a<-table.element(a,i,header=TRUE)
a<-table.element(a,round(mypacf[i],6))
mytstat <- mypacf[i]*sqrtn
a<-table.element(a,round(mytstat,4))
a<-table.element(a,round(1-pt(abs(mytstat),lengthx),6))
a<-table.row.end(a)
}
a<-table.end(a)
table.save(a,file='mytable1.tab')