Free Statistics

of Irreproducible Research!

Author's title

Author*The author of this computation has been verified*
R Software Modulerwasp_multipleregression.wasp
Title produced by softwareMultiple Regression
Date of computationThu, 22 Dec 2011 08:45:12 -0500
Cite this page as followsStatistical Computations at FreeStatistics.org, Office for Research Development and Education, URL https://freestatistics.org/blog/index.php?v=date/2011/Dec/22/t13245617709ngb24u025aghrd.htm/, Retrieved Fri, 03 May 2024 11:31:52 +0000
Statistical Computations at FreeStatistics.org, Office for Research Development and Education, URL https://freestatistics.org/blog/index.php?pk=159454, Retrieved Fri, 03 May 2024 11:31:52 +0000
QR Codes:

Original text written by user:
IsPrivate?No (this computation is public)
User-defined keywords
Estimated Impact119
Family? (F = Feedback message, R = changed R code, M = changed R Module, P = changed Parameters, D = changed Data)
-     [Testing Mean with unknown Variance - Critical Value] [] [2010-10-25 13:12:27] [b98453cac15ba1066b407e146608df68]
- RMPD    [Multiple Regression] [] [2011-12-22 13:45:12] [95610e892c4b5c84ff80f4c898567a9d] [Current]
- R  D      [Multiple Regression] [] [2011-12-22 14:08:42] [5a05da414fd67612c3b80d44effe0727]
- RM D      [Standard Deviation-Mean Plot] [] [2011-12-22 14:51:14] [5a05da414fd67612c3b80d44effe0727]
- RM D      [Variance Reduction Matrix] [] [2011-12-22 15:02:19] [5a05da414fd67612c3b80d44effe0727]
- RM D      [(Partial) Autocorrelation Function] [] [2011-12-22 15:18:49] [5a05da414fd67612c3b80d44effe0727]
- R           [(Partial) Autocorrelation Function] [] [2011-12-22 15:20:17] [5a05da414fd67612c3b80d44effe0727]
-               [(Partial) Autocorrelation Function] [] [2011-12-22 15:29:46] [5a05da414fd67612c3b80d44effe0727]
- RM              [Variance Reduction Matrix] [] [2011-12-22 15:48:25] [5a05da414fd67612c3b80d44effe0727]
- RM              [Variance Reduction Matrix] [] [2011-12-22 15:48:57] [5a05da414fd67612c3b80d44effe0727]
- RM              [Spectral Analysis] [] [2011-12-22 15:57:30] [5a05da414fd67612c3b80d44effe0727]
- RM              [Exponential Smoothing] [] [2011-12-22 16:47:54] [5a05da414fd67612c3b80d44effe0727]
- RM                [Classical Decomposition] [] [2011-12-22 16:54:59] [5a05da414fd67612c3b80d44effe0727]
- RM                  [Decomposition by Loess] [] [2011-12-22 17:21:01] [5a05da414fd67612c3b80d44effe0727]
- RM                  [Structural Time Series Models] [] [2011-12-22 18:01:39] [5a05da414fd67612c3b80d44effe0727]
- RM D                [Kendall tau Correlation Matrix] [] [2011-12-22 19:00:08] [5a05da414fd67612c3b80d44effe0727]
- RM            [Spectral Analysis] [] [2011-12-22 15:33:22] [5a05da414fd67612c3b80d44effe0727]
- RM              [(Partial) Autocorrelation Function] [] [2011-12-22 15:54:31] [5a05da414fd67612c3b80d44effe0727]
Feedback Forum

Post a new message
Dataseries X:
7.9	17382
7.9	9367
8.0	31124
8.0	26551
7.9	30651
8.0	25859
7.7	25100
7.2	25778
7.5	20418
7.3	18688
7.0	20424
7.0	24776
7.0	19814
7.2	12738
7.3	31566
7.1	30111
6.8	30019
6.4	31934
6.1	25826
6.5	26835
7.7	20205
7.9	17789
7.5	20520
6.9	22518
6.6	15572
6.9	11509
7.7	25447
8.0	24090
8.0	27786
7.7	26195
7.3	20516
7.4	22759
8.1	19028
8.3	16971
8.1	20036
7.9	22485
7.9	18730
8.3	14538
8.6	27561
8.7	25985
8.5	34670
8.3	32066
8.0	27186
8.0	29586
8.8	21359
8.7	21553
8.5	19573
8.1	24256
7.8	22380
7.6	16167
7.4	27297
7.1	28287
6.9	33474
6.7	28229
6.6	28785
6.5	25597
7.1	18130
7.2	20198
6.9	22849
6.7	23118


Summary of computational transaction
Raw Inputview raw input (R code)
Raw Outputview raw output of R engine
Computing time4 seconds
R Server'Herman Ole Andreas Wold' @ wold.wessa.net

\begin{tabular}{lllllllll}
\hline
Summary of computational transaction \tabularnewline
Raw Input & view raw input (R code)  \tabularnewline
Raw Output & view raw output of R engine  \tabularnewline
Computing time & 4 seconds \tabularnewline
R Server & 'Herman Ole Andreas Wold' @ wold.wessa.net \tabularnewline
\hline
\end{tabular}
%Source: https://freestatistics.org/blog/index.php?pk=159454&T=0

[TABLE]
[ROW][C]Summary of computational transaction[/C][/ROW]
[ROW][C]Raw Input[/C][C]view raw input (R code) [/C][/ROW]
[ROW][C]Raw Output[/C][C]view raw output of R engine [/C][/ROW]
[ROW][C]Computing time[/C][C]4 seconds[/C][/ROW]
[ROW][C]R Server[/C][C]'Herman Ole Andreas Wold' @ wold.wessa.net[/C][/ROW]
[/TABLE]
Source: https://freestatistics.org/blog/index.php?pk=159454&T=0

Globally Unique Identifier (entire table): ba.freestatistics.org/blog/index.php?pk=159454&T=0

As an alternative you can also use a QR Code:  

The GUIDs for individual cells are displayed in the table below:

Summary of computational transaction
Raw Inputview raw input (R code)
Raw Outputview raw output of R engine
Computing time4 seconds
R Server'Herman Ole Andreas Wold' @ wold.wessa.net


Multiple Linear Regression - Estimated Regression Equation
Werkloosheid[t] = + 7.52963040790557 -8.94686469427015e-06Wagens[t] + 0.0783523448481761M1[t] + 0.165460270148586M2[t] + 0.526240975485866M3[t] + 0.49197788379026M4[t] + 0.370585394318975M5[t] + 0.14854568783111M6[t] -0.161641033647358M7[t] -0.176018823873478M8[t] + 0.487768025252422M9[t] + 0.520716106500399M10[t] + 0.255394332717818M11[t] + e[t]

\begin{tabular}{lllllllll}
\hline
Multiple Linear Regression - Estimated Regression Equation \tabularnewline
Werkloosheid[t] =  +  7.52963040790557 -8.94686469427015e-06Wagens[t] +  0.0783523448481761M1[t] +  0.165460270148586M2[t] +  0.526240975485866M3[t] +  0.49197788379026M4[t] +  0.370585394318975M5[t] +  0.14854568783111M6[t] -0.161641033647358M7[t] -0.176018823873478M8[t] +  0.487768025252422M9[t] +  0.520716106500399M10[t] +  0.255394332717818M11[t]  + e[t] \tabularnewline
\hline
\end{tabular}
%Source: https://freestatistics.org/blog/index.php?pk=159454&T=1

[TABLE]
[ROW][C]Multiple Linear Regression - Estimated Regression Equation[/C][/ROW]
[ROW][C]Werkloosheid[t] =  +  7.52963040790557 -8.94686469427015e-06Wagens[t] +  0.0783523448481761M1[t] +  0.165460270148586M2[t] +  0.526240975485866M3[t] +  0.49197788379026M4[t] +  0.370585394318975M5[t] +  0.14854568783111M6[t] -0.161641033647358M7[t] -0.176018823873478M8[t] +  0.487768025252422M9[t] +  0.520716106500399M10[t] +  0.255394332717818M11[t]  + e[t][/C][/ROW]
[/TABLE]
Source: https://freestatistics.org/blog/index.php?pk=159454&T=1

Globally Unique Identifier (entire table): ba.freestatistics.org/blog/index.php?pk=159454&T=1

As an alternative you can also use a QR Code:  

The GUIDs for individual cells are displayed in the table below:

Multiple Linear Regression - Estimated Regression Equation
Werkloosheid[t] = + 7.52963040790557 -8.94686469427015e-06Wagens[t] + 0.0783523448481761M1[t] + 0.165460270148586M2[t] + 0.526240975485866M3[t] + 0.49197788379026M4[t] + 0.370585394318975M5[t] + 0.14854568783111M6[t] -0.161641033647358M7[t] -0.176018823873478M8[t] + 0.487768025252422M9[t] + 0.520716106500399M10[t] + 0.255394332717818M11[t] + e[t]


Multiple Linear Regression - Ordinary Least Squares
VariableParameterS.D.T-STATH0: parameter = 02-tail p-value1-tail p-value
(Intercept)7.529630407905571.0219977.367600
Wagens-8.94686469427015e-064.2e-05-0.21470.8309030.415452
M10.07835234484817610.4695930.16690.8682030.434101
M20.1654602701485860.6137860.26960.7886690.394334
M30.5262409754858660.4788241.0990.2773540.138677
M40.491977883790260.4528551.08640.2828470.141423
M50.3705853943189750.5393990.6870.4954380.247719
M60.148545687831110.4837460.30710.7601440.380072
M7-0.1616410336473580.436132-0.37060.7125830.356291
M8-0.1760188238734780.442011-0.39820.6922690.346135
M90.4877680252524220.4532461.07620.2873460.143673
M100.5207161065003990.4651551.11940.2686380.134319
M110.2553943327178180.4427540.57680.5668070.283403

\begin{tabular}{lllllllll}
\hline
Multiple Linear Regression - Ordinary Least Squares \tabularnewline
Variable & Parameter & S.D. & T-STATH0: parameter = 0 & 2-tail p-value & 1-tail p-value \tabularnewline
(Intercept) & 7.52963040790557 & 1.021997 & 7.3676 & 0 & 0 \tabularnewline
Wagens & -8.94686469427015e-06 & 4.2e-05 & -0.2147 & 0.830903 & 0.415452 \tabularnewline
M1 & 0.0783523448481761 & 0.469593 & 0.1669 & 0.868203 & 0.434101 \tabularnewline
M2 & 0.165460270148586 & 0.613786 & 0.2696 & 0.788669 & 0.394334 \tabularnewline
M3 & 0.526240975485866 & 0.478824 & 1.099 & 0.277354 & 0.138677 \tabularnewline
M4 & 0.49197788379026 & 0.452855 & 1.0864 & 0.282847 & 0.141423 \tabularnewline
M5 & 0.370585394318975 & 0.539399 & 0.687 & 0.495438 & 0.247719 \tabularnewline
M6 & 0.14854568783111 & 0.483746 & 0.3071 & 0.760144 & 0.380072 \tabularnewline
M7 & -0.161641033647358 & 0.436132 & -0.3706 & 0.712583 & 0.356291 \tabularnewline
M8 & -0.176018823873478 & 0.442011 & -0.3982 & 0.692269 & 0.346135 \tabularnewline
M9 & 0.487768025252422 & 0.453246 & 1.0762 & 0.287346 & 0.143673 \tabularnewline
M10 & 0.520716106500399 & 0.465155 & 1.1194 & 0.268638 & 0.134319 \tabularnewline
M11 & 0.255394332717818 & 0.442754 & 0.5768 & 0.566807 & 0.283403 \tabularnewline
\hline
\end{tabular}
%Source: https://freestatistics.org/blog/index.php?pk=159454&T=2

[TABLE]
[ROW][C]Multiple Linear Regression - Ordinary Least Squares[/C][/ROW]
[ROW][C]Variable[/C][C]Parameter[/C][C]S.D.[/C][C]T-STATH0: parameter = 0[/C][C]2-tail p-value[/C][C]1-tail p-value[/C][/ROW]
[ROW][C](Intercept)[/C][C]7.52963040790557[/C][C]1.021997[/C][C]7.3676[/C][C]0[/C][C]0[/C][/ROW]
[ROW][C]Wagens[/C][C]-8.94686469427015e-06[/C][C]4.2e-05[/C][C]-0.2147[/C][C]0.830903[/C][C]0.415452[/C][/ROW]
[ROW][C]M1[/C][C]0.0783523448481761[/C][C]0.469593[/C][C]0.1669[/C][C]0.868203[/C][C]0.434101[/C][/ROW]
[ROW][C]M2[/C][C]0.165460270148586[/C][C]0.613786[/C][C]0.2696[/C][C]0.788669[/C][C]0.394334[/C][/ROW]
[ROW][C]M3[/C][C]0.526240975485866[/C][C]0.478824[/C][C]1.099[/C][C]0.277354[/C][C]0.138677[/C][/ROW]
[ROW][C]M4[/C][C]0.49197788379026[/C][C]0.452855[/C][C]1.0864[/C][C]0.282847[/C][C]0.141423[/C][/ROW]
[ROW][C]M5[/C][C]0.370585394318975[/C][C]0.539399[/C][C]0.687[/C][C]0.495438[/C][C]0.247719[/C][/ROW]
[ROW][C]M6[/C][C]0.14854568783111[/C][C]0.483746[/C][C]0.3071[/C][C]0.760144[/C][C]0.380072[/C][/ROW]
[ROW][C]M7[/C][C]-0.161641033647358[/C][C]0.436132[/C][C]-0.3706[/C][C]0.712583[/C][C]0.356291[/C][/ROW]
[ROW][C]M8[/C][C]-0.176018823873478[/C][C]0.442011[/C][C]-0.3982[/C][C]0.692269[/C][C]0.346135[/C][/ROW]
[ROW][C]M9[/C][C]0.487768025252422[/C][C]0.453246[/C][C]1.0762[/C][C]0.287346[/C][C]0.143673[/C][/ROW]
[ROW][C]M10[/C][C]0.520716106500399[/C][C]0.465155[/C][C]1.1194[/C][C]0.268638[/C][C]0.134319[/C][/ROW]
[ROW][C]M11[/C][C]0.255394332717818[/C][C]0.442754[/C][C]0.5768[/C][C]0.566807[/C][C]0.283403[/C][/ROW]
[/TABLE]
Source: https://freestatistics.org/blog/index.php?pk=159454&T=2

Globally Unique Identifier (entire table): ba.freestatistics.org/blog/index.php?pk=159454&T=2

As an alternative you can also use a QR Code:  

The GUIDs for individual cells are displayed in the table below:

Multiple Linear Regression - Ordinary Least Squares
VariableParameterS.D.T-STATH0: parameter = 02-tail p-value1-tail p-value
(Intercept)7.529630407905571.0219977.367600
Wagens-8.94686469427015e-064.2e-05-0.21470.8309030.415452
M10.07835234484817610.4695930.16690.8682030.434101
M20.1654602701485860.6137860.26960.7886690.394334
M30.5262409754858660.4788241.0990.2773540.138677
M40.491977883790260.4528551.08640.2828470.141423
M50.3705853943189750.5393990.6870.4954380.247719
M60.148545687831110.4837460.30710.7601440.380072
M7-0.1616410336473580.436132-0.37060.7125830.356291
M8-0.1760188238734780.442011-0.39820.6922690.346135
M90.4877680252524220.4532461.07620.2873460.143673
M100.5207161065003990.4651551.11940.2686380.134319
M110.2553943327178180.4427540.57680.5668070.283403


Multiple Linear Regression - Regression Statistics
Multiple R0.386649412748352
R-squared0.149497768378646
Adjusted R-squared-0.0676517375672321
F-TEST (value)0.688455484747483
F-TEST (DF numerator)12
F-TEST (DF denominator)47
p-value0.753866739721577
Multiple Linear Regression - Residual Statistics
Residual Standard Deviation0.676205238259399
Sum Squared Residuals21.4909156397242

\begin{tabular}{lllllllll}
\hline
Multiple Linear Regression - Regression Statistics \tabularnewline
Multiple R & 0.386649412748352 \tabularnewline
R-squared & 0.149497768378646 \tabularnewline
Adjusted R-squared & -0.0676517375672321 \tabularnewline
F-TEST (value) & 0.688455484747483 \tabularnewline
F-TEST (DF numerator) & 12 \tabularnewline
F-TEST (DF denominator) & 47 \tabularnewline
p-value & 0.753866739721577 \tabularnewline
Multiple Linear Regression - Residual Statistics \tabularnewline
Residual Standard Deviation & 0.676205238259399 \tabularnewline
Sum Squared Residuals & 21.4909156397242 \tabularnewline
\hline
\end{tabular}
%Source: https://freestatistics.org/blog/index.php?pk=159454&T=3

[TABLE]
[ROW][C]Multiple Linear Regression - Regression Statistics[/C][/ROW]
[ROW][C]Multiple R[/C][C]0.386649412748352[/C][/ROW]
[ROW][C]R-squared[/C][C]0.149497768378646[/C][/ROW]
[ROW][C]Adjusted R-squared[/C][C]-0.0676517375672321[/C][/ROW]
[ROW][C]F-TEST (value)[/C][C]0.688455484747483[/C][/ROW]
[ROW][C]F-TEST (DF numerator)[/C][C]12[/C][/ROW]
[ROW][C]F-TEST (DF denominator)[/C][C]47[/C][/ROW]
[ROW][C]p-value[/C][C]0.753866739721577[/C][/ROW]
[ROW][C]Multiple Linear Regression - Residual Statistics[/C][/ROW]
[ROW][C]Residual Standard Deviation[/C][C]0.676205238259399[/C][/ROW]
[ROW][C]Sum Squared Residuals[/C][C]21.4909156397242[/C][/ROW]
[/TABLE]
Source: https://freestatistics.org/blog/index.php?pk=159454&T=3

Globally Unique Identifier (entire table): ba.freestatistics.org/blog/index.php?pk=159454&T=3

As an alternative you can also use a QR Code:  

The GUIDs for individual cells are displayed in the table below:

Multiple Linear Regression - Regression Statistics
Multiple R0.386649412748352
R-squared0.149497768378646
Adjusted R-squared-0.0676517375672321
F-TEST (value)0.688455484747483
F-TEST (DF numerator)12
F-TEST (DF denominator)47
p-value0.753866739721577
Multiple Linear Regression - Residual Statistics
Residual Standard Deviation0.676205238259399
Sum Squared Residuals21.4909156397242


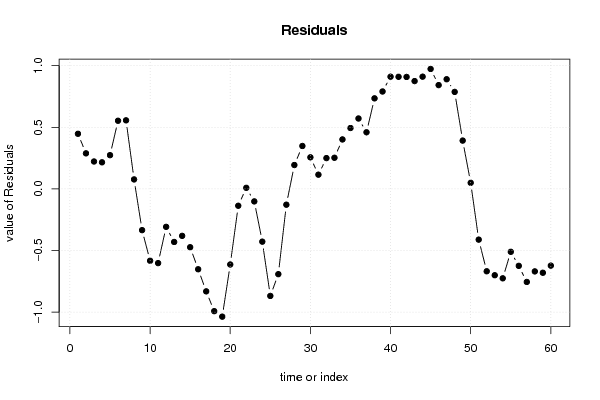
Multiple Linear Regression - Actuals, Interpolation, and Residuals
Time or IndexActualsInterpolationForecastResidualsPrediction Error
17.97.452468350637920.44753164936208
27.97.611285396462920.288714603537076
387.777409166646970.222590833353032
487.784060087198260.21593991280174
57.97.625985452480470.274014547519533
687.446819121607550.553180878392455
77.77.143423070432030.556576929567973
87.27.122979305943190.0770206940568081
97.57.83472134983038-0.334721349830381
107.37.88314750699944-0.583147506999444
1177.60229397610761-0.602293976107611
1277.30796288824033-0.307962888240329
1377.43070957570147-0.430709575701474
147.27.58112551557854-0.381125515578539
157.37.7734546524521-0.473454652452101
167.17.75220924888666-0.652209248886658
176.87.63163987096725-0.831639870967246
186.47.39246691858985-0.992466918589853
196.17.13692764666399-1.03692764666399
206.57.11352246996135-0.613522469961348
217.77.83662703201026-0.13662703201026
227.97.891190738359590.00880926164040725
237.57.60143507709696-0.101435077096961
246.97.32816490871999-0.42816490871999
256.67.46866217573457-0.868662175734568
266.97.5921212122878-0.692121212287797
277.77.82820051751634-0.128200517516339
2887.806078321210860.193921678789142
2987.651618219829550.348381780170449
307.77.443812975070270.25618702492973
317.37.184435498190560.115564501809438
327.47.149989890455190.250010109544807
338.17.847157491755420.252842508244584
348.37.898509273679510.401490726320495
358.17.605765359608990.494234640391012
367.97.32846015525490.571539844745099
377.97.440407977030060.459592022969938
388.37.565021159128850.734978840871147
398.67.809286845552650.790713154447347
408.77.789124012615220.910875987384783
418.57.59002800327420.909971996725805
428.37.391285932450210.908714067549791
4387.124759910679780.87524008932022
4487.088909645187410.911090354812589
458.87.826302350153070.973697649846929
468.77.857514739650360.842485260349639
478.57.609907757962430.890092242037565
488.17.312615257881350.78738474211865
497.87.407751920895980.392248079104023
507.67.550446716541890.0495532834581125
517.47.81164881783194-0.411648817831939
527.17.76852833008901-0.668528330089007
536.97.60072845344854-0.700728453448542
546.77.42561505228212-0.725615052282124
556.67.11045387403364-0.510453874033642
566.57.12459868845286-0.624598688452855
577.17.85519177625087-0.755191776250871
587.27.8696377413111-0.669637741311096
596.97.58059782922401-0.680597829224005
606.77.32279678990343-0.622796789903429

\begin{tabular}{lllllllll}
\hline
Multiple Linear Regression - Actuals, Interpolation, and Residuals \tabularnewline
Time or Index & Actuals & InterpolationForecast & ResidualsPrediction Error \tabularnewline
1 & 7.9 & 7.45246835063792 & 0.44753164936208 \tabularnewline
2 & 7.9 & 7.61128539646292 & 0.288714603537076 \tabularnewline
3 & 8 & 7.77740916664697 & 0.222590833353032 \tabularnewline
4 & 8 & 7.78406008719826 & 0.21593991280174 \tabularnewline
5 & 7.9 & 7.62598545248047 & 0.274014547519533 \tabularnewline
6 & 8 & 7.44681912160755 & 0.553180878392455 \tabularnewline
7 & 7.7 & 7.14342307043203 & 0.556576929567973 \tabularnewline
8 & 7.2 & 7.12297930594319 & 0.0770206940568081 \tabularnewline
9 & 7.5 & 7.83472134983038 & -0.334721349830381 \tabularnewline
10 & 7.3 & 7.88314750699944 & -0.583147506999444 \tabularnewline
11 & 7 & 7.60229397610761 & -0.602293976107611 \tabularnewline
12 & 7 & 7.30796288824033 & -0.307962888240329 \tabularnewline
13 & 7 & 7.43070957570147 & -0.430709575701474 \tabularnewline
14 & 7.2 & 7.58112551557854 & -0.381125515578539 \tabularnewline
15 & 7.3 & 7.7734546524521 & -0.473454652452101 \tabularnewline
16 & 7.1 & 7.75220924888666 & -0.652209248886658 \tabularnewline
17 & 6.8 & 7.63163987096725 & -0.831639870967246 \tabularnewline
18 & 6.4 & 7.39246691858985 & -0.992466918589853 \tabularnewline
19 & 6.1 & 7.13692764666399 & -1.03692764666399 \tabularnewline
20 & 6.5 & 7.11352246996135 & -0.613522469961348 \tabularnewline
21 & 7.7 & 7.83662703201026 & -0.13662703201026 \tabularnewline
22 & 7.9 & 7.89119073835959 & 0.00880926164040725 \tabularnewline
23 & 7.5 & 7.60143507709696 & -0.101435077096961 \tabularnewline
24 & 6.9 & 7.32816490871999 & -0.42816490871999 \tabularnewline
25 & 6.6 & 7.46866217573457 & -0.868662175734568 \tabularnewline
26 & 6.9 & 7.5921212122878 & -0.692121212287797 \tabularnewline
27 & 7.7 & 7.82820051751634 & -0.128200517516339 \tabularnewline
28 & 8 & 7.80607832121086 & 0.193921678789142 \tabularnewline
29 & 8 & 7.65161821982955 & 0.348381780170449 \tabularnewline
30 & 7.7 & 7.44381297507027 & 0.25618702492973 \tabularnewline
31 & 7.3 & 7.18443549819056 & 0.115564501809438 \tabularnewline
32 & 7.4 & 7.14998989045519 & 0.250010109544807 \tabularnewline
33 & 8.1 & 7.84715749175542 & 0.252842508244584 \tabularnewline
34 & 8.3 & 7.89850927367951 & 0.401490726320495 \tabularnewline
35 & 8.1 & 7.60576535960899 & 0.494234640391012 \tabularnewline
36 & 7.9 & 7.3284601552549 & 0.571539844745099 \tabularnewline
37 & 7.9 & 7.44040797703006 & 0.459592022969938 \tabularnewline
38 & 8.3 & 7.56502115912885 & 0.734978840871147 \tabularnewline
39 & 8.6 & 7.80928684555265 & 0.790713154447347 \tabularnewline
40 & 8.7 & 7.78912401261522 & 0.910875987384783 \tabularnewline
41 & 8.5 & 7.5900280032742 & 0.909971996725805 \tabularnewline
42 & 8.3 & 7.39128593245021 & 0.908714067549791 \tabularnewline
43 & 8 & 7.12475991067978 & 0.87524008932022 \tabularnewline
44 & 8 & 7.08890964518741 & 0.911090354812589 \tabularnewline
45 & 8.8 & 7.82630235015307 & 0.973697649846929 \tabularnewline
46 & 8.7 & 7.85751473965036 & 0.842485260349639 \tabularnewline
47 & 8.5 & 7.60990775796243 & 0.890092242037565 \tabularnewline
48 & 8.1 & 7.31261525788135 & 0.78738474211865 \tabularnewline
49 & 7.8 & 7.40775192089598 & 0.392248079104023 \tabularnewline
50 & 7.6 & 7.55044671654189 & 0.0495532834581125 \tabularnewline
51 & 7.4 & 7.81164881783194 & -0.411648817831939 \tabularnewline
52 & 7.1 & 7.76852833008901 & -0.668528330089007 \tabularnewline
53 & 6.9 & 7.60072845344854 & -0.700728453448542 \tabularnewline
54 & 6.7 & 7.42561505228212 & -0.725615052282124 \tabularnewline
55 & 6.6 & 7.11045387403364 & -0.510453874033642 \tabularnewline
56 & 6.5 & 7.12459868845286 & -0.624598688452855 \tabularnewline
57 & 7.1 & 7.85519177625087 & -0.755191776250871 \tabularnewline
58 & 7.2 & 7.8696377413111 & -0.669637741311096 \tabularnewline
59 & 6.9 & 7.58059782922401 & -0.680597829224005 \tabularnewline
60 & 6.7 & 7.32279678990343 & -0.622796789903429 \tabularnewline
\hline
\end{tabular}
%Source: https://freestatistics.org/blog/index.php?pk=159454&T=4

[TABLE]
[ROW][C]Multiple Linear Regression - Actuals, Interpolation, and Residuals[/C][/ROW]
[ROW][C]Time or Index[/C][C]Actuals[/C][C]InterpolationForecast[/C][C]ResidualsPrediction Error[/C][/ROW]
[ROW][C]1[/C][C]7.9[/C][C]7.45246835063792[/C][C]0.44753164936208[/C][/ROW]
[ROW][C]2[/C][C]7.9[/C][C]7.61128539646292[/C][C]0.288714603537076[/C][/ROW]
[ROW][C]3[/C][C]8[/C][C]7.77740916664697[/C][C]0.222590833353032[/C][/ROW]
[ROW][C]4[/C][C]8[/C][C]7.78406008719826[/C][C]0.21593991280174[/C][/ROW]
[ROW][C]5[/C][C]7.9[/C][C]7.62598545248047[/C][C]0.274014547519533[/C][/ROW]
[ROW][C]6[/C][C]8[/C][C]7.44681912160755[/C][C]0.553180878392455[/C][/ROW]
[ROW][C]7[/C][C]7.7[/C][C]7.14342307043203[/C][C]0.556576929567973[/C][/ROW]
[ROW][C]8[/C][C]7.2[/C][C]7.12297930594319[/C][C]0.0770206940568081[/C][/ROW]
[ROW][C]9[/C][C]7.5[/C][C]7.83472134983038[/C][C]-0.334721349830381[/C][/ROW]
[ROW][C]10[/C][C]7.3[/C][C]7.88314750699944[/C][C]-0.583147506999444[/C][/ROW]
[ROW][C]11[/C][C]7[/C][C]7.60229397610761[/C][C]-0.602293976107611[/C][/ROW]
[ROW][C]12[/C][C]7[/C][C]7.30796288824033[/C][C]-0.307962888240329[/C][/ROW]
[ROW][C]13[/C][C]7[/C][C]7.43070957570147[/C][C]-0.430709575701474[/C][/ROW]
[ROW][C]14[/C][C]7.2[/C][C]7.58112551557854[/C][C]-0.381125515578539[/C][/ROW]
[ROW][C]15[/C][C]7.3[/C][C]7.7734546524521[/C][C]-0.473454652452101[/C][/ROW]
[ROW][C]16[/C][C]7.1[/C][C]7.75220924888666[/C][C]-0.652209248886658[/C][/ROW]
[ROW][C]17[/C][C]6.8[/C][C]7.63163987096725[/C][C]-0.831639870967246[/C][/ROW]
[ROW][C]18[/C][C]6.4[/C][C]7.39246691858985[/C][C]-0.992466918589853[/C][/ROW]
[ROW][C]19[/C][C]6.1[/C][C]7.13692764666399[/C][C]-1.03692764666399[/C][/ROW]
[ROW][C]20[/C][C]6.5[/C][C]7.11352246996135[/C][C]-0.613522469961348[/C][/ROW]
[ROW][C]21[/C][C]7.7[/C][C]7.83662703201026[/C][C]-0.13662703201026[/C][/ROW]
[ROW][C]22[/C][C]7.9[/C][C]7.89119073835959[/C][C]0.00880926164040725[/C][/ROW]
[ROW][C]23[/C][C]7.5[/C][C]7.60143507709696[/C][C]-0.101435077096961[/C][/ROW]
[ROW][C]24[/C][C]6.9[/C][C]7.32816490871999[/C][C]-0.42816490871999[/C][/ROW]
[ROW][C]25[/C][C]6.6[/C][C]7.46866217573457[/C][C]-0.868662175734568[/C][/ROW]
[ROW][C]26[/C][C]6.9[/C][C]7.5921212122878[/C][C]-0.692121212287797[/C][/ROW]
[ROW][C]27[/C][C]7.7[/C][C]7.82820051751634[/C][C]-0.128200517516339[/C][/ROW]
[ROW][C]28[/C][C]8[/C][C]7.80607832121086[/C][C]0.193921678789142[/C][/ROW]
[ROW][C]29[/C][C]8[/C][C]7.65161821982955[/C][C]0.348381780170449[/C][/ROW]
[ROW][C]30[/C][C]7.7[/C][C]7.44381297507027[/C][C]0.25618702492973[/C][/ROW]
[ROW][C]31[/C][C]7.3[/C][C]7.18443549819056[/C][C]0.115564501809438[/C][/ROW]
[ROW][C]32[/C][C]7.4[/C][C]7.14998989045519[/C][C]0.250010109544807[/C][/ROW]
[ROW][C]33[/C][C]8.1[/C][C]7.84715749175542[/C][C]0.252842508244584[/C][/ROW]
[ROW][C]34[/C][C]8.3[/C][C]7.89850927367951[/C][C]0.401490726320495[/C][/ROW]
[ROW][C]35[/C][C]8.1[/C][C]7.60576535960899[/C][C]0.494234640391012[/C][/ROW]
[ROW][C]36[/C][C]7.9[/C][C]7.3284601552549[/C][C]0.571539844745099[/C][/ROW]
[ROW][C]37[/C][C]7.9[/C][C]7.44040797703006[/C][C]0.459592022969938[/C][/ROW]
[ROW][C]38[/C][C]8.3[/C][C]7.56502115912885[/C][C]0.734978840871147[/C][/ROW]
[ROW][C]39[/C][C]8.6[/C][C]7.80928684555265[/C][C]0.790713154447347[/C][/ROW]
[ROW][C]40[/C][C]8.7[/C][C]7.78912401261522[/C][C]0.910875987384783[/C][/ROW]
[ROW][C]41[/C][C]8.5[/C][C]7.5900280032742[/C][C]0.909971996725805[/C][/ROW]
[ROW][C]42[/C][C]8.3[/C][C]7.39128593245021[/C][C]0.908714067549791[/C][/ROW]
[ROW][C]43[/C][C]8[/C][C]7.12475991067978[/C][C]0.87524008932022[/C][/ROW]
[ROW][C]44[/C][C]8[/C][C]7.08890964518741[/C][C]0.911090354812589[/C][/ROW]
[ROW][C]45[/C][C]8.8[/C][C]7.82630235015307[/C][C]0.973697649846929[/C][/ROW]
[ROW][C]46[/C][C]8.7[/C][C]7.85751473965036[/C][C]0.842485260349639[/C][/ROW]
[ROW][C]47[/C][C]8.5[/C][C]7.60990775796243[/C][C]0.890092242037565[/C][/ROW]
[ROW][C]48[/C][C]8.1[/C][C]7.31261525788135[/C][C]0.78738474211865[/C][/ROW]
[ROW][C]49[/C][C]7.8[/C][C]7.40775192089598[/C][C]0.392248079104023[/C][/ROW]
[ROW][C]50[/C][C]7.6[/C][C]7.55044671654189[/C][C]0.0495532834581125[/C][/ROW]
[ROW][C]51[/C][C]7.4[/C][C]7.81164881783194[/C][C]-0.411648817831939[/C][/ROW]
[ROW][C]52[/C][C]7.1[/C][C]7.76852833008901[/C][C]-0.668528330089007[/C][/ROW]
[ROW][C]53[/C][C]6.9[/C][C]7.60072845344854[/C][C]-0.700728453448542[/C][/ROW]
[ROW][C]54[/C][C]6.7[/C][C]7.42561505228212[/C][C]-0.725615052282124[/C][/ROW]
[ROW][C]55[/C][C]6.6[/C][C]7.11045387403364[/C][C]-0.510453874033642[/C][/ROW]
[ROW][C]56[/C][C]6.5[/C][C]7.12459868845286[/C][C]-0.624598688452855[/C][/ROW]
[ROW][C]57[/C][C]7.1[/C][C]7.85519177625087[/C][C]-0.755191776250871[/C][/ROW]
[ROW][C]58[/C][C]7.2[/C][C]7.8696377413111[/C][C]-0.669637741311096[/C][/ROW]
[ROW][C]59[/C][C]6.9[/C][C]7.58059782922401[/C][C]-0.680597829224005[/C][/ROW]
[ROW][C]60[/C][C]6.7[/C][C]7.32279678990343[/C][C]-0.622796789903429[/C][/ROW]
[/TABLE]
Source: https://freestatistics.org/blog/index.php?pk=159454&T=4

Globally Unique Identifier (entire table): ba.freestatistics.org/blog/index.php?pk=159454&T=4

As an alternative you can also use a QR Code:  

The GUIDs for individual cells are displayed in the table below:

Multiple Linear Regression - Actuals, Interpolation, and Residuals
Time or IndexActualsInterpolationForecastResidualsPrediction Error
17.97.452468350637920.44753164936208
27.97.611285396462920.288714603537076
387.777409166646970.222590833353032
487.784060087198260.21593991280174
57.97.625985452480470.274014547519533
687.446819121607550.553180878392455
77.77.143423070432030.556576929567973
87.27.122979305943190.0770206940568081
97.57.83472134983038-0.334721349830381
107.37.88314750699944-0.583147506999444
1177.60229397610761-0.602293976107611
1277.30796288824033-0.307962888240329
1377.43070957570147-0.430709575701474
147.27.58112551557854-0.381125515578539
157.37.7734546524521-0.473454652452101
167.17.75220924888666-0.652209248886658
176.87.63163987096725-0.831639870967246
186.47.39246691858985-0.992466918589853
196.17.13692764666399-1.03692764666399
206.57.11352246996135-0.613522469961348
217.77.83662703201026-0.13662703201026
227.97.891190738359590.00880926164040725
237.57.60143507709696-0.101435077096961
246.97.32816490871999-0.42816490871999
256.67.46866217573457-0.868662175734568
266.97.5921212122878-0.692121212287797
277.77.82820051751634-0.128200517516339
2887.806078321210860.193921678789142
2987.651618219829550.348381780170449
307.77.443812975070270.25618702492973
317.37.184435498190560.115564501809438
327.47.149989890455190.250010109544807
338.17.847157491755420.252842508244584
348.37.898509273679510.401490726320495
358.17.605765359608990.494234640391012
367.97.32846015525490.571539844745099
377.97.440407977030060.459592022969938
388.37.565021159128850.734978840871147
398.67.809286845552650.790713154447347
408.77.789124012615220.910875987384783
418.57.59002800327420.909971996725805
428.37.391285932450210.908714067549791
4387.124759910679780.87524008932022
4487.088909645187410.911090354812589
458.87.826302350153070.973697649846929
468.77.857514739650360.842485260349639
478.57.609907757962430.890092242037565
488.17.312615257881350.78738474211865
497.87.407751920895980.392248079104023
507.67.550446716541890.0495532834581125
517.47.81164881783194-0.411648817831939
527.17.76852833008901-0.668528330089007
536.97.60072845344854-0.700728453448542
546.77.42561505228212-0.725615052282124
556.67.11045387403364-0.510453874033642
566.57.12459868845286-0.624598688452855
577.17.85519177625087-0.755191776250871
587.27.8696377413111-0.669637741311096
596.97.58059782922401-0.680597829224005
606.77.32279678990343-0.622796789903429


Goldfeld-Quandt test for Heteroskedasticity
p-valuesAlternative Hypothesis
breakpoint indexgreater2-sidedless
160.05849387959755470.1169877591951090.941506120402445
170.2276656842225960.4553313684451920.772334315777404
180.1388919337432210.2777838674864420.861108066256779
190.3043216876895210.6086433753790430.695678312310479
200.2294900124706420.4589800249412840.770509987529358
210.1471452272555140.2942904545110290.852854772744486
220.09400654607265560.1880130921453110.905993453927344
230.06524423833978320.1304884766795660.934755761660217
240.0544513937146020.1089027874292040.945548606285398
250.1646639994821230.3293279989642460.835336000517877
260.145655447761130.2913108955222610.85434455223887
270.1333413438976530.2666826877953070.866658656102347
280.08609556786011490.172191135720230.913904432139885
290.05772668017582860.1154533603516570.942273319824171
300.03502150556819020.07004301113638040.96497849443181
310.02063047824550240.04126095649100480.979369521754498
320.01163536059191410.02327072118382820.988364639408086
330.0064650413738970.0129300827477940.993534958626103
340.004565639869464950.00913127973892990.995434360130535
350.003775665647690050.007551331295380110.99622433435231
360.003159534102185820.006319068204371650.996840465897814
370.002888225252377360.005776450504754730.997111774747623
380.005486298363191690.01097259672638340.994513701636808
390.004938938617897790.009877877235795580.995061061382102
400.01381975352467220.02763950704934430.986180246475328
410.02479383713861970.04958767427723940.97520616286138
420.02243873468257560.04487746936515120.977561265317424
430.04171944435400410.08343888870800830.958280555645996
440.02762958852225490.05525917704450980.972370411477745

\begin{tabular}{lllllllll}
\hline
Goldfeld-Quandt test for Heteroskedasticity \tabularnewline
p-values & Alternative Hypothesis \tabularnewline
breakpoint index & greater & 2-sided & less \tabularnewline
16 & 0.0584938795975547 & 0.116987759195109 & 0.941506120402445 \tabularnewline
17 & 0.227665684222596 & 0.455331368445192 & 0.772334315777404 \tabularnewline
18 & 0.138891933743221 & 0.277783867486442 & 0.861108066256779 \tabularnewline
19 & 0.304321687689521 & 0.608643375379043 & 0.695678312310479 \tabularnewline
20 & 0.229490012470642 & 0.458980024941284 & 0.770509987529358 \tabularnewline
21 & 0.147145227255514 & 0.294290454511029 & 0.852854772744486 \tabularnewline
22 & 0.0940065460726556 & 0.188013092145311 & 0.905993453927344 \tabularnewline
23 & 0.0652442383397832 & 0.130488476679566 & 0.934755761660217 \tabularnewline
24 & 0.054451393714602 & 0.108902787429204 & 0.945548606285398 \tabularnewline
25 & 0.164663999482123 & 0.329327998964246 & 0.835336000517877 \tabularnewline
26 & 0.14565544776113 & 0.291310895522261 & 0.85434455223887 \tabularnewline
27 & 0.133341343897653 & 0.266682687795307 & 0.866658656102347 \tabularnewline
28 & 0.0860955678601149 & 0.17219113572023 & 0.913904432139885 \tabularnewline
29 & 0.0577266801758286 & 0.115453360351657 & 0.942273319824171 \tabularnewline
30 & 0.0350215055681902 & 0.0700430111363804 & 0.96497849443181 \tabularnewline
31 & 0.0206304782455024 & 0.0412609564910048 & 0.979369521754498 \tabularnewline
32 & 0.0116353605919141 & 0.0232707211838282 & 0.988364639408086 \tabularnewline
33 & 0.006465041373897 & 0.012930082747794 & 0.993534958626103 \tabularnewline
34 & 0.00456563986946495 & 0.0091312797389299 & 0.995434360130535 \tabularnewline
35 & 0.00377566564769005 & 0.00755133129538011 & 0.99622433435231 \tabularnewline
36 & 0.00315953410218582 & 0.00631906820437165 & 0.996840465897814 \tabularnewline
37 & 0.00288822525237736 & 0.00577645050475473 & 0.997111774747623 \tabularnewline
38 & 0.00548629836319169 & 0.0109725967263834 & 0.994513701636808 \tabularnewline
39 & 0.00493893861789779 & 0.00987787723579558 & 0.995061061382102 \tabularnewline
40 & 0.0138197535246722 & 0.0276395070493443 & 0.986180246475328 \tabularnewline
41 & 0.0247938371386197 & 0.0495876742772394 & 0.97520616286138 \tabularnewline
42 & 0.0224387346825756 & 0.0448774693651512 & 0.977561265317424 \tabularnewline
43 & 0.0417194443540041 & 0.0834388887080083 & 0.958280555645996 \tabularnewline
44 & 0.0276295885222549 & 0.0552591770445098 & 0.972370411477745 \tabularnewline
\hline
\end{tabular}
%Source: https://freestatistics.org/blog/index.php?pk=159454&T=5

[TABLE]
[ROW][C]Goldfeld-Quandt test for Heteroskedasticity[/C][/ROW]
[ROW][C]p-values[/C][C]Alternative Hypothesis[/C][/ROW]
[ROW][C]breakpoint index[/C][C]greater[/C][C]2-sided[/C][C]less[/C][/ROW]
[ROW][C]16[/C][C]0.0584938795975547[/C][C]0.116987759195109[/C][C]0.941506120402445[/C][/ROW]
[ROW][C]17[/C][C]0.227665684222596[/C][C]0.455331368445192[/C][C]0.772334315777404[/C][/ROW]
[ROW][C]18[/C][C]0.138891933743221[/C][C]0.277783867486442[/C][C]0.861108066256779[/C][/ROW]
[ROW][C]19[/C][C]0.304321687689521[/C][C]0.608643375379043[/C][C]0.695678312310479[/C][/ROW]
[ROW][C]20[/C][C]0.229490012470642[/C][C]0.458980024941284[/C][C]0.770509987529358[/C][/ROW]
[ROW][C]21[/C][C]0.147145227255514[/C][C]0.294290454511029[/C][C]0.852854772744486[/C][/ROW]
[ROW][C]22[/C][C]0.0940065460726556[/C][C]0.188013092145311[/C][C]0.905993453927344[/C][/ROW]
[ROW][C]23[/C][C]0.0652442383397832[/C][C]0.130488476679566[/C][C]0.934755761660217[/C][/ROW]
[ROW][C]24[/C][C]0.054451393714602[/C][C]0.108902787429204[/C][C]0.945548606285398[/C][/ROW]
[ROW][C]25[/C][C]0.164663999482123[/C][C]0.329327998964246[/C][C]0.835336000517877[/C][/ROW]
[ROW][C]26[/C][C]0.14565544776113[/C][C]0.291310895522261[/C][C]0.85434455223887[/C][/ROW]
[ROW][C]27[/C][C]0.133341343897653[/C][C]0.266682687795307[/C][C]0.866658656102347[/C][/ROW]
[ROW][C]28[/C][C]0.0860955678601149[/C][C]0.17219113572023[/C][C]0.913904432139885[/C][/ROW]
[ROW][C]29[/C][C]0.0577266801758286[/C][C]0.115453360351657[/C][C]0.942273319824171[/C][/ROW]
[ROW][C]30[/C][C]0.0350215055681902[/C][C]0.0700430111363804[/C][C]0.96497849443181[/C][/ROW]
[ROW][C]31[/C][C]0.0206304782455024[/C][C]0.0412609564910048[/C][C]0.979369521754498[/C][/ROW]
[ROW][C]32[/C][C]0.0116353605919141[/C][C]0.0232707211838282[/C][C]0.988364639408086[/C][/ROW]
[ROW][C]33[/C][C]0.006465041373897[/C][C]0.012930082747794[/C][C]0.993534958626103[/C][/ROW]
[ROW][C]34[/C][C]0.00456563986946495[/C][C]0.0091312797389299[/C][C]0.995434360130535[/C][/ROW]
[ROW][C]35[/C][C]0.00377566564769005[/C][C]0.00755133129538011[/C][C]0.99622433435231[/C][/ROW]
[ROW][C]36[/C][C]0.00315953410218582[/C][C]0.00631906820437165[/C][C]0.996840465897814[/C][/ROW]
[ROW][C]37[/C][C]0.00288822525237736[/C][C]0.00577645050475473[/C][C]0.997111774747623[/C][/ROW]
[ROW][C]38[/C][C]0.00548629836319169[/C][C]0.0109725967263834[/C][C]0.994513701636808[/C][/ROW]
[ROW][C]39[/C][C]0.00493893861789779[/C][C]0.00987787723579558[/C][C]0.995061061382102[/C][/ROW]
[ROW][C]40[/C][C]0.0138197535246722[/C][C]0.0276395070493443[/C][C]0.986180246475328[/C][/ROW]
[ROW][C]41[/C][C]0.0247938371386197[/C][C]0.0495876742772394[/C][C]0.97520616286138[/C][/ROW]
[ROW][C]42[/C][C]0.0224387346825756[/C][C]0.0448774693651512[/C][C]0.977561265317424[/C][/ROW]
[ROW][C]43[/C][C]0.0417194443540041[/C][C]0.0834388887080083[/C][C]0.958280555645996[/C][/ROW]
[ROW][C]44[/C][C]0.0276295885222549[/C][C]0.0552591770445098[/C][C]0.972370411477745[/C][/ROW]
[/TABLE]
Source: https://freestatistics.org/blog/index.php?pk=159454&T=5

Globally Unique Identifier (entire table): ba.freestatistics.org/blog/index.php?pk=159454&T=5

As an alternative you can also use a QR Code:  

The GUIDs for individual cells are displayed in the table below:

Goldfeld-Quandt test for Heteroskedasticity
p-valuesAlternative Hypothesis
breakpoint indexgreater2-sidedless
160.05849387959755470.1169877591951090.941506120402445
170.2276656842225960.4553313684451920.772334315777404
180.1388919337432210.2777838674864420.861108066256779
190.3043216876895210.6086433753790430.695678312310479
200.2294900124706420.4589800249412840.770509987529358
210.1471452272555140.2942904545110290.852854772744486
220.09400654607265560.1880130921453110.905993453927344
230.06524423833978320.1304884766795660.934755761660217
240.0544513937146020.1089027874292040.945548606285398
250.1646639994821230.3293279989642460.835336000517877
260.145655447761130.2913108955222610.85434455223887
270.1333413438976530.2666826877953070.866658656102347
280.08609556786011490.172191135720230.913904432139885
290.05772668017582860.1154533603516570.942273319824171
300.03502150556819020.07004301113638040.96497849443181
310.02063047824550240.04126095649100480.979369521754498
320.01163536059191410.02327072118382820.988364639408086
330.0064650413738970.0129300827477940.993534958626103
340.004565639869464950.00913127973892990.995434360130535
350.003775665647690050.007551331295380110.99622433435231
360.003159534102185820.006319068204371650.996840465897814
370.002888225252377360.005776450504754730.997111774747623
380.005486298363191690.01097259672638340.994513701636808
390.004938938617897790.009877877235795580.995061061382102
400.01381975352467220.02763950704934430.986180246475328
410.02479383713861970.04958767427723940.97520616286138
420.02243873468257560.04487746936515120.977561265317424
430.04171944435400410.08343888870800830.958280555645996
440.02762958852225490.05525917704450980.972370411477745


Meta Analysis of Goldfeld-Quandt test for Heteroskedasticity
Description# significant tests% significant testsOK/NOK
1% type I error level50.172413793103448NOK
5% type I error level120.413793103448276NOK
10% type I error level150.517241379310345NOK

\begin{tabular}{lllllllll}
\hline
Meta Analysis of Goldfeld-Quandt test for Heteroskedasticity \tabularnewline
Description & # significant tests & % significant tests & OK/NOK \tabularnewline
1% type I error level & 5 & 0.172413793103448 & NOK \tabularnewline
5% type I error level & 12 & 0.413793103448276 & NOK \tabularnewline
10% type I error level & 15 & 0.517241379310345 & NOK \tabularnewline
\hline
\end{tabular}
%Source: https://freestatistics.org/blog/index.php?pk=159454&T=6

[TABLE]
[ROW][C]Meta Analysis of Goldfeld-Quandt test for Heteroskedasticity[/C][/ROW]
[ROW][C]Description[/C][C]# significant tests[/C][C]% significant tests[/C][C]OK/NOK[/C][/ROW]
[ROW][C]1% type I error level[/C][C]5[/C][C]0.172413793103448[/C][C]NOK[/C][/ROW]
[ROW][C]5% type I error level[/C][C]12[/C][C]0.413793103448276[/C][C]NOK[/C][/ROW]
[ROW][C]10% type I error level[/C][C]15[/C][C]0.517241379310345[/C][C]NOK[/C][/ROW]
[/TABLE]
Source: https://freestatistics.org/blog/index.php?pk=159454&T=6

Globally Unique Identifier (entire table): ba.freestatistics.org/blog/index.php?pk=159454&T=6

As an alternative you can also use a QR Code:  

The GUIDs for individual cells are displayed in the table below:

Meta Analysis of Goldfeld-Quandt test for Heteroskedasticity
Description# significant tests% significant testsOK/NOK
1% type I error level50.172413793103448NOK
5% type I error level120.413793103448276NOK
10% type I error level150.517241379310345NOK


Parameters (Session):
par1 = 1 ; par2 = Do not include Seasonal Dummies ; par3 = No Linear Trend ;
Parameters (R input):
par1 = 1 ; par2 = Include Monthly Dummies ; par3 = No Linear Trend ;
R code (references can be found in the software module):
library(lattice)
library(lmtest)
n25 <- 25 #minimum number of obs. for Goldfeld-Quandt test
par1 <- as.numeric(par1)
x <- t(y)
k <- length(x[1,])
n <- length(x[,1])
x1 <- cbind(x[,par1], x[,1:k!=par1])
mycolnames <- c(colnames(x)[par1], colnames(x)[1:k!=par1])
colnames(x1) <- mycolnames #colnames(x)[par1]
x <- x1
if (par3 == 'First Differences'){
x2 <- array(0, dim=c(n-1,k), dimnames=list(1:(n-1), paste('(1-B)',colnames(x),sep='')))
for (i in 1:n-1) {
for (j in 1:k) {
x2[i,j] <- x[i+1,j] - x[i,j]
}
}
x <- x2
}
if (par2 == 'Include Monthly Dummies'){
x2 <- array(0, dim=c(n,11), dimnames=list(1:n, paste('M', seq(1:11), sep ='')))
for (i in 1:11){
x2[seq(i,n,12),i] <- 1
}
x <- cbind(x, x2)
}
if (par2 == 'Include Quarterly Dummies'){
x2 <- array(0, dim=c(n,3), dimnames=list(1:n, paste('Q', seq(1:3), sep ='')))
for (i in 1:3){
x2[seq(i,n,4),i] <- 1
}
x <- cbind(x, x2)
}
k <- length(x[1,])
if (par3 == 'Linear Trend'){
x <- cbind(x, c(1:n))
colnames(x)[k+1] <- 't'
}
x
k <- length(x[1,])
df <- as.data.frame(x)
(mylm <- lm(df))
(mysum <- summary(mylm))
if (n > n25) {
kp3 <- k + 3
nmkm3 <- n - k - 3
gqarr <- array(NA, dim=c(nmkm3-kp3+1,3))
numgqtests <- 0
numsignificant1 <- 0
numsignificant5 <- 0
numsignificant10 <- 0
for (mypoint in kp3:nmkm3) {
j <- 0
numgqtests <- numgqtests + 1
for (myalt in c('greater', 'two.sided', 'less')) {
j <- j + 1
gqarr[mypoint-kp3+1,j] <- gqtest(mylm, point=mypoint, alternative=myalt)$p.value
}
if (gqarr[mypoint-kp3+1,2] < 0.01) numsignificant1 <- numsignificant1 + 1
if (gqarr[mypoint-kp3+1,2] < 0.05) numsignificant5 <- numsignificant5 + 1
if (gqarr[mypoint-kp3+1,2] < 0.10) numsignificant10 <- numsignificant10 + 1
}
gqarr
}
bitmap(file='test0.png')
plot(x[,1], type='l', main='Actuals and Interpolation', ylab='value of Actuals and Interpolation (dots)', xlab='time or index')
points(x[,1]-mysum$resid)
grid()
dev.off()
bitmap(file='test1.png')
plot(mysum$resid, type='b', pch=19, main='Residuals', ylab='value of Residuals', xlab='time or index')
grid()
dev.off()
bitmap(file='test2.png')
hist(mysum$resid, main='Residual Histogram', xlab='values of Residuals')
grid()
dev.off()
bitmap(file='test3.png')
densityplot(~mysum$resid,col='black',main='Residual Density Plot', xlab='values of Residuals')
dev.off()
bitmap(file='test4.png')
qqnorm(mysum$resid, main='Residual Normal Q-Q Plot')
qqline(mysum$resid)
grid()
dev.off()
(myerror <- as.ts(mysum$resid))
bitmap(file='test5.png')
dum <- cbind(lag(myerror,k=1),myerror)
dum
dum1 <- dum[2:length(myerror),]
dum1
z <- as.data.frame(dum1)
z
plot(z,main=paste('Residual Lag plot, lowess, and regression line'), ylab='values of Residuals', xlab='lagged values of Residuals')
lines(lowess(z))
abline(lm(z))
grid()
dev.off()
bitmap(file='test6.png')
acf(mysum$resid, lag.max=length(mysum$resid)/2, main='Residual Autocorrelation Function')
grid()
dev.off()
bitmap(file='test7.png')
pacf(mysum$resid, lag.max=length(mysum$resid)/2, main='Residual Partial Autocorrelation Function')
grid()
dev.off()
bitmap(file='test8.png')
opar <- par(mfrow = c(2,2), oma = c(0, 0, 1.1, 0))
plot(mylm, las = 1, sub='Residual Diagnostics')
par(opar)
dev.off()
if (n > n25) {
bitmap(file='test9.png')
plot(kp3:nmkm3,gqarr[,2], main='Goldfeld-Quandt test',ylab='2-sided p-value',xlab='breakpoint')
grid()
dev.off()
}
load(file='createtable')
a<-table.start()
a<-table.row.start(a)
a<-table.element(a, 'Multiple Linear Regression - Estimated Regression Equation', 1, TRUE)
a<-table.row.end(a)
myeq <- colnames(x)[1]
myeq <- paste(myeq, '[t] = ', sep='')
for (i in 1:k){
if (mysum$coefficients[i,1] > 0) myeq <- paste(myeq, '+', '')
myeq <- paste(myeq, mysum$coefficients[i,1], sep=' ')
if (rownames(mysum$coefficients)[i] != '(Intercept)') {
myeq <- paste(myeq, rownames(mysum$coefficients)[i], sep='')
if (rownames(mysum$coefficients)[i] != 't') myeq <- paste(myeq, '[t]', sep='')
}
}
myeq <- paste(myeq, ' + e[t]')
a<-table.row.start(a)
a<-table.element(a, myeq)
a<-table.row.end(a)
a<-table.end(a)
table.save(a,file='mytable1.tab')
a<-table.start()
a<-table.row.start(a)
a<-table.element(a,hyperlink('ols1.htm','Multiple Linear Regression - Ordinary Least Squares',''), 6, TRUE)
a<-table.row.end(a)
a<-table.row.start(a)
a<-table.element(a,'Variable',header=TRUE)
a<-table.element(a,'Parameter',header=TRUE)
a<-table.element(a,'S.D.',header=TRUE)
a<-table.element(a,'T-STAT
H0: parameter = 0',header=TRUE)
a<-table.element(a,'2-tail p-value',header=TRUE)
a<-table.element(a,'1-tail p-value',header=TRUE)
a<-table.row.end(a)
for (i in 1:k){
a<-table.row.start(a)
a<-table.element(a,rownames(mysum$coefficients)[i],header=TRUE)
a<-table.element(a,mysum$coefficients[i,1])
a<-table.element(a, round(mysum$coefficients[i,2],6))
a<-table.element(a, round(mysum$coefficients[i,3],4))
a<-table.element(a, round(mysum$coefficients[i,4],6))
a<-table.element(a, round(mysum$coefficients[i,4]/2,6))
a<-table.row.end(a)
}
a<-table.end(a)
table.save(a,file='mytable2.tab')
a<-table.start()
a<-table.row.start(a)
a<-table.element(a, 'Multiple Linear Regression - Regression Statistics', 2, TRUE)
a<-table.row.end(a)
a<-table.row.start(a)
a<-table.element(a, 'Multiple R',1,TRUE)
a<-table.element(a, sqrt(mysum$r.squared))
a<-table.row.end(a)
a<-table.row.start(a)
a<-table.element(a, 'R-squared',1,TRUE)
a<-table.element(a, mysum$r.squared)
a<-table.row.end(a)
a<-table.row.start(a)
a<-table.element(a, 'Adjusted R-squared',1,TRUE)
a<-table.element(a, mysum$adj.r.squared)
a<-table.row.end(a)
a<-table.row.start(a)
a<-table.element(a, 'F-TEST (value)',1,TRUE)
a<-table.element(a, mysum$fstatistic[1])
a<-table.row.end(a)
a<-table.row.start(a)
a<-table.element(a, 'F-TEST (DF numerator)',1,TRUE)
a<-table.element(a, mysum$fstatistic[2])
a<-table.row.end(a)
a<-table.row.start(a)
a<-table.element(a, 'F-TEST (DF denominator)',1,TRUE)
a<-table.element(a, mysum$fstatistic[3])
a<-table.row.end(a)
a<-table.row.start(a)
a<-table.element(a, 'p-value',1,TRUE)
a<-table.element(a, 1-pf(mysum$fstatistic[1],mysum$fstatistic[2],mysum$fstatistic[3]))
a<-table.row.end(a)
a<-table.row.start(a)
a<-table.element(a, 'Multiple Linear Regression - Residual Statistics', 2, TRUE)
a<-table.row.end(a)
a<-table.row.start(a)
a<-table.element(a, 'Residual Standard Deviation',1,TRUE)
a<-table.element(a, mysum$sigma)
a<-table.row.end(a)
a<-table.row.start(a)
a<-table.element(a, 'Sum Squared Residuals',1,TRUE)
a<-table.element(a, sum(myerror*myerror))
a<-table.row.end(a)
a<-table.end(a)
table.save(a,file='mytable3.tab')
a<-table.start()
a<-table.row.start(a)
a<-table.element(a, 'Multiple Linear Regression - Actuals, Interpolation, and Residuals', 4, TRUE)
a<-table.row.end(a)
a<-table.row.start(a)
a<-table.element(a, 'Time or Index', 1, TRUE)
a<-table.element(a, 'Actuals', 1, TRUE)
a<-table.element(a, 'Interpolation
Forecast', 1, TRUE)
a<-table.element(a, 'Residuals
Prediction Error', 1, TRUE)
a<-table.row.end(a)
for (i in 1:n) {
a<-table.row.start(a)
a<-table.element(a,i, 1, TRUE)
a<-table.element(a,x[i])
a<-table.element(a,x[i]-mysum$resid[i])
a<-table.element(a,mysum$resid[i])
a<-table.row.end(a)
}
a<-table.end(a)
table.save(a,file='mytable4.tab')
if (n > n25) {
a<-table.start()
a<-table.row.start(a)
a<-table.element(a,'Goldfeld-Quandt test for Heteroskedasticity',4,TRUE)
a<-table.row.end(a)
a<-table.row.start(a)
a<-table.element(a,'p-values',header=TRUE)
a<-table.element(a,'Alternative Hypothesis',3,header=TRUE)
a<-table.row.end(a)
a<-table.row.start(a)
a<-table.element(a,'breakpoint index',header=TRUE)
a<-table.element(a,'greater',header=TRUE)
a<-table.element(a,'2-sided',header=TRUE)
a<-table.element(a,'less',header=TRUE)
a<-table.row.end(a)
for (mypoint in kp3:nmkm3) {
a<-table.row.start(a)
a<-table.element(a,mypoint,header=TRUE)
a<-table.element(a,gqarr[mypoint-kp3+1,1])
a<-table.element(a,gqarr[mypoint-kp3+1,2])
a<-table.element(a,gqarr[mypoint-kp3+1,3])
a<-table.row.end(a)
}
a<-table.end(a)
table.save(a,file='mytable5.tab')
a<-table.start()
a<-table.row.start(a)
a<-table.element(a,'Meta Analysis of Goldfeld-Quandt test for Heteroskedasticity',4,TRUE)
a<-table.row.end(a)
a<-table.row.start(a)
a<-table.element(a,'Description',header=TRUE)
a<-table.element(a,'# significant tests',header=TRUE)
a<-table.element(a,'% significant tests',header=TRUE)
a<-table.element(a,'OK/NOK',header=TRUE)
a<-table.row.end(a)
a<-table.row.start(a)
a<-table.element(a,'1% type I error level',header=TRUE)
a<-table.element(a,numsignificant1)
a<-table.element(a,numsignificant1/numgqtests)
if (numsignificant1/numgqtests < 0.01) dum <- 'OK' else dum <- 'NOK'
a<-table.element(a,dum)
a<-table.row.end(a)
a<-table.row.start(a)
a<-table.element(a,'5% type I error level',header=TRUE)
a<-table.element(a,numsignificant5)
a<-table.element(a,numsignificant5/numgqtests)
if (numsignificant5/numgqtests < 0.05) dum <- 'OK' else dum <- 'NOK'
a<-table.element(a,dum)
a<-table.row.end(a)
a<-table.row.start(a)
a<-table.element(a,'10% type I error level',header=TRUE)
a<-table.element(a,numsignificant10)
a<-table.element(a,numsignificant10/numgqtests)
if (numsignificant10/numgqtests < 0.1) dum <- 'OK' else dum <- 'NOK'
a<-table.element(a,dum)
a<-table.row.end(a)
a<-table.end(a)
table.save(a,file='mytable6.tab')
}