Free Statistics

of Irreproducible Research!

Author's title

Author*The author of this computation has been verified*
R Software Modulerwasp_multipleregression.wasp
Title produced by softwareMultiple Regression
Date of computationThu, 22 Dec 2011 08:27:56 -0500
Cite this page as followsStatistical Computations at FreeStatistics.org, Office for Research Development and Education, URL https://freestatistics.org/blog/index.php?v=date/2011/Dec/22/t1324560882v16702w1uj61zf5.htm/, Retrieved Fri, 03 May 2024 05:48:59 +0000
Statistical Computations at FreeStatistics.org, Office for Research Development and Education, URL https://freestatistics.org/blog/index.php?pk=159440, Retrieved Fri, 03 May 2024 05:48:59 +0000
QR Codes:

Original text written by user:
IsPrivate?No (this computation is public)
User-defined keywords
Estimated Impact84
Family? (F = Feedback message, R = changed R code, M = changed R Module, P = changed Parameters, D = changed Data)
-       [Multiple Regression] [] [2011-12-22 13:27:56] [75a32e1bc492240bc1028714aca23077] [Current]
Feedback Forum

Post a new message
Dataseries X:
1.0622	2.1	8.93	2.60	5.8
1.0773	2.4	8.96	2.98	5.9
1.0807	2.5	8.99	3.02	5.9
1.0848	2.1	8.98	2.22	6
1.1582	1.8	9	2.06	6.1
1.1663	1.9	9.03	2.11	6.3
1.1372	1.9	9.02	2.11	6.2
1.1139	2.1	9	2.16	6.1
1.1222	2.2	9.03	2.32	6.1
1.1692	2	9.03	2.04	6
1.1702	2.2	9.03	1.77	5.8
1.2286	2	9.07	1.88	5.7
1.2613	1.9	9.15	1.93	5.7
1.2646	1.6	9.1	1.69	5.6
1.2262	1.7	9.15	1.74	5.8
1.1985	2	9.15	2.29	5.6
1.2007	2.5	9.22	3.05	5.6
1.2138	2.4	9.22	3.27	5.6
1.2266	2.3	9.24	2.99	5.5
1.2176	2.3	9.26	2.65	5.4
1.2218	2.1	9.3	2.54	5.4
1.249	2.4	9.27	3.19	5.5
1.2991	2.2	9.32	3.52	5.4
1.3408	2.4	9.33	3.26	5.4
1.3119	1.9	9.32	2.97	5.3
1.3014	2.1	9.34	3.01	5.4
1.3201	2.1	9.32	3.15	5.2
1.2938	2.1	9.32	3.51	5.2
1.2694	2	9.24	2.80	5.1
1.2165	2.1	9.24	2.53	5
1.2037	2.2	9.15	3.17	5
1.2292	2.2	9.17	3.64	4.9
1.2256	2.6	9.14	4.69	5
1.2015	2.5	9.11	4.35	5
1.1786	2.3	9.04	3.46	5
1.1856	2.2	8.96	3.42	4.9
1.2103	2.4	8.86	3.99	4.7
1.1938	2.3	8.85	3.60	4.8
1.202	2.2	8.75	3.36	4.7
1.2271	2.5	8.65	3.55	4.7
1.277	2.5	8.61	4.17	4.6
1.265	2.5	8.46	4.32	4.6
1.2684	2.4	8.38	4.15	4.7
1.2811	2.3	8.33	3.82	4.7
1.2727	1.7	8.27	2.06	4.5
1.2611	1.6	8.21	1.31	4.4
1.2881	1.9	8.18	1.97	4.5
1.3213	1.9	8.04	2.54	4.4
1.2999	1.8	7.97	2.08	4.6
1.3074	1.8	7.86	2.42	4.5
1.3242	1.9	7.75	2.78	4.4
1.3516	1.9	7.65	2.57	4.5
1.3511	1.9	7.62	2.69	4.4
1.3419	1.9	7.55	2.69	4.6
1.3716	1.8	7.6	2.36	4.7
1.3622	1.7	7.54	1.97	4.6
1.3896	2.1	7.48	2.76	4.7
1.4227	2.6	7.44	3.54	4.7
1.4684	3.1	7.41	4.31	4.7
1.457	3.1	7.45	4.08	5


Summary of computational transaction
Raw Inputview raw input (R code)
Raw Outputview raw output of R engine
Computing time4 seconds
R Server'AstonUniversity' @ aston.wessa.net

\begin{tabular}{lllllllll}
\hline
Summary of computational transaction \tabularnewline
Raw Input & view raw input (R code)  \tabularnewline
Raw Output & view raw output of R engine  \tabularnewline
Computing time & 4 seconds \tabularnewline
R Server & 'AstonUniversity' @ aston.wessa.net \tabularnewline
\hline
\end{tabular}
%Source: https://freestatistics.org/blog/index.php?pk=159440&T=0

[TABLE]
[ROW][C]Summary of computational transaction[/C][/ROW]
[ROW][C]Raw Input[/C][C]view raw input (R code) [/C][/ROW]
[ROW][C]Raw Output[/C][C]view raw output of R engine [/C][/ROW]
[ROW][C]Computing time[/C][C]4 seconds[/C][/ROW]
[ROW][C]R Server[/C][C]'AstonUniversity' @ aston.wessa.net[/C][/ROW]
[/TABLE]
Source: https://freestatistics.org/blog/index.php?pk=159440&T=0

Globally Unique Identifier (entire table): ba.freestatistics.org/blog/index.php?pk=159440&T=0

As an alternative you can also use a QR Code:  

The GUIDs for individual cells are displayed in the table below:

Summary of computational transaction
Raw Inputview raw input (R code)
Raw Outputview raw output of R engine
Computing time4 seconds
R Server'AstonUniversity' @ aston.wessa.net


Multiple Linear Regression - Estimated Regression Equation
Dollar/Euro[t] = -0.291886267292158 -0.00446981564425716`Infl-Eu`[t] + 0.0497838811131522`Werkl-Eu`[t] -0.0118898354240754`Infl-VS`[t] + 0.16022758300618`Werkl-VS`[t] + 0.0106104700270044t + e[t]

\begin{tabular}{lllllllll}
\hline
Multiple Linear Regression - Estimated Regression Equation \tabularnewline
Dollar/Euro[t] =  -0.291886267292158 -0.00446981564425716`Infl-Eu`[t] +  0.0497838811131522`Werkl-Eu`[t] -0.0118898354240754`Infl-VS`[t] +  0.16022758300618`Werkl-VS`[t] +  0.0106104700270044t  + e[t] \tabularnewline
\hline
\end{tabular}
%Source: https://freestatistics.org/blog/index.php?pk=159440&T=1

[TABLE]
[ROW][C]Multiple Linear Regression - Estimated Regression Equation[/C][/ROW]
[ROW][C]Dollar/Euro[t] =  -0.291886267292158 -0.00446981564425716`Infl-Eu`[t] +  0.0497838811131522`Werkl-Eu`[t] -0.0118898354240754`Infl-VS`[t] +  0.16022758300618`Werkl-VS`[t] +  0.0106104700270044t  + e[t][/C][/ROW]
[/TABLE]
Source: https://freestatistics.org/blog/index.php?pk=159440&T=1

Globally Unique Identifier (entire table): ba.freestatistics.org/blog/index.php?pk=159440&T=1

As an alternative you can also use a QR Code:  

The GUIDs for individual cells are displayed in the table below:

Multiple Linear Regression - Estimated Regression Equation
Dollar/Euro[t] = -0.291886267292158 -0.00446981564425716`Infl-Eu`[t] + 0.0497838811131522`Werkl-Eu`[t] -0.0118898354240754`Infl-VS`[t] + 0.16022758300618`Werkl-VS`[t] + 0.0106104700270044t + e[t]


Multiple Linear Regression - Ordinary Least Squares
VariableParameterS.D.T-STATH0: parameter = 02-tail p-value1-tail p-value
(Intercept)-0.2918862672921580.329991-0.88450.3803330.190166
`Infl-Eu`-0.004469815644257160.039383-0.11350.9100580.455029
`Werkl-Eu`0.04978388111315220.0207672.39730.0200070.010003
`Infl-VS`-0.01188983542407540.017536-0.6780.5006630.250332
`Werkl-VS`0.160227583006180.0357574.48113.9e-051.9e-05
t0.01061047002700440.0014557.293400

\begin{tabular}{lllllllll}
\hline
Multiple Linear Regression - Ordinary Least Squares \tabularnewline
Variable & Parameter & S.D. & T-STATH0: parameter = 0 & 2-tail p-value & 1-tail p-value \tabularnewline
(Intercept) & -0.291886267292158 & 0.329991 & -0.8845 & 0.380333 & 0.190166 \tabularnewline
`Infl-Eu` & -0.00446981564425716 & 0.039383 & -0.1135 & 0.910058 & 0.455029 \tabularnewline
`Werkl-Eu` & 0.0497838811131522 & 0.020767 & 2.3973 & 0.020007 & 0.010003 \tabularnewline
`Infl-VS` & -0.0118898354240754 & 0.017536 & -0.678 & 0.500663 & 0.250332 \tabularnewline
`Werkl-VS` & 0.16022758300618 & 0.035757 & 4.4811 & 3.9e-05 & 1.9e-05 \tabularnewline
t & 0.0106104700270044 & 0.001455 & 7.2934 & 0 & 0 \tabularnewline
\hline
\end{tabular}
%Source: https://freestatistics.org/blog/index.php?pk=159440&T=2

[TABLE]
[ROW][C]Multiple Linear Regression - Ordinary Least Squares[/C][/ROW]
[ROW][C]Variable[/C][C]Parameter[/C][C]S.D.[/C][C]T-STATH0: parameter = 0[/C][C]2-tail p-value[/C][C]1-tail p-value[/C][/ROW]
[ROW][C](Intercept)[/C][C]-0.291886267292158[/C][C]0.329991[/C][C]-0.8845[/C][C]0.380333[/C][C]0.190166[/C][/ROW]
[ROW][C]`Infl-Eu`[/C][C]-0.00446981564425716[/C][C]0.039383[/C][C]-0.1135[/C][C]0.910058[/C][C]0.455029[/C][/ROW]
[ROW][C]`Werkl-Eu`[/C][C]0.0497838811131522[/C][C]0.020767[/C][C]2.3973[/C][C]0.020007[/C][C]0.010003[/C][/ROW]
[ROW][C]`Infl-VS`[/C][C]-0.0118898354240754[/C][C]0.017536[/C][C]-0.678[/C][C]0.500663[/C][C]0.250332[/C][/ROW]
[ROW][C]`Werkl-VS`[/C][C]0.16022758300618[/C][C]0.035757[/C][C]4.4811[/C][C]3.9e-05[/C][C]1.9e-05[/C][/ROW]
[ROW][C]t[/C][C]0.0106104700270044[/C][C]0.001455[/C][C]7.2934[/C][C]0[/C][C]0[/C][/ROW]
[/TABLE]
Source: https://freestatistics.org/blog/index.php?pk=159440&T=2

Globally Unique Identifier (entire table): ba.freestatistics.org/blog/index.php?pk=159440&T=2

As an alternative you can also use a QR Code:  

The GUIDs for individual cells are displayed in the table below:

Multiple Linear Regression - Ordinary Least Squares
VariableParameterS.D.T-STATH0: parameter = 02-tail p-value1-tail p-value
(Intercept)-0.2918862672921580.329991-0.88450.3803330.190166
`Infl-Eu`-0.004469815644257160.039383-0.11350.9100580.455029
`Werkl-Eu`0.04978388111315220.0207672.39730.0200070.010003
`Infl-VS`-0.01188983542407540.017536-0.6780.5006630.250332
`Werkl-VS`0.160227583006180.0357574.48113.9e-051.9e-05
t0.01061047002700440.0014557.293400


Multiple Linear Regression - Regression Statistics
Multiple R0.873434909037978
R-squared0.762888540326181
Adjusted R-squared0.740933775541568
F-TEST (value)34.7481992091692
F-TEST (DF numerator)5
F-TEST (DF denominator)54
p-value9.9920072216264e-16
Multiple Linear Regression - Residual Statistics
Residual Standard Deviation0.0455153120510615
Sum Squared Residuals0.111868756079697

\begin{tabular}{lllllllll}
\hline
Multiple Linear Regression - Regression Statistics \tabularnewline
Multiple R & 0.873434909037978 \tabularnewline
R-squared & 0.762888540326181 \tabularnewline
Adjusted R-squared & 0.740933775541568 \tabularnewline
F-TEST (value) & 34.7481992091692 \tabularnewline
F-TEST (DF numerator) & 5 \tabularnewline
F-TEST (DF denominator) & 54 \tabularnewline
p-value & 9.9920072216264e-16 \tabularnewline
Multiple Linear Regression - Residual Statistics \tabularnewline
Residual Standard Deviation & 0.0455153120510615 \tabularnewline
Sum Squared Residuals & 0.111868756079697 \tabularnewline
\hline
\end{tabular}
%Source: https://freestatistics.org/blog/index.php?pk=159440&T=3

[TABLE]
[ROW][C]Multiple Linear Regression - Regression Statistics[/C][/ROW]
[ROW][C]Multiple R[/C][C]0.873434909037978[/C][/ROW]
[ROW][C]R-squared[/C][C]0.762888540326181[/C][/ROW]
[ROW][C]Adjusted R-squared[/C][C]0.740933775541568[/C][/ROW]
[ROW][C]F-TEST (value)[/C][C]34.7481992091692[/C][/ROW]
[ROW][C]F-TEST (DF numerator)[/C][C]5[/C][/ROW]
[ROW][C]F-TEST (DF denominator)[/C][C]54[/C][/ROW]
[ROW][C]p-value[/C][C]9.9920072216264e-16[/C][/ROW]
[ROW][C]Multiple Linear Regression - Residual Statistics[/C][/ROW]
[ROW][C]Residual Standard Deviation[/C][C]0.0455153120510615[/C][/ROW]
[ROW][C]Sum Squared Residuals[/C][C]0.111868756079697[/C][/ROW]
[/TABLE]
Source: https://freestatistics.org/blog/index.php?pk=159440&T=3

Globally Unique Identifier (entire table): ba.freestatistics.org/blog/index.php?pk=159440&T=3

As an alternative you can also use a QR Code:  

The GUIDs for individual cells are displayed in the table below:

Multiple Linear Regression - Regression Statistics
Multiple R0.873434909037978
R-squared0.762888540326181
Adjusted R-squared0.740933775541568
F-TEST (value)34.7481992091692
F-TEST (DF numerator)5
F-TEST (DF denominator)54
p-value9.9920072216264e-16
Multiple Linear Regression - Residual Statistics
Residual Standard Deviation0.0455153120510615
Sum Squared Residuals0.111868756079697


Multiple Linear Regression - Actuals, Interpolation, and Residuals
Time or IndexActualsInterpolationForecastResidualsPrediction Error
11.06221.05231405755560.00988594244439663
21.07731.074581720162190.00271827983780483
31.08071.08576313164121-0.00506313164120515
41.08481.12319831575466-0.0383983157546593
51.15821.154070540065670.00412945993432607
61.16631.19717856979168-0.0308785697916795
71.13721.19126844270693-0.0540684427069343
81.11391.183372021911-0.0694720219110025
91.12221.19312665313912-0.0709266531391235
101.16921.1919374819131-0.0227374819131025
111.17021.17281872777452-0.00261872777451986
121.22861.168983875977640.0596161240223644
131.26131.183429546286910.0778704537130861
141.26461.17972256915270.0848774308473021
151.22621.223826276500970.00237372349903346
161.19851.194510875750220.00398912424978365
171.20071.197335034710720.00336496528928464
181.21381.205776722508850.008023277491151
191.22661.205136247340670.0214637526593346
201.21761.20476218073350.0128378192664996
211.22181.219565851030530.00223414896946936
221.2491.235636225205830.0133637747941679
231.29911.229683448426780.0694165515732171
241.34081.242989151346330.097810848653673
251.31191.242761984356690.069138015643308
261.30141.269021333760760.0323786662392367
271.32011.24492603260490.075173967395102
281.29381.251256161879240.0425438381207648
291.26941.250749927832090.0186500721679115
301.21651.24810091355855-0.0316009135585498
311.20371.24617435804954-0.0424743580495364
321.22921.23616952474887-0.00696952474887039
331.22561.24703698319012-0.0214369831901163
341.20151.26064346239234-0.0591434623923374
351.17861.2792449773977-0.1006449773977
361.18561.27077255361642-0.0851725536164227
371.21031.2366879496103-0.0263879496103015
381.19381.26790735650661-0.0741073565066074
391.2021.26081722218788-0.0588172221878824
401.22711.26284929067972-0.0357492906797201
411.2771.248073949198650.0289260508013463
421.2651.249433361745070.015566638254926
431.26841.27455213317016-0.00615213317016278
441.28111.28704403639588-0.00594403639588019
451.27271.28622995668779-0.0135299566877863
461.26111.28719499367987-0.0260949936798658
471.28811.30314646950093-0.0150464695009267
481.32131.283987231679750.037312768320251
491.29991.32907465248957-0.0291746524895689
501.30741.31414359324932-0.00674359324932318
511.32421.298527755736170.0256722442638302
521.35161.322679461391530.028920538608467
531.35111.314346876433640.0367531235663643
541.34191.35351799138396-0.0116179913839552
551.37161.38701104102161-0.0154110410216061
561.36221.38369573726102-0.0214957372610183
571.38961.39616103647913-0.00656103647912936
581.42271.39327117180870.0294288281912998
591.46841.390998044303640.0774019556963564
601.4571.454402806624570.00259719337543472

\begin{tabular}{lllllllll}
\hline
Multiple Linear Regression - Actuals, Interpolation, and Residuals \tabularnewline
Time or Index & Actuals & InterpolationForecast & ResidualsPrediction Error \tabularnewline
1 & 1.0622 & 1.0523140575556 & 0.00988594244439663 \tabularnewline
2 & 1.0773 & 1.07458172016219 & 0.00271827983780483 \tabularnewline
3 & 1.0807 & 1.08576313164121 & -0.00506313164120515 \tabularnewline
4 & 1.0848 & 1.12319831575466 & -0.0383983157546593 \tabularnewline
5 & 1.1582 & 1.15407054006567 & 0.00412945993432607 \tabularnewline
6 & 1.1663 & 1.19717856979168 & -0.0308785697916795 \tabularnewline
7 & 1.1372 & 1.19126844270693 & -0.0540684427069343 \tabularnewline
8 & 1.1139 & 1.183372021911 & -0.0694720219110025 \tabularnewline
9 & 1.1222 & 1.19312665313912 & -0.0709266531391235 \tabularnewline
10 & 1.1692 & 1.1919374819131 & -0.0227374819131025 \tabularnewline
11 & 1.1702 & 1.17281872777452 & -0.00261872777451986 \tabularnewline
12 & 1.2286 & 1.16898387597764 & 0.0596161240223644 \tabularnewline
13 & 1.2613 & 1.18342954628691 & 0.0778704537130861 \tabularnewline
14 & 1.2646 & 1.1797225691527 & 0.0848774308473021 \tabularnewline
15 & 1.2262 & 1.22382627650097 & 0.00237372349903346 \tabularnewline
16 & 1.1985 & 1.19451087575022 & 0.00398912424978365 \tabularnewline
17 & 1.2007 & 1.19733503471072 & 0.00336496528928464 \tabularnewline
18 & 1.2138 & 1.20577672250885 & 0.008023277491151 \tabularnewline
19 & 1.2266 & 1.20513624734067 & 0.0214637526593346 \tabularnewline
20 & 1.2176 & 1.2047621807335 & 0.0128378192664996 \tabularnewline
21 & 1.2218 & 1.21956585103053 & 0.00223414896946936 \tabularnewline
22 & 1.249 & 1.23563622520583 & 0.0133637747941679 \tabularnewline
23 & 1.2991 & 1.22968344842678 & 0.0694165515732171 \tabularnewline
24 & 1.3408 & 1.24298915134633 & 0.097810848653673 \tabularnewline
25 & 1.3119 & 1.24276198435669 & 0.069138015643308 \tabularnewline
26 & 1.3014 & 1.26902133376076 & 0.0323786662392367 \tabularnewline
27 & 1.3201 & 1.2449260326049 & 0.075173967395102 \tabularnewline
28 & 1.2938 & 1.25125616187924 & 0.0425438381207648 \tabularnewline
29 & 1.2694 & 1.25074992783209 & 0.0186500721679115 \tabularnewline
30 & 1.2165 & 1.24810091355855 & -0.0316009135585498 \tabularnewline
31 & 1.2037 & 1.24617435804954 & -0.0424743580495364 \tabularnewline
32 & 1.2292 & 1.23616952474887 & -0.00696952474887039 \tabularnewline
33 & 1.2256 & 1.24703698319012 & -0.0214369831901163 \tabularnewline
34 & 1.2015 & 1.26064346239234 & -0.0591434623923374 \tabularnewline
35 & 1.1786 & 1.2792449773977 & -0.1006449773977 \tabularnewline
36 & 1.1856 & 1.27077255361642 & -0.0851725536164227 \tabularnewline
37 & 1.2103 & 1.2366879496103 & -0.0263879496103015 \tabularnewline
38 & 1.1938 & 1.26790735650661 & -0.0741073565066074 \tabularnewline
39 & 1.202 & 1.26081722218788 & -0.0588172221878824 \tabularnewline
40 & 1.2271 & 1.26284929067972 & -0.0357492906797201 \tabularnewline
41 & 1.277 & 1.24807394919865 & 0.0289260508013463 \tabularnewline
42 & 1.265 & 1.24943336174507 & 0.015566638254926 \tabularnewline
43 & 1.2684 & 1.27455213317016 & -0.00615213317016278 \tabularnewline
44 & 1.2811 & 1.28704403639588 & -0.00594403639588019 \tabularnewline
45 & 1.2727 & 1.28622995668779 & -0.0135299566877863 \tabularnewline
46 & 1.2611 & 1.28719499367987 & -0.0260949936798658 \tabularnewline
47 & 1.2881 & 1.30314646950093 & -0.0150464695009267 \tabularnewline
48 & 1.3213 & 1.28398723167975 & 0.037312768320251 \tabularnewline
49 & 1.2999 & 1.32907465248957 & -0.0291746524895689 \tabularnewline
50 & 1.3074 & 1.31414359324932 & -0.00674359324932318 \tabularnewline
51 & 1.3242 & 1.29852775573617 & 0.0256722442638302 \tabularnewline
52 & 1.3516 & 1.32267946139153 & 0.028920538608467 \tabularnewline
53 & 1.3511 & 1.31434687643364 & 0.0367531235663643 \tabularnewline
54 & 1.3419 & 1.35351799138396 & -0.0116179913839552 \tabularnewline
55 & 1.3716 & 1.38701104102161 & -0.0154110410216061 \tabularnewline
56 & 1.3622 & 1.38369573726102 & -0.0214957372610183 \tabularnewline
57 & 1.3896 & 1.39616103647913 & -0.00656103647912936 \tabularnewline
58 & 1.4227 & 1.3932711718087 & 0.0294288281912998 \tabularnewline
59 & 1.4684 & 1.39099804430364 & 0.0774019556963564 \tabularnewline
60 & 1.457 & 1.45440280662457 & 0.00259719337543472 \tabularnewline
\hline
\end{tabular}
%Source: https://freestatistics.org/blog/index.php?pk=159440&T=4

[TABLE]
[ROW][C]Multiple Linear Regression - Actuals, Interpolation, and Residuals[/C][/ROW]
[ROW][C]Time or Index[/C][C]Actuals[/C][C]InterpolationForecast[/C][C]ResidualsPrediction Error[/C][/ROW]
[ROW][C]1[/C][C]1.0622[/C][C]1.0523140575556[/C][C]0.00988594244439663[/C][/ROW]
[ROW][C]2[/C][C]1.0773[/C][C]1.07458172016219[/C][C]0.00271827983780483[/C][/ROW]
[ROW][C]3[/C][C]1.0807[/C][C]1.08576313164121[/C][C]-0.00506313164120515[/C][/ROW]
[ROW][C]4[/C][C]1.0848[/C][C]1.12319831575466[/C][C]-0.0383983157546593[/C][/ROW]
[ROW][C]5[/C][C]1.1582[/C][C]1.15407054006567[/C][C]0.00412945993432607[/C][/ROW]
[ROW][C]6[/C][C]1.1663[/C][C]1.19717856979168[/C][C]-0.0308785697916795[/C][/ROW]
[ROW][C]7[/C][C]1.1372[/C][C]1.19126844270693[/C][C]-0.0540684427069343[/C][/ROW]
[ROW][C]8[/C][C]1.1139[/C][C]1.183372021911[/C][C]-0.0694720219110025[/C][/ROW]
[ROW][C]9[/C][C]1.1222[/C][C]1.19312665313912[/C][C]-0.0709266531391235[/C][/ROW]
[ROW][C]10[/C][C]1.1692[/C][C]1.1919374819131[/C][C]-0.0227374819131025[/C][/ROW]
[ROW][C]11[/C][C]1.1702[/C][C]1.17281872777452[/C][C]-0.00261872777451986[/C][/ROW]
[ROW][C]12[/C][C]1.2286[/C][C]1.16898387597764[/C][C]0.0596161240223644[/C][/ROW]
[ROW][C]13[/C][C]1.2613[/C][C]1.18342954628691[/C][C]0.0778704537130861[/C][/ROW]
[ROW][C]14[/C][C]1.2646[/C][C]1.1797225691527[/C][C]0.0848774308473021[/C][/ROW]
[ROW][C]15[/C][C]1.2262[/C][C]1.22382627650097[/C][C]0.00237372349903346[/C][/ROW]
[ROW][C]16[/C][C]1.1985[/C][C]1.19451087575022[/C][C]0.00398912424978365[/C][/ROW]
[ROW][C]17[/C][C]1.2007[/C][C]1.19733503471072[/C][C]0.00336496528928464[/C][/ROW]
[ROW][C]18[/C][C]1.2138[/C][C]1.20577672250885[/C][C]0.008023277491151[/C][/ROW]
[ROW][C]19[/C][C]1.2266[/C][C]1.20513624734067[/C][C]0.0214637526593346[/C][/ROW]
[ROW][C]20[/C][C]1.2176[/C][C]1.2047621807335[/C][C]0.0128378192664996[/C][/ROW]
[ROW][C]21[/C][C]1.2218[/C][C]1.21956585103053[/C][C]0.00223414896946936[/C][/ROW]
[ROW][C]22[/C][C]1.249[/C][C]1.23563622520583[/C][C]0.0133637747941679[/C][/ROW]
[ROW][C]23[/C][C]1.2991[/C][C]1.22968344842678[/C][C]0.0694165515732171[/C][/ROW]
[ROW][C]24[/C][C]1.3408[/C][C]1.24298915134633[/C][C]0.097810848653673[/C][/ROW]
[ROW][C]25[/C][C]1.3119[/C][C]1.24276198435669[/C][C]0.069138015643308[/C][/ROW]
[ROW][C]26[/C][C]1.3014[/C][C]1.26902133376076[/C][C]0.0323786662392367[/C][/ROW]
[ROW][C]27[/C][C]1.3201[/C][C]1.2449260326049[/C][C]0.075173967395102[/C][/ROW]
[ROW][C]28[/C][C]1.2938[/C][C]1.25125616187924[/C][C]0.0425438381207648[/C][/ROW]
[ROW][C]29[/C][C]1.2694[/C][C]1.25074992783209[/C][C]0.0186500721679115[/C][/ROW]
[ROW][C]30[/C][C]1.2165[/C][C]1.24810091355855[/C][C]-0.0316009135585498[/C][/ROW]
[ROW][C]31[/C][C]1.2037[/C][C]1.24617435804954[/C][C]-0.0424743580495364[/C][/ROW]
[ROW][C]32[/C][C]1.2292[/C][C]1.23616952474887[/C][C]-0.00696952474887039[/C][/ROW]
[ROW][C]33[/C][C]1.2256[/C][C]1.24703698319012[/C][C]-0.0214369831901163[/C][/ROW]
[ROW][C]34[/C][C]1.2015[/C][C]1.26064346239234[/C][C]-0.0591434623923374[/C][/ROW]
[ROW][C]35[/C][C]1.1786[/C][C]1.2792449773977[/C][C]-0.1006449773977[/C][/ROW]
[ROW][C]36[/C][C]1.1856[/C][C]1.27077255361642[/C][C]-0.0851725536164227[/C][/ROW]
[ROW][C]37[/C][C]1.2103[/C][C]1.2366879496103[/C][C]-0.0263879496103015[/C][/ROW]
[ROW][C]38[/C][C]1.1938[/C][C]1.26790735650661[/C][C]-0.0741073565066074[/C][/ROW]
[ROW][C]39[/C][C]1.202[/C][C]1.26081722218788[/C][C]-0.0588172221878824[/C][/ROW]
[ROW][C]40[/C][C]1.2271[/C][C]1.26284929067972[/C][C]-0.0357492906797201[/C][/ROW]
[ROW][C]41[/C][C]1.277[/C][C]1.24807394919865[/C][C]0.0289260508013463[/C][/ROW]
[ROW][C]42[/C][C]1.265[/C][C]1.24943336174507[/C][C]0.015566638254926[/C][/ROW]
[ROW][C]43[/C][C]1.2684[/C][C]1.27455213317016[/C][C]-0.00615213317016278[/C][/ROW]
[ROW][C]44[/C][C]1.2811[/C][C]1.28704403639588[/C][C]-0.00594403639588019[/C][/ROW]
[ROW][C]45[/C][C]1.2727[/C][C]1.28622995668779[/C][C]-0.0135299566877863[/C][/ROW]
[ROW][C]46[/C][C]1.2611[/C][C]1.28719499367987[/C][C]-0.0260949936798658[/C][/ROW]
[ROW][C]47[/C][C]1.2881[/C][C]1.30314646950093[/C][C]-0.0150464695009267[/C][/ROW]
[ROW][C]48[/C][C]1.3213[/C][C]1.28398723167975[/C][C]0.037312768320251[/C][/ROW]
[ROW][C]49[/C][C]1.2999[/C][C]1.32907465248957[/C][C]-0.0291746524895689[/C][/ROW]
[ROW][C]50[/C][C]1.3074[/C][C]1.31414359324932[/C][C]-0.00674359324932318[/C][/ROW]
[ROW][C]51[/C][C]1.3242[/C][C]1.29852775573617[/C][C]0.0256722442638302[/C][/ROW]
[ROW][C]52[/C][C]1.3516[/C][C]1.32267946139153[/C][C]0.028920538608467[/C][/ROW]
[ROW][C]53[/C][C]1.3511[/C][C]1.31434687643364[/C][C]0.0367531235663643[/C][/ROW]
[ROW][C]54[/C][C]1.3419[/C][C]1.35351799138396[/C][C]-0.0116179913839552[/C][/ROW]
[ROW][C]55[/C][C]1.3716[/C][C]1.38701104102161[/C][C]-0.0154110410216061[/C][/ROW]
[ROW][C]56[/C][C]1.3622[/C][C]1.38369573726102[/C][C]-0.0214957372610183[/C][/ROW]
[ROW][C]57[/C][C]1.3896[/C][C]1.39616103647913[/C][C]-0.00656103647912936[/C][/ROW]
[ROW][C]58[/C][C]1.4227[/C][C]1.3932711718087[/C][C]0.0294288281912998[/C][/ROW]
[ROW][C]59[/C][C]1.4684[/C][C]1.39099804430364[/C][C]0.0774019556963564[/C][/ROW]
[ROW][C]60[/C][C]1.457[/C][C]1.45440280662457[/C][C]0.00259719337543472[/C][/ROW]
[/TABLE]
Source: https://freestatistics.org/blog/index.php?pk=159440&T=4

Globally Unique Identifier (entire table): ba.freestatistics.org/blog/index.php?pk=159440&T=4

As an alternative you can also use a QR Code:  

The GUIDs for individual cells are displayed in the table below:

Multiple Linear Regression - Actuals, Interpolation, and Residuals
Time or IndexActualsInterpolationForecastResidualsPrediction Error
11.06221.05231405755560.00988594244439663
21.07731.074581720162190.00271827983780483
31.08071.08576313164121-0.00506313164120515
41.08481.12319831575466-0.0383983157546593
51.15821.154070540065670.00412945993432607
61.16631.19717856979168-0.0308785697916795
71.13721.19126844270693-0.0540684427069343
81.11391.183372021911-0.0694720219110025
91.12221.19312665313912-0.0709266531391235
101.16921.1919374819131-0.0227374819131025
111.17021.17281872777452-0.00261872777451986
121.22861.168983875977640.0596161240223644
131.26131.183429546286910.0778704537130861
141.26461.17972256915270.0848774308473021
151.22621.223826276500970.00237372349903346
161.19851.194510875750220.00398912424978365
171.20071.197335034710720.00336496528928464
181.21381.205776722508850.008023277491151
191.22661.205136247340670.0214637526593346
201.21761.20476218073350.0128378192664996
211.22181.219565851030530.00223414896946936
221.2491.235636225205830.0133637747941679
231.29911.229683448426780.0694165515732171
241.34081.242989151346330.097810848653673
251.31191.242761984356690.069138015643308
261.30141.269021333760760.0323786662392367
271.32011.24492603260490.075173967395102
281.29381.251256161879240.0425438381207648
291.26941.250749927832090.0186500721679115
301.21651.24810091355855-0.0316009135585498
311.20371.24617435804954-0.0424743580495364
321.22921.23616952474887-0.00696952474887039
331.22561.24703698319012-0.0214369831901163
341.20151.26064346239234-0.0591434623923374
351.17861.2792449773977-0.1006449773977
361.18561.27077255361642-0.0851725536164227
371.21031.2366879496103-0.0263879496103015
381.19381.26790735650661-0.0741073565066074
391.2021.26081722218788-0.0588172221878824
401.22711.26284929067972-0.0357492906797201
411.2771.248073949198650.0289260508013463
421.2651.249433361745070.015566638254926
431.26841.27455213317016-0.00615213317016278
441.28111.28704403639588-0.00594403639588019
451.27271.28622995668779-0.0135299566877863
461.26111.28719499367987-0.0260949936798658
471.28811.30314646950093-0.0150464695009267
481.32131.283987231679750.037312768320251
491.29991.32907465248957-0.0291746524895689
501.30741.31414359324932-0.00674359324932318
511.32421.298527755736170.0256722442638302
521.35161.322679461391530.028920538608467
531.35111.314346876433640.0367531235663643
541.34191.35351799138396-0.0116179913839552
551.37161.38701104102161-0.0154110410216061
561.36221.38369573726102-0.0214957372610183
571.38961.39616103647913-0.00656103647912936
581.42271.39327117180870.0294288281912998
591.46841.390998044303640.0774019556963564
601.4571.454402806624570.00259719337543472


Goldfeld-Quandt test for Heteroskedasticity
p-valuesAlternative Hypothesis
breakpoint indexgreater2-sidedless
90.04263421178697520.08526842357395040.957365788213025
100.03191604440251150.0638320888050230.968083955597488
110.02524759277762540.05049518555525090.974752407222375
120.01151044390415420.02302088780830840.988489556095846
130.01984550750733160.03969101501466310.980154492492668
140.009006944507378950.01801388901475790.99099305549262
150.04318389776690370.08636779553380750.956816102233096
160.04400847861578990.08801695723157970.95599152138421
170.02770808837564810.05541617675129610.972291911624352
180.02604327146673530.05208654293347050.973956728533265
190.01841585201607730.03683170403215470.981584147983923
200.03825104744659340.07650209489318670.961748952553407
210.1372628115799330.2745256231598670.862737188420067
220.3989255824076940.7978511648153890.601074417592306
230.4860067264378070.9720134528756140.513993273562193
240.7390698400311170.5218603199377650.260930159968883
250.6793182596364510.6413634807270980.320681740363549
260.620788209685120.758423580629760.37921179031488
270.6550392632435580.6899214735128840.344960736756442
280.836040073259790.327919853480420.16395992674021
290.9443765427198520.1112469145602970.0556234572801483
300.972158595586030.05568280882793990.02784140441397
310.9646061526711960.07078769465760860.0353938473288043
320.9985995457915360.002800908416927940.00140045420846397
330.9999580696652238.38606695538136e-054.19303347769068e-05
340.9999828204781153.43590437690103e-051.71795218845052e-05
350.999976502900564.69941988799165e-052.34970994399583e-05
360.9999751177274554.97645450904618e-052.48822725452309e-05
370.9999881786912882.36426174243101e-051.1821308712155e-05
380.9999827371188133.45257623740219e-051.72628811870109e-05
390.9999909288513381.81422973230288e-059.07114866151438e-06
400.9999962482157427.50356851685284e-063.75178425842642e-06
410.9999982587602033.48247959436799e-061.741239797184e-06
420.9999977154373554.56912529040335e-062.28456264520167e-06
430.9999949249788911.01500422172292e-055.07502110861458e-06
440.9999859674634532.80650730935237e-051.40325365467619e-05
450.999942350591740.0001152988165217835.76494082608917e-05
460.9997780158152640.0004439683694715560.000221984184735778
470.9993318876540370.001336224691926670.000668112345963333
480.9989940211928140.00201195761437150.00100597880718575
490.995788610847460.008422778305080710.00421138915254035
500.9861025219570520.02779495608589520.0138974780429476
510.973786926514480.0524261469710380.026213073485519

\begin{tabular}{lllllllll}
\hline
Goldfeld-Quandt test for Heteroskedasticity \tabularnewline
p-values & Alternative Hypothesis \tabularnewline
breakpoint index & greater & 2-sided & less \tabularnewline
9 & 0.0426342117869752 & 0.0852684235739504 & 0.957365788213025 \tabularnewline
10 & 0.0319160444025115 & 0.063832088805023 & 0.968083955597488 \tabularnewline
11 & 0.0252475927776254 & 0.0504951855552509 & 0.974752407222375 \tabularnewline
12 & 0.0115104439041542 & 0.0230208878083084 & 0.988489556095846 \tabularnewline
13 & 0.0198455075073316 & 0.0396910150146631 & 0.980154492492668 \tabularnewline
14 & 0.00900694450737895 & 0.0180138890147579 & 0.99099305549262 \tabularnewline
15 & 0.0431838977669037 & 0.0863677955338075 & 0.956816102233096 \tabularnewline
16 & 0.0440084786157899 & 0.0880169572315797 & 0.95599152138421 \tabularnewline
17 & 0.0277080883756481 & 0.0554161767512961 & 0.972291911624352 \tabularnewline
18 & 0.0260432714667353 & 0.0520865429334705 & 0.973956728533265 \tabularnewline
19 & 0.0184158520160773 & 0.0368317040321547 & 0.981584147983923 \tabularnewline
20 & 0.0382510474465934 & 0.0765020948931867 & 0.961748952553407 \tabularnewline
21 & 0.137262811579933 & 0.274525623159867 & 0.862737188420067 \tabularnewline
22 & 0.398925582407694 & 0.797851164815389 & 0.601074417592306 \tabularnewline
23 & 0.486006726437807 & 0.972013452875614 & 0.513993273562193 \tabularnewline
24 & 0.739069840031117 & 0.521860319937765 & 0.260930159968883 \tabularnewline
25 & 0.679318259636451 & 0.641363480727098 & 0.320681740363549 \tabularnewline
26 & 0.62078820968512 & 0.75842358062976 & 0.37921179031488 \tabularnewline
27 & 0.655039263243558 & 0.689921473512884 & 0.344960736756442 \tabularnewline
28 & 0.83604007325979 & 0.32791985348042 & 0.16395992674021 \tabularnewline
29 & 0.944376542719852 & 0.111246914560297 & 0.0556234572801483 \tabularnewline
30 & 0.97215859558603 & 0.0556828088279399 & 0.02784140441397 \tabularnewline
31 & 0.964606152671196 & 0.0707876946576086 & 0.0353938473288043 \tabularnewline
32 & 0.998599545791536 & 0.00280090841692794 & 0.00140045420846397 \tabularnewline
33 & 0.999958069665223 & 8.38606695538136e-05 & 4.19303347769068e-05 \tabularnewline
34 & 0.999982820478115 & 3.43590437690103e-05 & 1.71795218845052e-05 \tabularnewline
35 & 0.99997650290056 & 4.69941988799165e-05 & 2.34970994399583e-05 \tabularnewline
36 & 0.999975117727455 & 4.97645450904618e-05 & 2.48822725452309e-05 \tabularnewline
37 & 0.999988178691288 & 2.36426174243101e-05 & 1.1821308712155e-05 \tabularnewline
38 & 0.999982737118813 & 3.45257623740219e-05 & 1.72628811870109e-05 \tabularnewline
39 & 0.999990928851338 & 1.81422973230288e-05 & 9.07114866151438e-06 \tabularnewline
40 & 0.999996248215742 & 7.50356851685284e-06 & 3.75178425842642e-06 \tabularnewline
41 & 0.999998258760203 & 3.48247959436799e-06 & 1.741239797184e-06 \tabularnewline
42 & 0.999997715437355 & 4.56912529040335e-06 & 2.28456264520167e-06 \tabularnewline
43 & 0.999994924978891 & 1.01500422172292e-05 & 5.07502110861458e-06 \tabularnewline
44 & 0.999985967463453 & 2.80650730935237e-05 & 1.40325365467619e-05 \tabularnewline
45 & 0.99994235059174 & 0.000115298816521783 & 5.76494082608917e-05 \tabularnewline
46 & 0.999778015815264 & 0.000443968369471556 & 0.000221984184735778 \tabularnewline
47 & 0.999331887654037 & 0.00133622469192667 & 0.000668112345963333 \tabularnewline
48 & 0.998994021192814 & 0.0020119576143715 & 0.00100597880718575 \tabularnewline
49 & 0.99578861084746 & 0.00842277830508071 & 0.00421138915254035 \tabularnewline
50 & 0.986102521957052 & 0.0277949560858952 & 0.0138974780429476 \tabularnewline
51 & 0.97378692651448 & 0.052426146971038 & 0.026213073485519 \tabularnewline
\hline
\end{tabular}
%Source: https://freestatistics.org/blog/index.php?pk=159440&T=5

[TABLE]
[ROW][C]Goldfeld-Quandt test for Heteroskedasticity[/C][/ROW]
[ROW][C]p-values[/C][C]Alternative Hypothesis[/C][/ROW]
[ROW][C]breakpoint index[/C][C]greater[/C][C]2-sided[/C][C]less[/C][/ROW]
[ROW][C]9[/C][C]0.0426342117869752[/C][C]0.0852684235739504[/C][C]0.957365788213025[/C][/ROW]
[ROW][C]10[/C][C]0.0319160444025115[/C][C]0.063832088805023[/C][C]0.968083955597488[/C][/ROW]
[ROW][C]11[/C][C]0.0252475927776254[/C][C]0.0504951855552509[/C][C]0.974752407222375[/C][/ROW]
[ROW][C]12[/C][C]0.0115104439041542[/C][C]0.0230208878083084[/C][C]0.988489556095846[/C][/ROW]
[ROW][C]13[/C][C]0.0198455075073316[/C][C]0.0396910150146631[/C][C]0.980154492492668[/C][/ROW]
[ROW][C]14[/C][C]0.00900694450737895[/C][C]0.0180138890147579[/C][C]0.99099305549262[/C][/ROW]
[ROW][C]15[/C][C]0.0431838977669037[/C][C]0.0863677955338075[/C][C]0.956816102233096[/C][/ROW]
[ROW][C]16[/C][C]0.0440084786157899[/C][C]0.0880169572315797[/C][C]0.95599152138421[/C][/ROW]
[ROW][C]17[/C][C]0.0277080883756481[/C][C]0.0554161767512961[/C][C]0.972291911624352[/C][/ROW]
[ROW][C]18[/C][C]0.0260432714667353[/C][C]0.0520865429334705[/C][C]0.973956728533265[/C][/ROW]
[ROW][C]19[/C][C]0.0184158520160773[/C][C]0.0368317040321547[/C][C]0.981584147983923[/C][/ROW]
[ROW][C]20[/C][C]0.0382510474465934[/C][C]0.0765020948931867[/C][C]0.961748952553407[/C][/ROW]
[ROW][C]21[/C][C]0.137262811579933[/C][C]0.274525623159867[/C][C]0.862737188420067[/C][/ROW]
[ROW][C]22[/C][C]0.398925582407694[/C][C]0.797851164815389[/C][C]0.601074417592306[/C][/ROW]
[ROW][C]23[/C][C]0.486006726437807[/C][C]0.972013452875614[/C][C]0.513993273562193[/C][/ROW]
[ROW][C]24[/C][C]0.739069840031117[/C][C]0.521860319937765[/C][C]0.260930159968883[/C][/ROW]
[ROW][C]25[/C][C]0.679318259636451[/C][C]0.641363480727098[/C][C]0.320681740363549[/C][/ROW]
[ROW][C]26[/C][C]0.62078820968512[/C][C]0.75842358062976[/C][C]0.37921179031488[/C][/ROW]
[ROW][C]27[/C][C]0.655039263243558[/C][C]0.689921473512884[/C][C]0.344960736756442[/C][/ROW]
[ROW][C]28[/C][C]0.83604007325979[/C][C]0.32791985348042[/C][C]0.16395992674021[/C][/ROW]
[ROW][C]29[/C][C]0.944376542719852[/C][C]0.111246914560297[/C][C]0.0556234572801483[/C][/ROW]
[ROW][C]30[/C][C]0.97215859558603[/C][C]0.0556828088279399[/C][C]0.02784140441397[/C][/ROW]
[ROW][C]31[/C][C]0.964606152671196[/C][C]0.0707876946576086[/C][C]0.0353938473288043[/C][/ROW]
[ROW][C]32[/C][C]0.998599545791536[/C][C]0.00280090841692794[/C][C]0.00140045420846397[/C][/ROW]
[ROW][C]33[/C][C]0.999958069665223[/C][C]8.38606695538136e-05[/C][C]4.19303347769068e-05[/C][/ROW]
[ROW][C]34[/C][C]0.999982820478115[/C][C]3.43590437690103e-05[/C][C]1.71795218845052e-05[/C][/ROW]
[ROW][C]35[/C][C]0.99997650290056[/C][C]4.69941988799165e-05[/C][C]2.34970994399583e-05[/C][/ROW]
[ROW][C]36[/C][C]0.999975117727455[/C][C]4.97645450904618e-05[/C][C]2.48822725452309e-05[/C][/ROW]
[ROW][C]37[/C][C]0.999988178691288[/C][C]2.36426174243101e-05[/C][C]1.1821308712155e-05[/C][/ROW]
[ROW][C]38[/C][C]0.999982737118813[/C][C]3.45257623740219e-05[/C][C]1.72628811870109e-05[/C][/ROW]
[ROW][C]39[/C][C]0.999990928851338[/C][C]1.81422973230288e-05[/C][C]9.07114866151438e-06[/C][/ROW]
[ROW][C]40[/C][C]0.999996248215742[/C][C]7.50356851685284e-06[/C][C]3.75178425842642e-06[/C][/ROW]
[ROW][C]41[/C][C]0.999998258760203[/C][C]3.48247959436799e-06[/C][C]1.741239797184e-06[/C][/ROW]
[ROW][C]42[/C][C]0.999997715437355[/C][C]4.56912529040335e-06[/C][C]2.28456264520167e-06[/C][/ROW]
[ROW][C]43[/C][C]0.999994924978891[/C][C]1.01500422172292e-05[/C][C]5.07502110861458e-06[/C][/ROW]
[ROW][C]44[/C][C]0.999985967463453[/C][C]2.80650730935237e-05[/C][C]1.40325365467619e-05[/C][/ROW]
[ROW][C]45[/C][C]0.99994235059174[/C][C]0.000115298816521783[/C][C]5.76494082608917e-05[/C][/ROW]
[ROW][C]46[/C][C]0.999778015815264[/C][C]0.000443968369471556[/C][C]0.000221984184735778[/C][/ROW]
[ROW][C]47[/C][C]0.999331887654037[/C][C]0.00133622469192667[/C][C]0.000668112345963333[/C][/ROW]
[ROW][C]48[/C][C]0.998994021192814[/C][C]0.0020119576143715[/C][C]0.00100597880718575[/C][/ROW]
[ROW][C]49[/C][C]0.99578861084746[/C][C]0.00842277830508071[/C][C]0.00421138915254035[/C][/ROW]
[ROW][C]50[/C][C]0.986102521957052[/C][C]0.0277949560858952[/C][C]0.0138974780429476[/C][/ROW]
[ROW][C]51[/C][C]0.97378692651448[/C][C]0.052426146971038[/C][C]0.026213073485519[/C][/ROW]
[/TABLE]
Source: https://freestatistics.org/blog/index.php?pk=159440&T=5

Globally Unique Identifier (entire table): ba.freestatistics.org/blog/index.php?pk=159440&T=5

As an alternative you can also use a QR Code:  

The GUIDs for individual cells are displayed in the table below:

Goldfeld-Quandt test for Heteroskedasticity
p-valuesAlternative Hypothesis
breakpoint indexgreater2-sidedless
90.04263421178697520.08526842357395040.957365788213025
100.03191604440251150.0638320888050230.968083955597488
110.02524759277762540.05049518555525090.974752407222375
120.01151044390415420.02302088780830840.988489556095846
130.01984550750733160.03969101501466310.980154492492668
140.009006944507378950.01801388901475790.99099305549262
150.04318389776690370.08636779553380750.956816102233096
160.04400847861578990.08801695723157970.95599152138421
170.02770808837564810.05541617675129610.972291911624352
180.02604327146673530.05208654293347050.973956728533265
190.01841585201607730.03683170403215470.981584147983923
200.03825104744659340.07650209489318670.961748952553407
210.1372628115799330.2745256231598670.862737188420067
220.3989255824076940.7978511648153890.601074417592306
230.4860067264378070.9720134528756140.513993273562193
240.7390698400311170.5218603199377650.260930159968883
250.6793182596364510.6413634807270980.320681740363549
260.620788209685120.758423580629760.37921179031488
270.6550392632435580.6899214735128840.344960736756442
280.836040073259790.327919853480420.16395992674021
290.9443765427198520.1112469145602970.0556234572801483
300.972158595586030.05568280882793990.02784140441397
310.9646061526711960.07078769465760860.0353938473288043
320.9985995457915360.002800908416927940.00140045420846397
330.9999580696652238.38606695538136e-054.19303347769068e-05
340.9999828204781153.43590437690103e-051.71795218845052e-05
350.999976502900564.69941988799165e-052.34970994399583e-05
360.9999751177274554.97645450904618e-052.48822725452309e-05
370.9999881786912882.36426174243101e-051.1821308712155e-05
380.9999827371188133.45257623740219e-051.72628811870109e-05
390.9999909288513381.81422973230288e-059.07114866151438e-06
400.9999962482157427.50356851685284e-063.75178425842642e-06
410.9999982587602033.48247959436799e-061.741239797184e-06
420.9999977154373554.56912529040335e-062.28456264520167e-06
430.9999949249788911.01500422172292e-055.07502110861458e-06
440.9999859674634532.80650730935237e-051.40325365467619e-05
450.999942350591740.0001152988165217835.76494082608917e-05
460.9997780158152640.0004439683694715560.000221984184735778
470.9993318876540370.001336224691926670.000668112345963333
480.9989940211928140.00201195761437150.00100597880718575
490.995788610847460.008422778305080710.00421138915254035
500.9861025219570520.02779495608589520.0138974780429476
510.973786926514480.0524261469710380.026213073485519


Meta Analysis of Goldfeld-Quandt test for Heteroskedasticity
Description# significant tests% significant testsOK/NOK
1% type I error level180.418604651162791NOK
5% type I error level230.534883720930233NOK
10% type I error level340.790697674418605NOK

\begin{tabular}{lllllllll}
\hline
Meta Analysis of Goldfeld-Quandt test for Heteroskedasticity \tabularnewline
Description & # significant tests & % significant tests & OK/NOK \tabularnewline
1% type I error level & 18 & 0.418604651162791 & NOK \tabularnewline
5% type I error level & 23 & 0.534883720930233 & NOK \tabularnewline
10% type I error level & 34 & 0.790697674418605 & NOK \tabularnewline
\hline
\end{tabular}
%Source: https://freestatistics.org/blog/index.php?pk=159440&T=6

[TABLE]
[ROW][C]Meta Analysis of Goldfeld-Quandt test for Heteroskedasticity[/C][/ROW]
[ROW][C]Description[/C][C]# significant tests[/C][C]% significant tests[/C][C]OK/NOK[/C][/ROW]
[ROW][C]1% type I error level[/C][C]18[/C][C]0.418604651162791[/C][C]NOK[/C][/ROW]
[ROW][C]5% type I error level[/C][C]23[/C][C]0.534883720930233[/C][C]NOK[/C][/ROW]
[ROW][C]10% type I error level[/C][C]34[/C][C]0.790697674418605[/C][C]NOK[/C][/ROW]
[/TABLE]
Source: https://freestatistics.org/blog/index.php?pk=159440&T=6

Globally Unique Identifier (entire table): ba.freestatistics.org/blog/index.php?pk=159440&T=6

As an alternative you can also use a QR Code:  

The GUIDs for individual cells are displayed in the table below:

Meta Analysis of Goldfeld-Quandt test for Heteroskedasticity
Description# significant tests% significant testsOK/NOK
1% type I error level180.418604651162791NOK
5% type I error level230.534883720930233NOK
10% type I error level340.790697674418605NOK


Parameters (Session):
par1 = 1 ; par2 = Do not include Seasonal Dummies ; par3 = Linear Trend ;
Parameters (R input):
par1 = 1 ; par2 = Do not include Seasonal Dummies ; par3 = Linear Trend ;
R code (references can be found in the software module):
library(lattice)
library(lmtest)
n25 <- 25 #minimum number of obs. for Goldfeld-Quandt test
par1 <- as.numeric(par1)
x <- t(y)
k <- length(x[1,])
n <- length(x[,1])
x1 <- cbind(x[,par1], x[,1:k!=par1])
mycolnames <- c(colnames(x)[par1], colnames(x)[1:k!=par1])
colnames(x1) <- mycolnames #colnames(x)[par1]
x <- x1
if (par3 == 'First Differences'){
x2 <- array(0, dim=c(n-1,k), dimnames=list(1:(n-1), paste('(1-B)',colnames(x),sep='')))
for (i in 1:n-1) {
for (j in 1:k) {
x2[i,j] <- x[i+1,j] - x[i,j]
}
}
x <- x2
}
if (par2 == 'Include Monthly Dummies'){
x2 <- array(0, dim=c(n,11), dimnames=list(1:n, paste('M', seq(1:11), sep ='')))
for (i in 1:11){
x2[seq(i,n,12),i] <- 1
}
x <- cbind(x, x2)
}
if (par2 == 'Include Quarterly Dummies'){
x2 <- array(0, dim=c(n,3), dimnames=list(1:n, paste('Q', seq(1:3), sep ='')))
for (i in 1:3){
x2[seq(i,n,4),i] <- 1
}
x <- cbind(x, x2)
}
k <- length(x[1,])
if (par3 == 'Linear Trend'){
x <- cbind(x, c(1:n))
colnames(x)[k+1] <- 't'
}
x
k <- length(x[1,])
df <- as.data.frame(x)
(mylm <- lm(df))
(mysum <- summary(mylm))
if (n > n25) {
kp3 <- k + 3
nmkm3 <- n - k - 3
gqarr <- array(NA, dim=c(nmkm3-kp3+1,3))
numgqtests <- 0
numsignificant1 <- 0
numsignificant5 <- 0
numsignificant10 <- 0
for (mypoint in kp3:nmkm3) {
j <- 0
numgqtests <- numgqtests + 1
for (myalt in c('greater', 'two.sided', 'less')) {
j <- j + 1
gqarr[mypoint-kp3+1,j] <- gqtest(mylm, point=mypoint, alternative=myalt)$p.value
}
if (gqarr[mypoint-kp3+1,2] < 0.01) numsignificant1 <- numsignificant1 + 1
if (gqarr[mypoint-kp3+1,2] < 0.05) numsignificant5 <- numsignificant5 + 1
if (gqarr[mypoint-kp3+1,2] < 0.10) numsignificant10 <- numsignificant10 + 1
}
gqarr
}
bitmap(file='test0.png')
plot(x[,1], type='l', main='Actuals and Interpolation', ylab='value of Actuals and Interpolation (dots)', xlab='time or index')
points(x[,1]-mysum$resid)
grid()
dev.off()
bitmap(file='test1.png')
plot(mysum$resid, type='b', pch=19, main='Residuals', ylab='value of Residuals', xlab='time or index')
grid()
dev.off()
bitmap(file='test2.png')
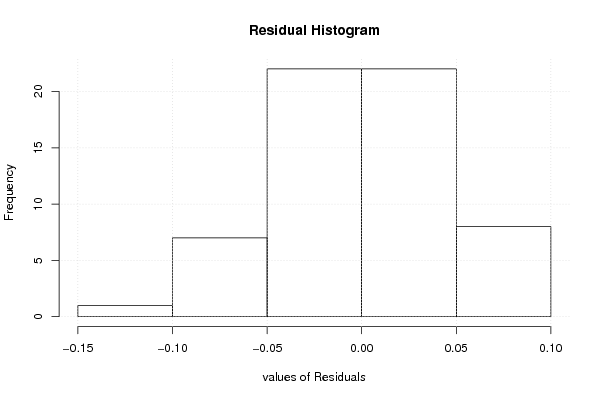
hist(mysum$resid, main='Residual Histogram', xlab='values of Residuals')
grid()
dev.off()
bitmap(file='test3.png')
densityplot(~mysum$resid,col='black',main='Residual Density Plot', xlab='values of Residuals')
dev.off()
bitmap(file='test4.png')
qqnorm(mysum$resid, main='Residual Normal Q-Q Plot')
qqline(mysum$resid)
grid()
dev.off()
(myerror <- as.ts(mysum$resid))
bitmap(file='test5.png')
dum <- cbind(lag(myerror,k=1),myerror)
dum
dum1 <- dum[2:length(myerror),]
dum1
z <- as.data.frame(dum1)
z
plot(z,main=paste('Residual Lag plot, lowess, and regression line'), ylab='values of Residuals', xlab='lagged values of Residuals')
lines(lowess(z))
abline(lm(z))
grid()
dev.off()
bitmap(file='test6.png')
acf(mysum$resid, lag.max=length(mysum$resid)/2, main='Residual Autocorrelation Function')
grid()
dev.off()
bitmap(file='test7.png')
pacf(mysum$resid, lag.max=length(mysum$resid)/2, main='Residual Partial Autocorrelation Function')
grid()
dev.off()
bitmap(file='test8.png')
opar <- par(mfrow = c(2,2), oma = c(0, 0, 1.1, 0))
plot(mylm, las = 1, sub='Residual Diagnostics')
par(opar)
dev.off()
if (n > n25) {
bitmap(file='test9.png')
plot(kp3:nmkm3,gqarr[,2], main='Goldfeld-Quandt test',ylab='2-sided p-value',xlab='breakpoint')
grid()
dev.off()
}
load(file='createtable')
a<-table.start()
a<-table.row.start(a)
a<-table.element(a, 'Multiple Linear Regression - Estimated Regression Equation', 1, TRUE)
a<-table.row.end(a)
myeq <- colnames(x)[1]
myeq <- paste(myeq, '[t] = ', sep='')
for (i in 1:k){
if (mysum$coefficients[i,1] > 0) myeq <- paste(myeq, '+', '')
myeq <- paste(myeq, mysum$coefficients[i,1], sep=' ')
if (rownames(mysum$coefficients)[i] != '(Intercept)') {
myeq <- paste(myeq, rownames(mysum$coefficients)[i], sep='')
if (rownames(mysum$coefficients)[i] != 't') myeq <- paste(myeq, '[t]', sep='')
}
}
myeq <- paste(myeq, ' + e[t]')
a<-table.row.start(a)
a<-table.element(a, myeq)
a<-table.row.end(a)
a<-table.end(a)
table.save(a,file='mytable1.tab')
a<-table.start()
a<-table.row.start(a)
a<-table.element(a,hyperlink('ols1.htm','Multiple Linear Regression - Ordinary Least Squares',''), 6, TRUE)
a<-table.row.end(a)
a<-table.row.start(a)
a<-table.element(a,'Variable',header=TRUE)
a<-table.element(a,'Parameter',header=TRUE)
a<-table.element(a,'S.D.',header=TRUE)
a<-table.element(a,'T-STAT
H0: parameter = 0',header=TRUE)
a<-table.element(a,'2-tail p-value',header=TRUE)
a<-table.element(a,'1-tail p-value',header=TRUE)
a<-table.row.end(a)
for (i in 1:k){
a<-table.row.start(a)
a<-table.element(a,rownames(mysum$coefficients)[i],header=TRUE)
a<-table.element(a,mysum$coefficients[i,1])
a<-table.element(a, round(mysum$coefficients[i,2],6))
a<-table.element(a, round(mysum$coefficients[i,3],4))
a<-table.element(a, round(mysum$coefficients[i,4],6))
a<-table.element(a, round(mysum$coefficients[i,4]/2,6))
a<-table.row.end(a)
}
a<-table.end(a)
table.save(a,file='mytable2.tab')
a<-table.start()
a<-table.row.start(a)
a<-table.element(a, 'Multiple Linear Regression - Regression Statistics', 2, TRUE)
a<-table.row.end(a)
a<-table.row.start(a)
a<-table.element(a, 'Multiple R',1,TRUE)
a<-table.element(a, sqrt(mysum$r.squared))
a<-table.row.end(a)
a<-table.row.start(a)
a<-table.element(a, 'R-squared',1,TRUE)
a<-table.element(a, mysum$r.squared)
a<-table.row.end(a)
a<-table.row.start(a)
a<-table.element(a, 'Adjusted R-squared',1,TRUE)
a<-table.element(a, mysum$adj.r.squared)
a<-table.row.end(a)
a<-table.row.start(a)
a<-table.element(a, 'F-TEST (value)',1,TRUE)
a<-table.element(a, mysum$fstatistic[1])
a<-table.row.end(a)
a<-table.row.start(a)
a<-table.element(a, 'F-TEST (DF numerator)',1,TRUE)
a<-table.element(a, mysum$fstatistic[2])
a<-table.row.end(a)
a<-table.row.start(a)
a<-table.element(a, 'F-TEST (DF denominator)',1,TRUE)
a<-table.element(a, mysum$fstatistic[3])
a<-table.row.end(a)
a<-table.row.start(a)
a<-table.element(a, 'p-value',1,TRUE)
a<-table.element(a, 1-pf(mysum$fstatistic[1],mysum$fstatistic[2],mysum$fstatistic[3]))
a<-table.row.end(a)
a<-table.row.start(a)
a<-table.element(a, 'Multiple Linear Regression - Residual Statistics', 2, TRUE)
a<-table.row.end(a)
a<-table.row.start(a)
a<-table.element(a, 'Residual Standard Deviation',1,TRUE)
a<-table.element(a, mysum$sigma)
a<-table.row.end(a)
a<-table.row.start(a)
a<-table.element(a, 'Sum Squared Residuals',1,TRUE)
a<-table.element(a, sum(myerror*myerror))
a<-table.row.end(a)
a<-table.end(a)
table.save(a,file='mytable3.tab')
a<-table.start()
a<-table.row.start(a)
a<-table.element(a, 'Multiple Linear Regression - Actuals, Interpolation, and Residuals', 4, TRUE)
a<-table.row.end(a)
a<-table.row.start(a)
a<-table.element(a, 'Time or Index', 1, TRUE)
a<-table.element(a, 'Actuals', 1, TRUE)
a<-table.element(a, 'Interpolation
Forecast', 1, TRUE)
a<-table.element(a, 'Residuals
Prediction Error', 1, TRUE)
a<-table.row.end(a)
for (i in 1:n) {
a<-table.row.start(a)
a<-table.element(a,i, 1, TRUE)
a<-table.element(a,x[i])
a<-table.element(a,x[i]-mysum$resid[i])
a<-table.element(a,mysum$resid[i])
a<-table.row.end(a)
}
a<-table.end(a)
table.save(a,file='mytable4.tab')
if (n > n25) {
a<-table.start()
a<-table.row.start(a)
a<-table.element(a,'Goldfeld-Quandt test for Heteroskedasticity',4,TRUE)
a<-table.row.end(a)
a<-table.row.start(a)
a<-table.element(a,'p-values',header=TRUE)
a<-table.element(a,'Alternative Hypothesis',3,header=TRUE)
a<-table.row.end(a)
a<-table.row.start(a)
a<-table.element(a,'breakpoint index',header=TRUE)
a<-table.element(a,'greater',header=TRUE)
a<-table.element(a,'2-sided',header=TRUE)
a<-table.element(a,'less',header=TRUE)
a<-table.row.end(a)
for (mypoint in kp3:nmkm3) {
a<-table.row.start(a)
a<-table.element(a,mypoint,header=TRUE)
a<-table.element(a,gqarr[mypoint-kp3+1,1])
a<-table.element(a,gqarr[mypoint-kp3+1,2])
a<-table.element(a,gqarr[mypoint-kp3+1,3])
a<-table.row.end(a)
}
a<-table.end(a)
table.save(a,file='mytable5.tab')
a<-table.start()
a<-table.row.start(a)
a<-table.element(a,'Meta Analysis of Goldfeld-Quandt test for Heteroskedasticity',4,TRUE)
a<-table.row.end(a)
a<-table.row.start(a)
a<-table.element(a,'Description',header=TRUE)
a<-table.element(a,'# significant tests',header=TRUE)
a<-table.element(a,'% significant tests',header=TRUE)
a<-table.element(a,'OK/NOK',header=TRUE)
a<-table.row.end(a)
a<-table.row.start(a)
a<-table.element(a,'1% type I error level',header=TRUE)
a<-table.element(a,numsignificant1)
a<-table.element(a,numsignificant1/numgqtests)
if (numsignificant1/numgqtests < 0.01) dum <- 'OK' else dum <- 'NOK'
a<-table.element(a,dum)
a<-table.row.end(a)
a<-table.row.start(a)
a<-table.element(a,'5% type I error level',header=TRUE)
a<-table.element(a,numsignificant5)
a<-table.element(a,numsignificant5/numgqtests)
if (numsignificant5/numgqtests < 0.05) dum <- 'OK' else dum <- 'NOK'
a<-table.element(a,dum)
a<-table.row.end(a)
a<-table.row.start(a)
a<-table.element(a,'10% type I error level',header=TRUE)
a<-table.element(a,numsignificant10)
a<-table.element(a,numsignificant10/numgqtests)
if (numsignificant10/numgqtests < 0.1) dum <- 'OK' else dum <- 'NOK'
a<-table.element(a,dum)
a<-table.row.end(a)
a<-table.end(a)
table.save(a,file='mytable6.tab')
}