Free Statistics

of Irreproducible Research!

Author's title

Author*The author of this computation has been verified*
R Software Modulerwasp_smp.wasp
Title produced by softwareStandard Deviation-Mean Plot
Date of computationThu, 22 Dec 2011 07:41:52 -0500
Cite this page as followsStatistical Computations at FreeStatistics.org, Office for Research Development and Education, URL https://freestatistics.org/blog/index.php?v=date/2011/Dec/22/t13245578031pua2alfomznvg3.htm/, Retrieved Fri, 03 May 2024 12:12:04 +0000
Statistical Computations at FreeStatistics.org, Office for Research Development and Education, URL https://freestatistics.org/blog/index.php?pk=159373, Retrieved Fri, 03 May 2024 12:12:04 +0000
QR Codes:

Original text written by user:
IsPrivate?No (this computation is public)
User-defined keywords
Estimated Impact99
Family? (F = Feedback message, R = changed R code, M = changed R Module, P = changed Parameters, D = changed Data)
-     [Kendall tau Correlation Matrix] [] [2010-12-05 17:44:33] [b98453cac15ba1066b407e146608df68]
- RMPD    [Standard Deviation-Mean Plot] [Standard Deviatio...] [2011-12-22 12:41:52] [e569a00cc6e8044e6afea1f18dd335a0] [Current]
Feedback Forum

Post a new message
Dataseries X:
2582
2624
2566
2645
3167
3051
2503
2574
2988
3086
2632
2604
2377
2258
2266
2601
2843
3018
2493
2647
3015
3101
2496
2342
2271
1969
2196
2294
2706
3001
2691
2554
2961
3226
2960
2749
2379
2254
2592
2780
2833
2911
2494
2643
2902
2880
2657
2609
2394
2492
2414
2621
3055
2940
2582
2430
2781
2904
2474
2254
2244
1972
2408
2523
2634
2798
2418
2551
2741
3011
2558
2167
1944
1836
2292
2576
2653
2900
2438
2439
2717
2872
2157
1541


Summary of computational transaction
Raw Inputview raw input (R code)
Raw Outputview raw output of R engine
Computing time1 seconds
R Server'Herman Ole Andreas Wold' @ wold.wessa.net

\begin{tabular}{lllllllll}
\hline
Summary of computational transaction \tabularnewline
Raw Input & view raw input (R code)  \tabularnewline
Raw Output & view raw output of R engine  \tabularnewline
Computing time & 1 seconds \tabularnewline
R Server & 'Herman Ole Andreas Wold' @ wold.wessa.net \tabularnewline
\hline
\end{tabular}
%Source: https://freestatistics.org/blog/index.php?pk=159373&T=0

[TABLE]
[ROW][C]Summary of computational transaction[/C][/ROW]
[ROW][C]Raw Input[/C][C]view raw input (R code) [/C][/ROW]
[ROW][C]Raw Output[/C][C]view raw output of R engine [/C][/ROW]
[ROW][C]Computing time[/C][C]1 seconds[/C][/ROW]
[ROW][C]R Server[/C][C]'Herman Ole Andreas Wold' @ wold.wessa.net[/C][/ROW]
[/TABLE]
Source: https://freestatistics.org/blog/index.php?pk=159373&T=0

Globally Unique Identifier (entire table): ba.freestatistics.org/blog/index.php?pk=159373&T=0

As an alternative you can also use a QR Code:  

The GUIDs for individual cells are displayed in the table below:

Summary of computational transaction
Raw Inputview raw input (R code)
Raw Outputview raw output of R engine
Computing time1 seconds
R Server'Herman Ole Andreas Wold' @ wold.wessa.net


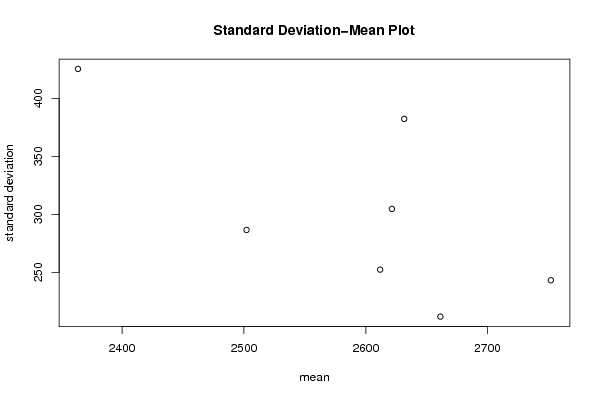
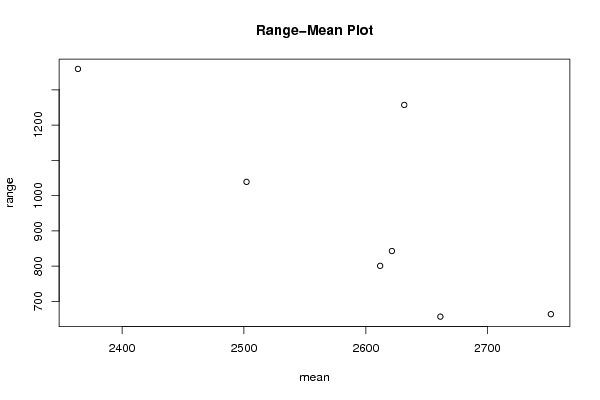
Standard Deviation-Mean Plot
SectionMeanStandard DeviationRange
12751.83333333333243.122802241371664
22621.41666666667304.628375188026843
32631.5382.3110347252971257
42661.16666666667211.736042078696657
52611.75252.280192354742801
62502.08333333333286.4835258894661039
72363.75425.3426693427741359

\begin{tabular}{lllllllll}
\hline
Standard Deviation-Mean Plot \tabularnewline
Section & Mean & Standard Deviation & Range \tabularnewline
1 & 2751.83333333333 & 243.122802241371 & 664 \tabularnewline
2 & 2621.41666666667 & 304.628375188026 & 843 \tabularnewline
3 & 2631.5 & 382.311034725297 & 1257 \tabularnewline
4 & 2661.16666666667 & 211.736042078696 & 657 \tabularnewline
5 & 2611.75 & 252.280192354742 & 801 \tabularnewline
6 & 2502.08333333333 & 286.483525889466 & 1039 \tabularnewline
7 & 2363.75 & 425.342669342774 & 1359 \tabularnewline
\hline
\end{tabular}
%Source: https://freestatistics.org/blog/index.php?pk=159373&T=1

[TABLE]
[ROW][C]Standard Deviation-Mean Plot[/C][/ROW]
[ROW][C]Section[/C][C]Mean[/C][C]Standard Deviation[/C][C]Range[/C][/ROW]
[ROW][C]1[/C][C]2751.83333333333[/C][C]243.122802241371[/C][C]664[/C][/ROW]
[ROW][C]2[/C][C]2621.41666666667[/C][C]304.628375188026[/C][C]843[/C][/ROW]
[ROW][C]3[/C][C]2631.5[/C][C]382.311034725297[/C][C]1257[/C][/ROW]
[ROW][C]4[/C][C]2661.16666666667[/C][C]211.736042078696[/C][C]657[/C][/ROW]
[ROW][C]5[/C][C]2611.75[/C][C]252.280192354742[/C][C]801[/C][/ROW]
[ROW][C]6[/C][C]2502.08333333333[/C][C]286.483525889466[/C][C]1039[/C][/ROW]
[ROW][C]7[/C][C]2363.75[/C][C]425.342669342774[/C][C]1359[/C][/ROW]
[/TABLE]
Source: https://freestatistics.org/blog/index.php?pk=159373&T=1

Globally Unique Identifier (entire table): ba.freestatistics.org/blog/index.php?pk=159373&T=1

As an alternative you can also use a QR Code:  

The GUIDs for individual cells are displayed in the table below:

Standard Deviation-Mean Plot
SectionMeanStandard DeviationRange
12751.83333333333243.122802241371664
22621.41666666667304.628375188026843
32631.5382.3110347252971257
42661.16666666667211.736042078696657
52611.75252.280192354742801
62502.08333333333286.4835258894661039
72363.75425.3426693427741359


Regression: S.E.(k) = alpha + beta * Mean(k)
alpha1415.73009863906
beta-0.430137848190982
S.D.0.200290126940754
T-STAT-2.14757389573285
p-value0.0845038616336044

\begin{tabular}{lllllllll}
\hline
Regression: S.E.(k) = alpha + beta * Mean(k) \tabularnewline
alpha & 1415.73009863906 \tabularnewline
beta & -0.430137848190982 \tabularnewline
S.D. & 0.200290126940754 \tabularnewline
T-STAT & -2.14757389573285 \tabularnewline
p-value & 0.0845038616336044 \tabularnewline
\hline
\end{tabular}
%Source: https://freestatistics.org/blog/index.php?pk=159373&T=2

[TABLE]
[ROW][C]Regression: S.E.(k) = alpha + beta * Mean(k)[/C][/ROW]
[ROW][C]alpha[/C][C]1415.73009863906[/C][/ROW]
[ROW][C]beta[/C][C]-0.430137848190982[/C][/ROW]
[ROW][C]S.D.[/C][C]0.200290126940754[/C][/ROW]
[ROW][C]T-STAT[/C][C]-2.14757389573285[/C][/ROW]
[ROW][C]p-value[/C][C]0.0845038616336044[/C][/ROW]
[/TABLE]
Source: https://freestatistics.org/blog/index.php?pk=159373&T=2

Globally Unique Identifier (entire table): ba.freestatistics.org/blog/index.php?pk=159373&T=2

As an alternative you can also use a QR Code:  

The GUIDs for individual cells are displayed in the table below:

Regression: S.E.(k) = alpha + beta * Mean(k)
alpha1415.73009863906
beta-0.430137848190982
S.D.0.200290126940754
T-STAT-2.14757389573285
p-value0.0845038616336044


Regression: ln S.E.(k) = alpha + beta * ln Mean(k)
alpha32.90257371329
beta-3.46389518572876
S.D.1.67105601892896
T-STAT-2.07287795650854
p-value0.0928990782187077
Lambda4.46389518572876

\begin{tabular}{lllllllll}
\hline
Regression: ln S.E.(k) = alpha + beta * ln Mean(k) \tabularnewline
alpha & 32.90257371329 \tabularnewline
beta & -3.46389518572876 \tabularnewline
S.D. & 1.67105601892896 \tabularnewline
T-STAT & -2.07287795650854 \tabularnewline
p-value & 0.0928990782187077 \tabularnewline
Lambda & 4.46389518572876 \tabularnewline
\hline
\end{tabular}
%Source: https://freestatistics.org/blog/index.php?pk=159373&T=3

[TABLE]
[ROW][C]Regression: ln S.E.(k) = alpha + beta * ln Mean(k)[/C][/ROW]
[ROW][C]alpha[/C][C]32.90257371329[/C][/ROW]
[ROW][C]beta[/C][C]-3.46389518572876[/C][/ROW]
[ROW][C]S.D.[/C][C]1.67105601892896[/C][/ROW]
[ROW][C]T-STAT[/C][C]-2.07287795650854[/C][/ROW]
[ROW][C]p-value[/C][C]0.0928990782187077[/C][/ROW]
[ROW][C]Lambda[/C][C]4.46389518572876[/C][/ROW]
[/TABLE]
Source: https://freestatistics.org/blog/index.php?pk=159373&T=3

Globally Unique Identifier (entire table): ba.freestatistics.org/blog/index.php?pk=159373&T=3

As an alternative you can also use a QR Code:  

The GUIDs for individual cells are displayed in the table below:

Regression: ln S.E.(k) = alpha + beta * ln Mean(k)
alpha32.90257371329
beta-3.46389518572876
S.D.1.67105601892896
T-STAT-2.07287795650854
p-value0.0928990782187077
Lambda4.46389518572876


Parameters (Session):
par1 = 12 ;
Parameters (R input):
par1 = 12 ;
R code (references can be found in the software module):
par1 <- as.numeric(par1)
(n <- length(x))
(np <- floor(n / par1))
arr <- array(NA,dim=c(par1,np))
j <- 0
k <- 1
for (i in 1:(np*par1))
{
j = j + 1
arr[j,k] <- x[i]
if (j == par1) {
j = 0
k=k+1
}
}
arr
arr.mean <- array(NA,dim=np)
arr.sd <- array(NA,dim=np)
arr.range <- array(NA,dim=np)
for (j in 1:np)
{
arr.mean[j] <- mean(arr[,j],na.rm=TRUE)
arr.sd[j] <- sd(arr[,j],na.rm=TRUE)
arr.range[j] <- max(arr[,j],na.rm=TRUE) - min(arr[,j],na.rm=TRUE)
}
arr.mean
arr.sd
arr.range
(lm1 <- lm(arr.sd~arr.mean))
(lnlm1 <- lm(log(arr.sd)~log(arr.mean)))
(lm2 <- lm(arr.range~arr.mean))
bitmap(file='test1.png')
plot(arr.mean,arr.sd,main='Standard Deviation-Mean Plot',xlab='mean',ylab='standard deviation')
dev.off()
bitmap(file='test2.png')
plot(arr.mean,arr.range,main='Range-Mean Plot',xlab='mean',ylab='range')
dev.off()
load(file='createtable')
a<-table.start()
a<-table.row.start(a)
a<-table.element(a,'Standard Deviation-Mean Plot',4,TRUE)
a<-table.row.end(a)
a<-table.row.start(a)
a<-table.element(a,'Section',header=TRUE)
a<-table.element(a,'Mean',header=TRUE)
a<-table.element(a,'Standard Deviation',header=TRUE)
a<-table.element(a,'Range',header=TRUE)
a<-table.row.end(a)
for (j in 1:np) {
a<-table.row.start(a)
a<-table.element(a,j,header=TRUE)
a<-table.element(a,arr.mean[j])
a<-table.element(a,arr.sd[j] )
a<-table.element(a,arr.range[j] )
a<-table.row.end(a)
}
a<-table.end(a)
table.save(a,file='mytable.tab')
a<-table.start()
a<-table.row.start(a)
a<-table.element(a,'Regression: S.E.(k) = alpha + beta * Mean(k)',2,TRUE)
a<-table.row.end(a)
a<-table.row.start(a)
a<-table.element(a,'alpha',header=TRUE)
a<-table.element(a,lm1$coefficients[[1]])
a<-table.row.end(a)
a<-table.row.start(a)
a<-table.element(a,'beta',header=TRUE)
a<-table.element(a,lm1$coefficients[[2]])
a<-table.row.end(a)
a<-table.row.start(a)
a<-table.element(a,'S.D.',header=TRUE)
a<-table.element(a,summary(lm1)$coefficients[2,2])
a<-table.row.end(a)
a<-table.row.start(a)
a<-table.element(a,'T-STAT',header=TRUE)
a<-table.element(a,summary(lm1)$coefficients[2,3])
a<-table.row.end(a)
a<-table.row.start(a)
a<-table.element(a,'p-value',header=TRUE)
a<-table.element(a,summary(lm1)$coefficients[2,4])
a<-table.row.end(a)
a<-table.end(a)
table.save(a,file='mytable1.tab')
a<-table.start()
a<-table.row.start(a)
a<-table.element(a,'Regression: ln S.E.(k) = alpha + beta * ln Mean(k)',2,TRUE)
a<-table.row.end(a)
a<-table.row.start(a)
a<-table.element(a,'alpha',header=TRUE)
a<-table.element(a,lnlm1$coefficients[[1]])
a<-table.row.end(a)
a<-table.row.start(a)
a<-table.element(a,'beta',header=TRUE)
a<-table.element(a,lnlm1$coefficients[[2]])
a<-table.row.end(a)
a<-table.row.start(a)
a<-table.element(a,'S.D.',header=TRUE)
a<-table.element(a,summary(lnlm1)$coefficients[2,2])
a<-table.row.end(a)
a<-table.row.start(a)
a<-table.element(a,'T-STAT',header=TRUE)
a<-table.element(a,summary(lnlm1)$coefficients[2,3])
a<-table.row.end(a)
a<-table.row.start(a)
a<-table.element(a,'p-value',header=TRUE)
a<-table.element(a,summary(lnlm1)$coefficients[2,4])
a<-table.row.end(a)
a<-table.row.start(a)
a<-table.element(a,'Lambda',header=TRUE)
a<-table.element(a,1-lnlm1$coefficients[[2]])
a<-table.row.end(a)
a<-table.end(a)
table.save(a,file='mytable2.tab')