Free Statistics
of Irreproducible Research!
Description of Statistical Computation | |||||||||||||||||||||||||||||||||
|---|---|---|---|---|---|---|---|---|---|---|---|---|---|---|---|---|---|---|---|---|---|---|---|---|---|---|---|---|---|---|---|---|---|
| Author's title | |||||||||||||||||||||||||||||||||
| Author | *The author of this computation has been verified* | ||||||||||||||||||||||||||||||||
| R Software Module | rwasp_meanversusmedian.wasp | ||||||||||||||||||||||||||||||||
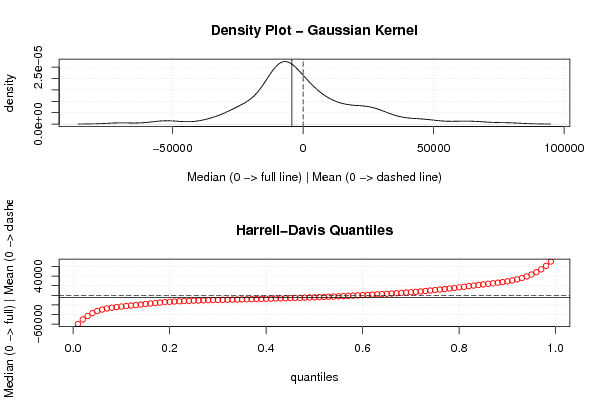
| Title produced by software | Mean versus Median | ||||||||||||||||||||||||||||||||
| Date of computation | Thu, 22 Dec 2011 04:05:09 -0500 | ||||||||||||||||||||||||||||||||
| Cite this page as follows | Statistical Computations at FreeStatistics.org, Office for Research Development and Education, URL https://freestatistics.org/blog/index.php?v=date/2011/Dec/22/t1324544770fz6pjf2ptxpwjrr.htm/, Retrieved Fri, 03 May 2024 13:08:44 +0000 | ||||||||||||||||||||||||||||||||
| Statistical Computations at FreeStatistics.org, Office for Research Development and Education, URL https://freestatistics.org/blog/index.php?pk=159188, Retrieved Fri, 03 May 2024 13:08:44 +0000 | |||||||||||||||||||||||||||||||||
| QR Codes: | |||||||||||||||||||||||||||||||||
|
| |||||||||||||||||||||||||||||||||
| Original text written by user: | |||||||||||||||||||||||||||||||||
| IsPrivate? | No (this computation is public) | ||||||||||||||||||||||||||||||||
| User-defined keywords | |||||||||||||||||||||||||||||||||
| Estimated Impact | 136 | ||||||||||||||||||||||||||||||||
Tree of Dependent Computations | |||||||||||||||||||||||||||||||||
| Family? (F = Feedback message, R = changed R code, M = changed R Module, P = changed Parameters, D = changed Data) | |||||||||||||||||||||||||||||||||
| - [Mean versus Median] [Paper, MR, mean v...] [2011-12-22 09:05:09] [242bbde8f74d68805b56d9ecebfdbe63] [Current] - R D [Mean versus Median] [mean vs median] [2011-12-22 17:36:31] [74be16979710d4c4e7c6647856088456] - MP [Mean versus Median] [mean vs median] [2011-12-22 17:37:34] [f1aa04283d83c25edc8ae3bb0d0fb93e] - R D [Mean versus Median] [mean vs median] [2011-12-23 08:10:53] [74be16979710d4c4e7c6647856088456] | |||||||||||||||||||||||||||||||||
| Feedback Forum | |||||||||||||||||||||||||||||||||
Post a new message | |||||||||||||||||||||||||||||||||
Dataset | |||||||||||||||||||||||||||||||||
| Dataseries X: | |||||||||||||||||||||||||||||||||
30284.1995330302 1752.66929294338 -14129.5830379121 -25318.5960880854 -22492.2765764208 -38600.2100271515 -6373.89184935605 -8946.31776441532 -6380.69329641039 39056.7930818296 -15156.7139759921 -4391.87830689984 -31634.8069614461 -5917.40897375979 21634.4710215375 12301.9586344988 -24192.5368123481 169.808985391398 -52955.7749462876 -24500.8775203974 -22160.8962622259 -18025.3595489005 58837.1784736426 -25367.242182663 -2298.98889995109 25611.5905317178 -5479.01945472296 -12408.3692028427 67555.3519263282 9235.98743178649 26431.3075824796 25190.7418692401 -11031.3066712822 43692.91477409 -7727.56355521307 -9526.41795391828 47788.2730888341 -15482.2997353988 -6335.34839005415 -5389.48332992871 17465.0849288859 -8339.20148865928 -2441.47079931885 2344.04207759026 -3823.21393199353 19781.7141833722 -3307.43980933547 33111.3593606876 -10106.9243450377 -8770.68811280777 -5781.15209026461 -6602.46524103765 49682.4913175866 62988.0637266148 16465.5548997083 -8647.69703575041 43151.1859137599 -9351.9690821716 -11364.4691931812 22130.3313526832 1081.61122212154 -32317.6796134832 13547.966080393 -6155.48141394448 24764.6675946399 -25459.8960140223 -49651.4186514212 -54314.5442890259 -7342.09878518566 -914.183301874799 18500.0596317631 6253.53264677315 -12951.8515166559 8646.69143670036 -34307.5314083708 -16185.2453504075 -29373.3497753635 -69845.3797964989 -8778.153655284 -11793.3358945391 -11428.7206364529 78527.4430964136 -11837.0471804685 -12241.5829786871 -12366.3861390385 4201.38165815732 -19818.6863575957 -21596.6681194523 2198.91545346288 4603.51826000927 -12355.9177373286 -22531.0875916805 21190.6639591245 12764.5589663764 -17804.9125391155 4313.29989158728 29058.0072362883 -8324.40211223558 25097.8618251515 -4569.97339362053 7185.47140386885 -18849.674134691 27117.593708477 2977.13706381936 -2378.52481395662 -9226.53079265632 -7697.43961891371 33300.1047514616 -9345.53773591229 4579.49753281931 -1631.51816125261 4594.45067474066 -2396.29675946105 -2960.41270507962 -9610.81510066239 -9345.53773591229 34289.0307927286 -604.218281922242 7134.08817435033 9768.56428191791 -206.89691005615 2928.19775444985 4633.45252364034 14549.4918096003 14131.1877427585 -10502.107816016 -9169.79570858865 13667.0425581965 9998.78746846316 -8697.36103383159 -3928.80200550174 22330.4564952321 -4194.39482797022 27854.7425421878 -6125.79868816608 2946.70107361665 -9345.53773591229 12636.9680924209 -22926.1291497626 -5082.8502405434 -12518.3305018768 -757.682801905738 923.141727663306 -6431.08115376762 | |||||||||||||||||||||||||||||||||
Tables (Output of Computation) | |||||||||||||||||||||||||||||||||
| |||||||||||||||||||||||||||||||||
Figures (Output of Computation) | |||||||||||||||||||||||||||||||||
Input Parameters & R Code | |||||||||||||||||||||||||||||||||
| Parameters (Session): | |||||||||||||||||||||||||||||||||
| Parameters (R input): | |||||||||||||||||||||||||||||||||
| R code (references can be found in the software module): | |||||||||||||||||||||||||||||||||
library(Hmisc) | |||||||||||||||||||||||||||||||||