Free Statistics

of Irreproducible Research!

Author's title

Author*The author of this computation has been verified*
R Software Modulerwasp_multipleregression.wasp
Title produced by softwareMultiple Regression
Date of computationWed, 21 Dec 2011 14:09:04 -0500
Cite this page as followsStatistical Computations at FreeStatistics.org, Office for Research Development and Education, URL https://freestatistics.org/blog/index.php?v=date/2011/Dec/21/t1324494667k10s71q0b6jk2ku.htm/, Retrieved Tue, 07 May 2024 16:04:18 +0000
Statistical Computations at FreeStatistics.org, Office for Research Development and Education, URL https://freestatistics.org/blog/index.php?pk=158959, Retrieved Tue, 07 May 2024 16:04:18 +0000
QR Codes:

Original text written by user:
IsPrivate?No (this computation is public)
User-defined keywords
Estimated Impact75
Family? (F = Feedback message, R = changed R code, M = changed R Module, P = changed Parameters, D = changed Data)
-     [Cronbach Alpha] [Intrinsic Motivat...] [2010-10-12 11:46:14] [b98453cac15ba1066b407e146608df68]
- RM D  [Random Number Generator - Log-Normal Distribution] [] [2011-10-18 15:45:21] [493236dcc414c5f9e1823f06b33a5ad6]
- RMPD      [Multiple Regression] [] [2011-12-21 19:09:04] [75a32e1bc492240bc1028714aca23077] [Current]
Feedback Forum

Post a new message
Dataseries X:
1.0622	2.1	8.93	2.5974	5.8
1.0773	2.4	8.96	2.9809	5.9
1.0807	2.5	8.99	3.0201	5.9
1.0848	2.1	8.98	2.2247	6
1.1582	1.8	9	2.0578	6.1
1.1663	1.9	9.03	2.1123	6.3
1.1372	1.9	9.02	2.1099	6.2
1.1139	2.1	9	2.1583	6.1
1.1222	2.2	9.03	2.3204	6.1
1.1692	2	9.03	2.0408	6
1.1702	2.2	9.03	1.765	5.8
1.2286	2	9.07	1.8795	5.7
1.2613	1.9	9.15	1.9263	5.7
1.2646	1.6	9.1	1.6931	5.6
1.2262	1.7	9.15	1.7372	5.8
1.1985	2	9.15	2.2851	5.6
1.2007	2.5	9.22	3.0518	5.6
1.2138	2.4	9.22	3.2662	5.6
1.2266	2.3	9.24	2.9908	5.5
1.2176	2.3	9.26	2.6544	5.4
1.2218	2.1	9.3	2.5378	5.4
1.249	2.4	9.27	3.1892	5.5
1.2991	2.2	9.32	3.523	5.4
1.3408	2.4	9.33	3.2556	5.4
1.3119	1.9	9.32	2.9698	5.3
1.3014	2.1	9.34	3.0075	5.4
1.3201	2.1	9.32	3.1483	5.2
1.2938	2.1	9.32	3.5106	5.2
1.2694	2	9.24	2.8027	5.1
1.2165	2.1	9.24	2.5303	5
1.2037	2.2	9.15	3.1679	5
1.2292	2.2	9.17	3.6412	4.9
1.2256	2.6	9.14	4.6867	5
1.2015	2.5	9.11	4.3478	5
1.1786	2.3	9.04	3.4555	5
1.1856	2.2	8.96	3.4157	4.9
1.2103	2.4	8.86	3.9853	4.7
1.1938	2.3	8.85	3.5975	4.8
1.202	2.2	8.75	3.3626	4.7
1.2271	2.5	8.65	3.5457	4.7
1.277	2.5	8.61	4.1667	4.6
1.265	2.5	8.46	4.3188	4.6
1.2684	2.4	8.38	4.1453	4.7
1.2811	2.3	8.33	3.8187	4.7
1.2727	1.7	8.27	2.0624	4.5
1.2611	1.6	8.21	1.3052	4.4
1.2881	1.9	8.18	1.9737	4.5
1.3213	1.9	8.04	2.5407	4.4
1.2999	1.8	7.97	2.0756	4.6
1.3074	1.8	7.86	2.4152	4.5
1.3242	1.9	7.75	2.7788	4.4
1.3516	1.9	7.65	2.5737	4.5
1.3511	1.9	7.62	2.6909	4.4
1.3419	1.9	7.55	2.687	4.6
1.3716	1.8	7.6	2.3582	4.7
1.3622	1.7	7.54	1.9701	4.6
1.3896	2.1	7.48	2.7551	4.7
1.4227	2.6	7.44	3.5362	4.7
1.4684	3.1	7.41	4.3062	4.7
1.457	3.1	7.45	4.0813	5


Summary of computational transaction
Raw Inputview raw input (R code)
Raw Outputview raw output of R engine
Computing time4 seconds
R Server'AstonUniversity' @ aston.wessa.net

\begin{tabular}{lllllllll}
\hline
Summary of computational transaction \tabularnewline
Raw Input & view raw input (R code)  \tabularnewline
Raw Output & view raw output of R engine  \tabularnewline
Computing time & 4 seconds \tabularnewline
R Server & 'AstonUniversity' @ aston.wessa.net \tabularnewline
\hline
\end{tabular}
%Source: https://freestatistics.org/blog/index.php?pk=158959&T=0

[TABLE]
[ROW][C]Summary of computational transaction[/C][/ROW]
[ROW][C]Raw Input[/C][C]view raw input (R code) [/C][/ROW]
[ROW][C]Raw Output[/C][C]view raw output of R engine [/C][/ROW]
[ROW][C]Computing time[/C][C]4 seconds[/C][/ROW]
[ROW][C]R Server[/C][C]'AstonUniversity' @ aston.wessa.net[/C][/ROW]
[/TABLE]
Source: https://freestatistics.org/blog/index.php?pk=158959&T=0

Globally Unique Identifier (entire table): ba.freestatistics.org/blog/index.php?pk=158959&T=0

As an alternative you can also use a QR Code:  

The GUIDs for individual cells are displayed in the table below:

Summary of computational transaction
Raw Inputview raw input (R code)
Raw Outputview raw output of R engine
Computing time4 seconds
R Server'AstonUniversity' @ aston.wessa.net


Multiple Linear Regression - Estimated Regression Equation
Dollar/Euro[t] = + 2.01861062029043 + 0.0147026940524336`Inf-Eu`[t] -0.0586567406048217`Werkl-Eu`[t] + 0.00436724045623842`Inf-USA`[t] -0.0587101388833743`Werkl-USA`[t] + e[t]

\begin{tabular}{lllllllll}
\hline
Multiple Linear Regression - Estimated Regression Equation \tabularnewline
Dollar/Euro[t] =  +  2.01861062029043 +  0.0147026940524336`Inf-Eu`[t] -0.0586567406048217`Werkl-Eu`[t] +  0.00436724045623842`Inf-USA`[t] -0.0587101388833743`Werkl-USA`[t]  + e[t] \tabularnewline
\hline
\end{tabular}
%Source: https://freestatistics.org/blog/index.php?pk=158959&T=1

[TABLE]
[ROW][C]Multiple Linear Regression - Estimated Regression Equation[/C][/ROW]
[ROW][C]Dollar/Euro[t] =  +  2.01861062029043 +  0.0147026940524336`Inf-Eu`[t] -0.0586567406048217`Werkl-Eu`[t] +  0.00436724045623842`Inf-USA`[t] -0.0587101388833743`Werkl-USA`[t]  + e[t][/C][/ROW]
[/TABLE]
Source: https://freestatistics.org/blog/index.php?pk=158959&T=1

Globally Unique Identifier (entire table): ba.freestatistics.org/blog/index.php?pk=158959&T=1

As an alternative you can also use a QR Code:  

The GUIDs for individual cells are displayed in the table below:

Multiple Linear Regression - Estimated Regression Equation
Dollar/Euro[t] = + 2.01861062029043 + 0.0147026940524336`Inf-Eu`[t] -0.0586567406048217`Werkl-Eu`[t] + 0.00436724045623842`Inf-USA`[t] -0.0587101388833743`Werkl-USA`[t] + e[t]


Multiple Linear Regression - Ordinary Least Squares
VariableParameterS.D.T-STATH0: parameter = 02-tail p-value1-tail p-value
(Intercept)2.018610620290430.12903815.643500
`Inf-Eu`0.01470269405243360.0548380.26810.7896170.394808
`Werkl-Eu`-0.05865674060482170.020246-2.89720.0053950.002697
`Inf-USA`0.004367240456238420.024290.17980.8579740.428987
`Werkl-USA`-0.05871013888337430.0271-2.16650.0346260.017313

\begin{tabular}{lllllllll}
\hline
Multiple Linear Regression - Ordinary Least Squares \tabularnewline
Variable & Parameter & S.D. & T-STATH0: parameter = 0 & 2-tail p-value & 1-tail p-value \tabularnewline
(Intercept) & 2.01861062029043 & 0.129038 & 15.6435 & 0 & 0 \tabularnewline
`Inf-Eu` & 0.0147026940524336 & 0.054838 & 0.2681 & 0.789617 & 0.394808 \tabularnewline
`Werkl-Eu` & -0.0586567406048217 & 0.020246 & -2.8972 & 0.005395 & 0.002697 \tabularnewline
`Inf-USA` & 0.00436724045623842 & 0.02429 & 0.1798 & 0.857974 & 0.428987 \tabularnewline
`Werkl-USA` & -0.0587101388833743 & 0.0271 & -2.1665 & 0.034626 & 0.017313 \tabularnewline
\hline
\end{tabular}
%Source: https://freestatistics.org/blog/index.php?pk=158959&T=2

[TABLE]
[ROW][C]Multiple Linear Regression - Ordinary Least Squares[/C][/ROW]
[ROW][C]Variable[/C][C]Parameter[/C][C]S.D.[/C][C]T-STATH0: parameter = 0[/C][C]2-tail p-value[/C][C]1-tail p-value[/C][/ROW]
[ROW][C](Intercept)[/C][C]2.01861062029043[/C][C]0.129038[/C][C]15.6435[/C][C]0[/C][C]0[/C][/ROW]
[ROW][C]`Inf-Eu`[/C][C]0.0147026940524336[/C][C]0.054838[/C][C]0.2681[/C][C]0.789617[/C][C]0.394808[/C][/ROW]
[ROW][C]`Werkl-Eu`[/C][C]-0.0586567406048217[/C][C]0.020246[/C][C]-2.8972[/C][C]0.005395[/C][C]0.002697[/C][/ROW]
[ROW][C]`Inf-USA`[/C][C]0.00436724045623842[/C][C]0.02429[/C][C]0.1798[/C][C]0.857974[/C][C]0.428987[/C][/ROW]
[ROW][C]`Werkl-USA`[/C][C]-0.0587101388833743[/C][C]0.0271[/C][C]-2.1665[/C][C]0.034626[/C][C]0.017313[/C][/ROW]
[/TABLE]
Source: https://freestatistics.org/blog/index.php?pk=158959&T=2

Globally Unique Identifier (entire table): ba.freestatistics.org/blog/index.php?pk=158959&T=2

As an alternative you can also use a QR Code:  

The GUIDs for individual cells are displayed in the table below:

Multiple Linear Regression - Ordinary Least Squares
VariableParameterS.D.T-STATH0: parameter = 02-tail p-value1-tail p-value
(Intercept)2.018610620290430.12903815.643500
`Inf-Eu`0.01470269405243360.0548380.26810.7896170.394808
`Werkl-Eu`-0.05865674060482170.020246-2.89720.0053950.002697
`Inf-USA`0.004367240456238420.024290.17980.8579740.428987
`Werkl-USA`-0.05871013888337430.0271-2.16650.0346260.017313


Multiple Linear Regression - Regression Statistics
Multiple R0.72754748106061
R-squared0.52932533719764
Adjusted R-squared0.495094452630195
F-TEST (value)15.4633847148975
F-TEST (DF numerator)4
F-TEST (DF denominator)55
p-value1.55500919918339e-08
Multiple Linear Regression - Residual Statistics
Residual Standard Deviation0.0635414612194941
Sum Squared Residuals0.222063451164966

\begin{tabular}{lllllllll}
\hline
Multiple Linear Regression - Regression Statistics \tabularnewline
Multiple R & 0.72754748106061 \tabularnewline
R-squared & 0.52932533719764 \tabularnewline
Adjusted R-squared & 0.495094452630195 \tabularnewline
F-TEST (value) & 15.4633847148975 \tabularnewline
F-TEST (DF numerator) & 4 \tabularnewline
F-TEST (DF denominator) & 55 \tabularnewline
p-value & 1.55500919918339e-08 \tabularnewline
Multiple Linear Regression - Residual Statistics \tabularnewline
Residual Standard Deviation & 0.0635414612194941 \tabularnewline
Sum Squared Residuals & 0.222063451164966 \tabularnewline
\hline
\end{tabular}
%Source: https://freestatistics.org/blog/index.php?pk=158959&T=3

[TABLE]
[ROW][C]Multiple Linear Regression - Regression Statistics[/C][/ROW]
[ROW][C]Multiple R[/C][C]0.72754748106061[/C][/ROW]
[ROW][C]R-squared[/C][C]0.52932533719764[/C][/ROW]
[ROW][C]Adjusted R-squared[/C][C]0.495094452630195[/C][/ROW]
[ROW][C]F-TEST (value)[/C][C]15.4633847148975[/C][/ROW]
[ROW][C]F-TEST (DF numerator)[/C][C]4[/C][/ROW]
[ROW][C]F-TEST (DF denominator)[/C][C]55[/C][/ROW]
[ROW][C]p-value[/C][C]1.55500919918339e-08[/C][/ROW]
[ROW][C]Multiple Linear Regression - Residual Statistics[/C][/ROW]
[ROW][C]Residual Standard Deviation[/C][C]0.0635414612194941[/C][/ROW]
[ROW][C]Sum Squared Residuals[/C][C]0.222063451164966[/C][/ROW]
[/TABLE]
Source: https://freestatistics.org/blog/index.php?pk=158959&T=3

Globally Unique Identifier (entire table): ba.freestatistics.org/blog/index.php?pk=158959&T=3

As an alternative you can also use a QR Code:  

The GUIDs for individual cells are displayed in the table below:

Multiple Linear Regression - Regression Statistics
Multiple R0.72754748106061
R-squared0.52932533719764
Adjusted R-squared0.495094452630195
F-TEST (value)15.4633847148975
F-TEST (DF numerator)4
F-TEST (DF denominator)55
p-value1.55500919918339e-08
Multiple Linear Regression - Residual Statistics
Residual Standard Deviation0.0635414612194941
Sum Squared Residuals0.222063451164966


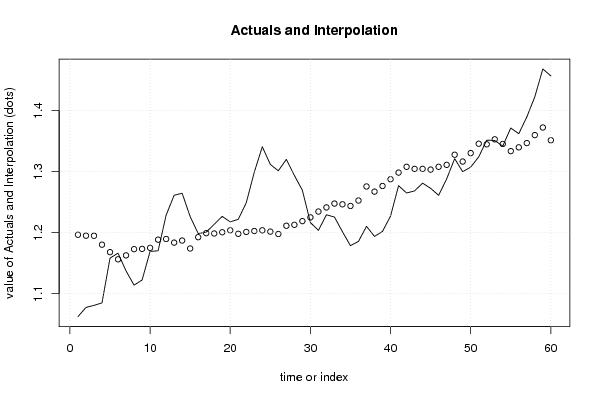
Multiple Linear Regression - Actuals, Interpolation, and Residuals
Time or IndexActualsInterpolationForecastResidualsPrediction Error
11.06221.19650624903695-0.134306249036947
21.07731.19496117786116-0.11766117786116
31.08071.19484294087414-0.114142940874143
41.08481.18020371371199-0.0954037137119885
51.15821.16801986436368-0.00981986436367845
61.16631.156226418378970.0100735816210326
71.13721.16267351829626-0.0254735182962579
81.11391.17286958024526-0.0589695802452605
91.12221.17328807711032-0.0510880771103153
101.16921.1749974717566-0.0057974717566018
111.17021.18847555342593-0.018275553425933
121.22861.189559807911830.03904019208817
131.26131.183601386111550.0776986138884473
141.26461.186975988340010.0776240116599935
151.22621.173963988242450.052236011757546
161.19851.192509635280830.00599036471916796
171.20071.199103373722510.00159662627749088
181.21381.198569440671080.0152305593289166
191.22661.200594312320430.026005687679567
201.21761.20382305170720.0137769482928047
211.22181.198027023035320.0237729769646817
221.2491.201171340014050.0478286599859507
231.29911.202626762925950.0964732370740486
241.34081.203812934232390.136987065767608
251.31191.201671011178170.110228988821832
261.30141.197732046253420.103667953746579
271.32011.211262116298430.10883788370157
281.29381.212844367515730.0809556324842746
291.26941.218846081728230.050553918271766
301.21651.22499772872154-0.00849772872153563
311.20371.23453165729611-0.0308316572961105
321.22921.24129655128029-0.012096551280289
331.22561.24763226712807-0.022032267128067
341.20151.24644164215035-0.0449416421503492
351.17861.2437101865231-0.0651101865230984
361.18561.25262965408442-0.0670296540844199
371.21031.27566547489594-0.0653654748959372
381.19381.26721714315948-0.0734171431594753
391.2021.27645769691988-0.0744576969198811
401.22711.28753382092363-0.0604338209236305
411.2771.29846316075948-0.0214631607594851
421.2651.3079259291236-0.0429259291236021
431.26841.30451946885925-0.0361194688592496
441.28111.30455569575124-0.02345569575124
451.27271.30332532711945-0.0306253271194524
461.26111.30793860156537-0.0468386015653718
471.28811.3111575983559-0.0230575983559046
481.32131.3277167812676-0.0064167812676044
491.29991.31657925239183-0.0166792523918271
501.30741.33038562260563-0.0229856226056336
511.32421.34576707599563-0.0215670759956329
521.35161.34486601515020.00673398484979675
531.35111.35300857183816-0.00190857183815641
541.34191.34535548366604-0.00345548366603967
551.37161.333645414680210.0379545853197933
561.36221.339870637578520.0223293624214762
571.38961.34682838950560.0427716104944036
581.42271.359937257676370.0627627423236262
591.46841.372411082072040.095988917927961
601.4571.351469578404230.105530421595774

\begin{tabular}{lllllllll}
\hline
Multiple Linear Regression - Actuals, Interpolation, and Residuals \tabularnewline
Time or Index & Actuals & InterpolationForecast & ResidualsPrediction Error \tabularnewline
1 & 1.0622 & 1.19650624903695 & -0.134306249036947 \tabularnewline
2 & 1.0773 & 1.19496117786116 & -0.11766117786116 \tabularnewline
3 & 1.0807 & 1.19484294087414 & -0.114142940874143 \tabularnewline
4 & 1.0848 & 1.18020371371199 & -0.0954037137119885 \tabularnewline
5 & 1.1582 & 1.16801986436368 & -0.00981986436367845 \tabularnewline
6 & 1.1663 & 1.15622641837897 & 0.0100735816210326 \tabularnewline
7 & 1.1372 & 1.16267351829626 & -0.0254735182962579 \tabularnewline
8 & 1.1139 & 1.17286958024526 & -0.0589695802452605 \tabularnewline
9 & 1.1222 & 1.17328807711032 & -0.0510880771103153 \tabularnewline
10 & 1.1692 & 1.1749974717566 & -0.0057974717566018 \tabularnewline
11 & 1.1702 & 1.18847555342593 & -0.018275553425933 \tabularnewline
12 & 1.2286 & 1.18955980791183 & 0.03904019208817 \tabularnewline
13 & 1.2613 & 1.18360138611155 & 0.0776986138884473 \tabularnewline
14 & 1.2646 & 1.18697598834001 & 0.0776240116599935 \tabularnewline
15 & 1.2262 & 1.17396398824245 & 0.052236011757546 \tabularnewline
16 & 1.1985 & 1.19250963528083 & 0.00599036471916796 \tabularnewline
17 & 1.2007 & 1.19910337372251 & 0.00159662627749088 \tabularnewline
18 & 1.2138 & 1.19856944067108 & 0.0152305593289166 \tabularnewline
19 & 1.2266 & 1.20059431232043 & 0.026005687679567 \tabularnewline
20 & 1.2176 & 1.2038230517072 & 0.0137769482928047 \tabularnewline
21 & 1.2218 & 1.19802702303532 & 0.0237729769646817 \tabularnewline
22 & 1.249 & 1.20117134001405 & 0.0478286599859507 \tabularnewline
23 & 1.2991 & 1.20262676292595 & 0.0964732370740486 \tabularnewline
24 & 1.3408 & 1.20381293423239 & 0.136987065767608 \tabularnewline
25 & 1.3119 & 1.20167101117817 & 0.110228988821832 \tabularnewline
26 & 1.3014 & 1.19773204625342 & 0.103667953746579 \tabularnewline
27 & 1.3201 & 1.21126211629843 & 0.10883788370157 \tabularnewline
28 & 1.2938 & 1.21284436751573 & 0.0809556324842746 \tabularnewline
29 & 1.2694 & 1.21884608172823 & 0.050553918271766 \tabularnewline
30 & 1.2165 & 1.22499772872154 & -0.00849772872153563 \tabularnewline
31 & 1.2037 & 1.23453165729611 & -0.0308316572961105 \tabularnewline
32 & 1.2292 & 1.24129655128029 & -0.012096551280289 \tabularnewline
33 & 1.2256 & 1.24763226712807 & -0.022032267128067 \tabularnewline
34 & 1.2015 & 1.24644164215035 & -0.0449416421503492 \tabularnewline
35 & 1.1786 & 1.2437101865231 & -0.0651101865230984 \tabularnewline
36 & 1.1856 & 1.25262965408442 & -0.0670296540844199 \tabularnewline
37 & 1.2103 & 1.27566547489594 & -0.0653654748959372 \tabularnewline
38 & 1.1938 & 1.26721714315948 & -0.0734171431594753 \tabularnewline
39 & 1.202 & 1.27645769691988 & -0.0744576969198811 \tabularnewline
40 & 1.2271 & 1.28753382092363 & -0.0604338209236305 \tabularnewline
41 & 1.277 & 1.29846316075948 & -0.0214631607594851 \tabularnewline
42 & 1.265 & 1.3079259291236 & -0.0429259291236021 \tabularnewline
43 & 1.2684 & 1.30451946885925 & -0.0361194688592496 \tabularnewline
44 & 1.2811 & 1.30455569575124 & -0.02345569575124 \tabularnewline
45 & 1.2727 & 1.30332532711945 & -0.0306253271194524 \tabularnewline
46 & 1.2611 & 1.30793860156537 & -0.0468386015653718 \tabularnewline
47 & 1.2881 & 1.3111575983559 & -0.0230575983559046 \tabularnewline
48 & 1.3213 & 1.3277167812676 & -0.0064167812676044 \tabularnewline
49 & 1.2999 & 1.31657925239183 & -0.0166792523918271 \tabularnewline
50 & 1.3074 & 1.33038562260563 & -0.0229856226056336 \tabularnewline
51 & 1.3242 & 1.34576707599563 & -0.0215670759956329 \tabularnewline
52 & 1.3516 & 1.3448660151502 & 0.00673398484979675 \tabularnewline
53 & 1.3511 & 1.35300857183816 & -0.00190857183815641 \tabularnewline
54 & 1.3419 & 1.34535548366604 & -0.00345548366603967 \tabularnewline
55 & 1.3716 & 1.33364541468021 & 0.0379545853197933 \tabularnewline
56 & 1.3622 & 1.33987063757852 & 0.0223293624214762 \tabularnewline
57 & 1.3896 & 1.3468283895056 & 0.0427716104944036 \tabularnewline
58 & 1.4227 & 1.35993725767637 & 0.0627627423236262 \tabularnewline
59 & 1.4684 & 1.37241108207204 & 0.095988917927961 \tabularnewline
60 & 1.457 & 1.35146957840423 & 0.105530421595774 \tabularnewline
\hline
\end{tabular}
%Source: https://freestatistics.org/blog/index.php?pk=158959&T=4

[TABLE]
[ROW][C]Multiple Linear Regression - Actuals, Interpolation, and Residuals[/C][/ROW]
[ROW][C]Time or Index[/C][C]Actuals[/C][C]InterpolationForecast[/C][C]ResidualsPrediction Error[/C][/ROW]
[ROW][C]1[/C][C]1.0622[/C][C]1.19650624903695[/C][C]-0.134306249036947[/C][/ROW]
[ROW][C]2[/C][C]1.0773[/C][C]1.19496117786116[/C][C]-0.11766117786116[/C][/ROW]
[ROW][C]3[/C][C]1.0807[/C][C]1.19484294087414[/C][C]-0.114142940874143[/C][/ROW]
[ROW][C]4[/C][C]1.0848[/C][C]1.18020371371199[/C][C]-0.0954037137119885[/C][/ROW]
[ROW][C]5[/C][C]1.1582[/C][C]1.16801986436368[/C][C]-0.00981986436367845[/C][/ROW]
[ROW][C]6[/C][C]1.1663[/C][C]1.15622641837897[/C][C]0.0100735816210326[/C][/ROW]
[ROW][C]7[/C][C]1.1372[/C][C]1.16267351829626[/C][C]-0.0254735182962579[/C][/ROW]
[ROW][C]8[/C][C]1.1139[/C][C]1.17286958024526[/C][C]-0.0589695802452605[/C][/ROW]
[ROW][C]9[/C][C]1.1222[/C][C]1.17328807711032[/C][C]-0.0510880771103153[/C][/ROW]
[ROW][C]10[/C][C]1.1692[/C][C]1.1749974717566[/C][C]-0.0057974717566018[/C][/ROW]
[ROW][C]11[/C][C]1.1702[/C][C]1.18847555342593[/C][C]-0.018275553425933[/C][/ROW]
[ROW][C]12[/C][C]1.2286[/C][C]1.18955980791183[/C][C]0.03904019208817[/C][/ROW]
[ROW][C]13[/C][C]1.2613[/C][C]1.18360138611155[/C][C]0.0776986138884473[/C][/ROW]
[ROW][C]14[/C][C]1.2646[/C][C]1.18697598834001[/C][C]0.0776240116599935[/C][/ROW]
[ROW][C]15[/C][C]1.2262[/C][C]1.17396398824245[/C][C]0.052236011757546[/C][/ROW]
[ROW][C]16[/C][C]1.1985[/C][C]1.19250963528083[/C][C]0.00599036471916796[/C][/ROW]
[ROW][C]17[/C][C]1.2007[/C][C]1.19910337372251[/C][C]0.00159662627749088[/C][/ROW]
[ROW][C]18[/C][C]1.2138[/C][C]1.19856944067108[/C][C]0.0152305593289166[/C][/ROW]
[ROW][C]19[/C][C]1.2266[/C][C]1.20059431232043[/C][C]0.026005687679567[/C][/ROW]
[ROW][C]20[/C][C]1.2176[/C][C]1.2038230517072[/C][C]0.0137769482928047[/C][/ROW]
[ROW][C]21[/C][C]1.2218[/C][C]1.19802702303532[/C][C]0.0237729769646817[/C][/ROW]
[ROW][C]22[/C][C]1.249[/C][C]1.20117134001405[/C][C]0.0478286599859507[/C][/ROW]
[ROW][C]23[/C][C]1.2991[/C][C]1.20262676292595[/C][C]0.0964732370740486[/C][/ROW]
[ROW][C]24[/C][C]1.3408[/C][C]1.20381293423239[/C][C]0.136987065767608[/C][/ROW]
[ROW][C]25[/C][C]1.3119[/C][C]1.20167101117817[/C][C]0.110228988821832[/C][/ROW]
[ROW][C]26[/C][C]1.3014[/C][C]1.19773204625342[/C][C]0.103667953746579[/C][/ROW]
[ROW][C]27[/C][C]1.3201[/C][C]1.21126211629843[/C][C]0.10883788370157[/C][/ROW]
[ROW][C]28[/C][C]1.2938[/C][C]1.21284436751573[/C][C]0.0809556324842746[/C][/ROW]
[ROW][C]29[/C][C]1.2694[/C][C]1.21884608172823[/C][C]0.050553918271766[/C][/ROW]
[ROW][C]30[/C][C]1.2165[/C][C]1.22499772872154[/C][C]-0.00849772872153563[/C][/ROW]
[ROW][C]31[/C][C]1.2037[/C][C]1.23453165729611[/C][C]-0.0308316572961105[/C][/ROW]
[ROW][C]32[/C][C]1.2292[/C][C]1.24129655128029[/C][C]-0.012096551280289[/C][/ROW]
[ROW][C]33[/C][C]1.2256[/C][C]1.24763226712807[/C][C]-0.022032267128067[/C][/ROW]
[ROW][C]34[/C][C]1.2015[/C][C]1.24644164215035[/C][C]-0.0449416421503492[/C][/ROW]
[ROW][C]35[/C][C]1.1786[/C][C]1.2437101865231[/C][C]-0.0651101865230984[/C][/ROW]
[ROW][C]36[/C][C]1.1856[/C][C]1.25262965408442[/C][C]-0.0670296540844199[/C][/ROW]
[ROW][C]37[/C][C]1.2103[/C][C]1.27566547489594[/C][C]-0.0653654748959372[/C][/ROW]
[ROW][C]38[/C][C]1.1938[/C][C]1.26721714315948[/C][C]-0.0734171431594753[/C][/ROW]
[ROW][C]39[/C][C]1.202[/C][C]1.27645769691988[/C][C]-0.0744576969198811[/C][/ROW]
[ROW][C]40[/C][C]1.2271[/C][C]1.28753382092363[/C][C]-0.0604338209236305[/C][/ROW]
[ROW][C]41[/C][C]1.277[/C][C]1.29846316075948[/C][C]-0.0214631607594851[/C][/ROW]
[ROW][C]42[/C][C]1.265[/C][C]1.3079259291236[/C][C]-0.0429259291236021[/C][/ROW]
[ROW][C]43[/C][C]1.2684[/C][C]1.30451946885925[/C][C]-0.0361194688592496[/C][/ROW]
[ROW][C]44[/C][C]1.2811[/C][C]1.30455569575124[/C][C]-0.02345569575124[/C][/ROW]
[ROW][C]45[/C][C]1.2727[/C][C]1.30332532711945[/C][C]-0.0306253271194524[/C][/ROW]
[ROW][C]46[/C][C]1.2611[/C][C]1.30793860156537[/C][C]-0.0468386015653718[/C][/ROW]
[ROW][C]47[/C][C]1.2881[/C][C]1.3111575983559[/C][C]-0.0230575983559046[/C][/ROW]
[ROW][C]48[/C][C]1.3213[/C][C]1.3277167812676[/C][C]-0.0064167812676044[/C][/ROW]
[ROW][C]49[/C][C]1.2999[/C][C]1.31657925239183[/C][C]-0.0166792523918271[/C][/ROW]
[ROW][C]50[/C][C]1.3074[/C][C]1.33038562260563[/C][C]-0.0229856226056336[/C][/ROW]
[ROW][C]51[/C][C]1.3242[/C][C]1.34576707599563[/C][C]-0.0215670759956329[/C][/ROW]
[ROW][C]52[/C][C]1.3516[/C][C]1.3448660151502[/C][C]0.00673398484979675[/C][/ROW]
[ROW][C]53[/C][C]1.3511[/C][C]1.35300857183816[/C][C]-0.00190857183815641[/C][/ROW]
[ROW][C]54[/C][C]1.3419[/C][C]1.34535548366604[/C][C]-0.00345548366603967[/C][/ROW]
[ROW][C]55[/C][C]1.3716[/C][C]1.33364541468021[/C][C]0.0379545853197933[/C][/ROW]
[ROW][C]56[/C][C]1.3622[/C][C]1.33987063757852[/C][C]0.0223293624214762[/C][/ROW]
[ROW][C]57[/C][C]1.3896[/C][C]1.3468283895056[/C][C]0.0427716104944036[/C][/ROW]
[ROW][C]58[/C][C]1.4227[/C][C]1.35993725767637[/C][C]0.0627627423236262[/C][/ROW]
[ROW][C]59[/C][C]1.4684[/C][C]1.37241108207204[/C][C]0.095988917927961[/C][/ROW]
[ROW][C]60[/C][C]1.457[/C][C]1.35146957840423[/C][C]0.105530421595774[/C][/ROW]
[/TABLE]
Source: https://freestatistics.org/blog/index.php?pk=158959&T=4

Globally Unique Identifier (entire table): ba.freestatistics.org/blog/index.php?pk=158959&T=4

As an alternative you can also use a QR Code:  

The GUIDs for individual cells are displayed in the table below:

Multiple Linear Regression - Actuals, Interpolation, and Residuals
Time or IndexActualsInterpolationForecastResidualsPrediction Error
11.06221.19650624903695-0.134306249036947
21.07731.19496117786116-0.11766117786116
31.08071.19484294087414-0.114142940874143
41.08481.18020371371199-0.0954037137119885
51.15821.16801986436368-0.00981986436367845
61.16631.156226418378970.0100735816210326
71.13721.16267351829626-0.0254735182962579
81.11391.17286958024526-0.0589695802452605
91.12221.17328807711032-0.0510880771103153
101.16921.1749974717566-0.0057974717566018
111.17021.18847555342593-0.018275553425933
121.22861.189559807911830.03904019208817
131.26131.183601386111550.0776986138884473
141.26461.186975988340010.0776240116599935
151.22621.173963988242450.052236011757546
161.19851.192509635280830.00599036471916796
171.20071.199103373722510.00159662627749088
181.21381.198569440671080.0152305593289166
191.22661.200594312320430.026005687679567
201.21761.20382305170720.0137769482928047
211.22181.198027023035320.0237729769646817
221.2491.201171340014050.0478286599859507
231.29911.202626762925950.0964732370740486
241.34081.203812934232390.136987065767608
251.31191.201671011178170.110228988821832
261.30141.197732046253420.103667953746579
271.32011.211262116298430.10883788370157
281.29381.212844367515730.0809556324842746
291.26941.218846081728230.050553918271766
301.21651.22499772872154-0.00849772872153563
311.20371.23453165729611-0.0308316572961105
321.22921.24129655128029-0.012096551280289
331.22561.24763226712807-0.022032267128067
341.20151.24644164215035-0.0449416421503492
351.17861.2437101865231-0.0651101865230984
361.18561.25262965408442-0.0670296540844199
371.21031.27566547489594-0.0653654748959372
381.19381.26721714315948-0.0734171431594753
391.2021.27645769691988-0.0744576969198811
401.22711.28753382092363-0.0604338209236305
411.2771.29846316075948-0.0214631607594851
421.2651.3079259291236-0.0429259291236021
431.26841.30451946885925-0.0361194688592496
441.28111.30455569575124-0.02345569575124
451.27271.30332532711945-0.0306253271194524
461.26111.30793860156537-0.0468386015653718
471.28811.3111575983559-0.0230575983559046
481.32131.3277167812676-0.0064167812676044
491.29991.31657925239183-0.0166792523918271
501.30741.33038562260563-0.0229856226056336
511.32421.34576707599563-0.0215670759956329
521.35161.34486601515020.00673398484979675
531.35111.35300857183816-0.00190857183815641
541.34191.34535548366604-0.00345548366603967
551.37161.333645414680210.0379545853197933
561.36221.339870637578520.0223293624214762
571.38961.34682838950560.0427716104944036
581.42271.359937257676370.0627627423236262
591.46841.372411082072040.095988917927961
601.4571.351469578404230.105530421595774


Goldfeld-Quandt test for Heteroskedasticity
p-valuesAlternative Hypothesis
breakpoint indexgreater2-sidedless
80.02437541363090080.04875082726180160.9756245863691
90.007220531551459780.01444106310291960.99277946844854
100.006411460938326480.0128229218766530.993588539061674
110.006191740751941160.01238348150388230.993808259248059
120.002630382880159460.005260765760318930.99736961711984
130.005372292572671280.01074458514534260.994627707427329
140.001938947683898110.003877895367796230.998061052316102
150.0128142023447010.02562840468940210.987185797655299
160.01900290318316650.03800580636633310.980997096816833
170.01455728239168780.02911456478337560.985442717608312
180.01577257366914190.03154514733828390.984227426330858
190.01257622226522250.02515244453044510.987423777734778
200.0268394696985530.05367893939710590.973160530301447
210.1042532922432310.2085065844864620.895746707756769
220.1633713065169070.3267426130338130.836628693483093
230.1827495548420430.3654991096840860.817250445157957
240.3987199068044620.7974398136089250.601280093195538
250.3711790716689550.742358143337910.628820928331045
260.3119545275484730.6239090550969460.688045472451527
270.5045184287419370.9909631425161250.495481571258063
280.7509475178355320.4981049643289360.249052482164468
290.9407737546573610.1184524906852770.0592262453426386
300.973605234061350.05278953187729970.0263947659386499
310.9681171833482060.06376563330358850.0318828166517943
320.9976794770081720.004641045983655860.00232052299182793
330.999800570080150.0003988598396985670.000199429919849283
340.9998716723292080.0002566553415848580.000128327670792429
350.9997254324188240.0005491351623527450.000274567581176373
360.999606202330310.0007875953393822120.000393797669691106
370.9998213369857780.0003573260284449360.000178663014222468
380.9997468363841760.000506327231648630.000253163615824315
390.9997356744405930.0005286511188142350.000264325559407118
400.9999850636192952.98727614106847e-051.49363807053423e-05
410.9999974195298645.16094027225501e-062.58047013612751e-06
420.9999961463411567.70731768862185e-063.85365884431092e-06
430.999993431621.31367599984261e-056.56837999921303e-06
440.9999844769513953.10460972093965e-051.55230486046983e-05
450.9999518578078169.62843843682066e-054.81421921841033e-05
460.9998477686324480.0003044627351048010.000152231367552401
470.9995988462825840.0008023074348312520.000401153717415626
480.9998001818042030.0003996363915931610.000199818195796581
490.9992245299591510.001550940081697550.000775470040848774
500.997189946299340.005620107401318080.00281005370065904
510.990074859669750.01985028066050040.00992514033025018
520.96552811485440.06894377029119810.0344718851455991

\begin{tabular}{lllllllll}
\hline
Goldfeld-Quandt test for Heteroskedasticity \tabularnewline
p-values & Alternative Hypothesis \tabularnewline
breakpoint index & greater & 2-sided & less \tabularnewline
8 & 0.0243754136309008 & 0.0487508272618016 & 0.9756245863691 \tabularnewline
9 & 0.00722053155145978 & 0.0144410631029196 & 0.99277946844854 \tabularnewline
10 & 0.00641146093832648 & 0.012822921876653 & 0.993588539061674 \tabularnewline
11 & 0.00619174075194116 & 0.0123834815038823 & 0.993808259248059 \tabularnewline
12 & 0.00263038288015946 & 0.00526076576031893 & 0.99736961711984 \tabularnewline
13 & 0.00537229257267128 & 0.0107445851453426 & 0.994627707427329 \tabularnewline
14 & 0.00193894768389811 & 0.00387789536779623 & 0.998061052316102 \tabularnewline
15 & 0.012814202344701 & 0.0256284046894021 & 0.987185797655299 \tabularnewline
16 & 0.0190029031831665 & 0.0380058063663331 & 0.980997096816833 \tabularnewline
17 & 0.0145572823916878 & 0.0291145647833756 & 0.985442717608312 \tabularnewline
18 & 0.0157725736691419 & 0.0315451473382839 & 0.984227426330858 \tabularnewline
19 & 0.0125762222652225 & 0.0251524445304451 & 0.987423777734778 \tabularnewline
20 & 0.026839469698553 & 0.0536789393971059 & 0.973160530301447 \tabularnewline
21 & 0.104253292243231 & 0.208506584486462 & 0.895746707756769 \tabularnewline
22 & 0.163371306516907 & 0.326742613033813 & 0.836628693483093 \tabularnewline
23 & 0.182749554842043 & 0.365499109684086 & 0.817250445157957 \tabularnewline
24 & 0.398719906804462 & 0.797439813608925 & 0.601280093195538 \tabularnewline
25 & 0.371179071668955 & 0.74235814333791 & 0.628820928331045 \tabularnewline
26 & 0.311954527548473 & 0.623909055096946 & 0.688045472451527 \tabularnewline
27 & 0.504518428741937 & 0.990963142516125 & 0.495481571258063 \tabularnewline
28 & 0.750947517835532 & 0.498104964328936 & 0.249052482164468 \tabularnewline
29 & 0.940773754657361 & 0.118452490685277 & 0.0592262453426386 \tabularnewline
30 & 0.97360523406135 & 0.0527895318772997 & 0.0263947659386499 \tabularnewline
31 & 0.968117183348206 & 0.0637656333035885 & 0.0318828166517943 \tabularnewline
32 & 0.997679477008172 & 0.00464104598365586 & 0.00232052299182793 \tabularnewline
33 & 0.99980057008015 & 0.000398859839698567 & 0.000199429919849283 \tabularnewline
34 & 0.999871672329208 & 0.000256655341584858 & 0.000128327670792429 \tabularnewline
35 & 0.999725432418824 & 0.000549135162352745 & 0.000274567581176373 \tabularnewline
36 & 0.99960620233031 & 0.000787595339382212 & 0.000393797669691106 \tabularnewline
37 & 0.999821336985778 & 0.000357326028444936 & 0.000178663014222468 \tabularnewline
38 & 0.999746836384176 & 0.00050632723164863 & 0.000253163615824315 \tabularnewline
39 & 0.999735674440593 & 0.000528651118814235 & 0.000264325559407118 \tabularnewline
40 & 0.999985063619295 & 2.98727614106847e-05 & 1.49363807053423e-05 \tabularnewline
41 & 0.999997419529864 & 5.16094027225501e-06 & 2.58047013612751e-06 \tabularnewline
42 & 0.999996146341156 & 7.70731768862185e-06 & 3.85365884431092e-06 \tabularnewline
43 & 0.99999343162 & 1.31367599984261e-05 & 6.56837999921303e-06 \tabularnewline
44 & 0.999984476951395 & 3.10460972093965e-05 & 1.55230486046983e-05 \tabularnewline
45 & 0.999951857807816 & 9.62843843682066e-05 & 4.81421921841033e-05 \tabularnewline
46 & 0.999847768632448 & 0.000304462735104801 & 0.000152231367552401 \tabularnewline
47 & 0.999598846282584 & 0.000802307434831252 & 0.000401153717415626 \tabularnewline
48 & 0.999800181804203 & 0.000399636391593161 & 0.000199818195796581 \tabularnewline
49 & 0.999224529959151 & 0.00155094008169755 & 0.000775470040848774 \tabularnewline
50 & 0.99718994629934 & 0.00562010740131808 & 0.00281005370065904 \tabularnewline
51 & 0.99007485966975 & 0.0198502806605004 & 0.00992514033025018 \tabularnewline
52 & 0.9655281148544 & 0.0689437702911981 & 0.0344718851455991 \tabularnewline
\hline
\end{tabular}
%Source: https://freestatistics.org/blog/index.php?pk=158959&T=5

[TABLE]
[ROW][C]Goldfeld-Quandt test for Heteroskedasticity[/C][/ROW]
[ROW][C]p-values[/C][C]Alternative Hypothesis[/C][/ROW]
[ROW][C]breakpoint index[/C][C]greater[/C][C]2-sided[/C][C]less[/C][/ROW]
[ROW][C]8[/C][C]0.0243754136309008[/C][C]0.0487508272618016[/C][C]0.9756245863691[/C][/ROW]
[ROW][C]9[/C][C]0.00722053155145978[/C][C]0.0144410631029196[/C][C]0.99277946844854[/C][/ROW]
[ROW][C]10[/C][C]0.00641146093832648[/C][C]0.012822921876653[/C][C]0.993588539061674[/C][/ROW]
[ROW][C]11[/C][C]0.00619174075194116[/C][C]0.0123834815038823[/C][C]0.993808259248059[/C][/ROW]
[ROW][C]12[/C][C]0.00263038288015946[/C][C]0.00526076576031893[/C][C]0.99736961711984[/C][/ROW]
[ROW][C]13[/C][C]0.00537229257267128[/C][C]0.0107445851453426[/C][C]0.994627707427329[/C][/ROW]
[ROW][C]14[/C][C]0.00193894768389811[/C][C]0.00387789536779623[/C][C]0.998061052316102[/C][/ROW]
[ROW][C]15[/C][C]0.012814202344701[/C][C]0.0256284046894021[/C][C]0.987185797655299[/C][/ROW]
[ROW][C]16[/C][C]0.0190029031831665[/C][C]0.0380058063663331[/C][C]0.980997096816833[/C][/ROW]
[ROW][C]17[/C][C]0.0145572823916878[/C][C]0.0291145647833756[/C][C]0.985442717608312[/C][/ROW]
[ROW][C]18[/C][C]0.0157725736691419[/C][C]0.0315451473382839[/C][C]0.984227426330858[/C][/ROW]
[ROW][C]19[/C][C]0.0125762222652225[/C][C]0.0251524445304451[/C][C]0.987423777734778[/C][/ROW]
[ROW][C]20[/C][C]0.026839469698553[/C][C]0.0536789393971059[/C][C]0.973160530301447[/C][/ROW]
[ROW][C]21[/C][C]0.104253292243231[/C][C]0.208506584486462[/C][C]0.895746707756769[/C][/ROW]
[ROW][C]22[/C][C]0.163371306516907[/C][C]0.326742613033813[/C][C]0.836628693483093[/C][/ROW]
[ROW][C]23[/C][C]0.182749554842043[/C][C]0.365499109684086[/C][C]0.817250445157957[/C][/ROW]
[ROW][C]24[/C][C]0.398719906804462[/C][C]0.797439813608925[/C][C]0.601280093195538[/C][/ROW]
[ROW][C]25[/C][C]0.371179071668955[/C][C]0.74235814333791[/C][C]0.628820928331045[/C][/ROW]
[ROW][C]26[/C][C]0.311954527548473[/C][C]0.623909055096946[/C][C]0.688045472451527[/C][/ROW]
[ROW][C]27[/C][C]0.504518428741937[/C][C]0.990963142516125[/C][C]0.495481571258063[/C][/ROW]
[ROW][C]28[/C][C]0.750947517835532[/C][C]0.498104964328936[/C][C]0.249052482164468[/C][/ROW]
[ROW][C]29[/C][C]0.940773754657361[/C][C]0.118452490685277[/C][C]0.0592262453426386[/C][/ROW]
[ROW][C]30[/C][C]0.97360523406135[/C][C]0.0527895318772997[/C][C]0.0263947659386499[/C][/ROW]
[ROW][C]31[/C][C]0.968117183348206[/C][C]0.0637656333035885[/C][C]0.0318828166517943[/C][/ROW]
[ROW][C]32[/C][C]0.997679477008172[/C][C]0.00464104598365586[/C][C]0.00232052299182793[/C][/ROW]
[ROW][C]33[/C][C]0.99980057008015[/C][C]0.000398859839698567[/C][C]0.000199429919849283[/C][/ROW]
[ROW][C]34[/C][C]0.999871672329208[/C][C]0.000256655341584858[/C][C]0.000128327670792429[/C][/ROW]
[ROW][C]35[/C][C]0.999725432418824[/C][C]0.000549135162352745[/C][C]0.000274567581176373[/C][/ROW]
[ROW][C]36[/C][C]0.99960620233031[/C][C]0.000787595339382212[/C][C]0.000393797669691106[/C][/ROW]
[ROW][C]37[/C][C]0.999821336985778[/C][C]0.000357326028444936[/C][C]0.000178663014222468[/C][/ROW]
[ROW][C]38[/C][C]0.999746836384176[/C][C]0.00050632723164863[/C][C]0.000253163615824315[/C][/ROW]
[ROW][C]39[/C][C]0.999735674440593[/C][C]0.000528651118814235[/C][C]0.000264325559407118[/C][/ROW]
[ROW][C]40[/C][C]0.999985063619295[/C][C]2.98727614106847e-05[/C][C]1.49363807053423e-05[/C][/ROW]
[ROW][C]41[/C][C]0.999997419529864[/C][C]5.16094027225501e-06[/C][C]2.58047013612751e-06[/C][/ROW]
[ROW][C]42[/C][C]0.999996146341156[/C][C]7.70731768862185e-06[/C][C]3.85365884431092e-06[/C][/ROW]
[ROW][C]43[/C][C]0.99999343162[/C][C]1.31367599984261e-05[/C][C]6.56837999921303e-06[/C][/ROW]
[ROW][C]44[/C][C]0.999984476951395[/C][C]3.10460972093965e-05[/C][C]1.55230486046983e-05[/C][/ROW]
[ROW][C]45[/C][C]0.999951857807816[/C][C]9.62843843682066e-05[/C][C]4.81421921841033e-05[/C][/ROW]
[ROW][C]46[/C][C]0.999847768632448[/C][C]0.000304462735104801[/C][C]0.000152231367552401[/C][/ROW]
[ROW][C]47[/C][C]0.999598846282584[/C][C]0.000802307434831252[/C][C]0.000401153717415626[/C][/ROW]
[ROW][C]48[/C][C]0.999800181804203[/C][C]0.000399636391593161[/C][C]0.000199818195796581[/C][/ROW]
[ROW][C]49[/C][C]0.999224529959151[/C][C]0.00155094008169755[/C][C]0.000775470040848774[/C][/ROW]
[ROW][C]50[/C][C]0.99718994629934[/C][C]0.00562010740131808[/C][C]0.00281005370065904[/C][/ROW]
[ROW][C]51[/C][C]0.99007485966975[/C][C]0.0198502806605004[/C][C]0.00992514033025018[/C][/ROW]
[ROW][C]52[/C][C]0.9655281148544[/C][C]0.0689437702911981[/C][C]0.0344718851455991[/C][/ROW]
[/TABLE]
Source: https://freestatistics.org/blog/index.php?pk=158959&T=5

Globally Unique Identifier (entire table): ba.freestatistics.org/blog/index.php?pk=158959&T=5

As an alternative you can also use a QR Code:  

The GUIDs for individual cells are displayed in the table below:

Goldfeld-Quandt test for Heteroskedasticity
p-valuesAlternative Hypothesis
breakpoint indexgreater2-sidedless
80.02437541363090080.04875082726180160.9756245863691
90.007220531551459780.01444106310291960.99277946844854
100.006411460938326480.0128229218766530.993588539061674
110.006191740751941160.01238348150388230.993808259248059
120.002630382880159460.005260765760318930.99736961711984
130.005372292572671280.01074458514534260.994627707427329
140.001938947683898110.003877895367796230.998061052316102
150.0128142023447010.02562840468940210.987185797655299
160.01900290318316650.03800580636633310.980997096816833
170.01455728239168780.02911456478337560.985442717608312
180.01577257366914190.03154514733828390.984227426330858
190.01257622226522250.02515244453044510.987423777734778
200.0268394696985530.05367893939710590.973160530301447
210.1042532922432310.2085065844864620.895746707756769
220.1633713065169070.3267426130338130.836628693483093
230.1827495548420430.3654991096840860.817250445157957
240.3987199068044620.7974398136089250.601280093195538
250.3711790716689550.742358143337910.628820928331045
260.3119545275484730.6239090550969460.688045472451527
270.5045184287419370.9909631425161250.495481571258063
280.7509475178355320.4981049643289360.249052482164468
290.9407737546573610.1184524906852770.0592262453426386
300.973605234061350.05278953187729970.0263947659386499
310.9681171833482060.06376563330358850.0318828166517943
320.9976794770081720.004641045983655860.00232052299182793
330.999800570080150.0003988598396985670.000199429919849283
340.9998716723292080.0002566553415848580.000128327670792429
350.9997254324188240.0005491351623527450.000274567581176373
360.999606202330310.0007875953393822120.000393797669691106
370.9998213369857780.0003573260284449360.000178663014222468
380.9997468363841760.000506327231648630.000253163615824315
390.9997356744405930.0005286511188142350.000264325559407118
400.9999850636192952.98727614106847e-051.49363807053423e-05
410.9999974195298645.16094027225501e-062.58047013612751e-06
420.9999961463411567.70731768862185e-063.85365884431092e-06
430.999993431621.31367599984261e-056.56837999921303e-06
440.9999844769513953.10460972093965e-051.55230486046983e-05
450.9999518578078169.62843843682066e-054.81421921841033e-05
460.9998477686324480.0003044627351048010.000152231367552401
470.9995988462825840.0008023074348312520.000401153717415626
480.9998001818042030.0003996363915931610.000199818195796581
490.9992245299591510.001550940081697550.000775470040848774
500.997189946299340.005620107401318080.00281005370065904
510.990074859669750.01985028066050040.00992514033025018
520.96552811485440.06894377029119810.0344718851455991


Meta Analysis of Goldfeld-Quandt test for Heteroskedasticity
Description# significant tests% significant testsOK/NOK
1% type I error level210.466666666666667NOK
5% type I error level320.711111111111111NOK
10% type I error level360.8NOK

\begin{tabular}{lllllllll}
\hline
Meta Analysis of Goldfeld-Quandt test for Heteroskedasticity \tabularnewline
Description & # significant tests & % significant tests & OK/NOK \tabularnewline
1% type I error level & 21 & 0.466666666666667 & NOK \tabularnewline
5% type I error level & 32 & 0.711111111111111 & NOK \tabularnewline
10% type I error level & 36 & 0.8 & NOK \tabularnewline
\hline
\end{tabular}
%Source: https://freestatistics.org/blog/index.php?pk=158959&T=6

[TABLE]
[ROW][C]Meta Analysis of Goldfeld-Quandt test for Heteroskedasticity[/C][/ROW]
[ROW][C]Description[/C][C]# significant tests[/C][C]% significant tests[/C][C]OK/NOK[/C][/ROW]
[ROW][C]1% type I error level[/C][C]21[/C][C]0.466666666666667[/C][C]NOK[/C][/ROW]
[ROW][C]5% type I error level[/C][C]32[/C][C]0.711111111111111[/C][C]NOK[/C][/ROW]
[ROW][C]10% type I error level[/C][C]36[/C][C]0.8[/C][C]NOK[/C][/ROW]
[/TABLE]
Source: https://freestatistics.org/blog/index.php?pk=158959&T=6

Globally Unique Identifier (entire table): ba.freestatistics.org/blog/index.php?pk=158959&T=6

As an alternative you can also use a QR Code:  

The GUIDs for individual cells are displayed in the table below:

Meta Analysis of Goldfeld-Quandt test for Heteroskedasticity
Description# significant tests% significant testsOK/NOK
1% type I error level210.466666666666667NOK
5% type I error level320.711111111111111NOK
10% type I error level360.8NOK


Parameters (Session):
par1 = 1 ; par2 = Do not include Seasonal Dummies ; par3 = No Linear Trend ;
Parameters (R input):
par1 = 1 ; par2 = Do not include Seasonal Dummies ; par3 = No Linear Trend ;
R code (references can be found in the software module):
library(lattice)
library(lmtest)
n25 <- 25 #minimum number of obs. for Goldfeld-Quandt test
par1 <- as.numeric(par1)
x <- t(y)
k <- length(x[1,])
n <- length(x[,1])
x1 <- cbind(x[,par1], x[,1:k!=par1])
mycolnames <- c(colnames(x)[par1], colnames(x)[1:k!=par1])
colnames(x1) <- mycolnames #colnames(x)[par1]
x <- x1
if (par3 == 'First Differences'){
x2 <- array(0, dim=c(n-1,k), dimnames=list(1:(n-1), paste('(1-B)',colnames(x),sep='')))
for (i in 1:n-1) {
for (j in 1:k) {
x2[i,j] <- x[i+1,j] - x[i,j]
}
}
x <- x2
}
if (par2 == 'Include Monthly Dummies'){
x2 <- array(0, dim=c(n,11), dimnames=list(1:n, paste('M', seq(1:11), sep ='')))
for (i in 1:11){
x2[seq(i,n,12),i] <- 1
}
x <- cbind(x, x2)
}
if (par2 == 'Include Quarterly Dummies'){
x2 <- array(0, dim=c(n,3), dimnames=list(1:n, paste('Q', seq(1:3), sep ='')))
for (i in 1:3){
x2[seq(i,n,4),i] <- 1
}
x <- cbind(x, x2)
}
k <- length(x[1,])
if (par3 == 'Linear Trend'){
x <- cbind(x, c(1:n))
colnames(x)[k+1] <- 't'
}
x
k <- length(x[1,])
df <- as.data.frame(x)
(mylm <- lm(df))
(mysum <- summary(mylm))
if (n > n25) {
kp3 <- k + 3
nmkm3 <- n - k - 3
gqarr <- array(NA, dim=c(nmkm3-kp3+1,3))
numgqtests <- 0
numsignificant1 <- 0
numsignificant5 <- 0
numsignificant10 <- 0
for (mypoint in kp3:nmkm3) {
j <- 0
numgqtests <- numgqtests + 1
for (myalt in c('greater', 'two.sided', 'less')) {
j <- j + 1
gqarr[mypoint-kp3+1,j] <- gqtest(mylm, point=mypoint, alternative=myalt)$p.value
}
if (gqarr[mypoint-kp3+1,2] < 0.01) numsignificant1 <- numsignificant1 + 1
if (gqarr[mypoint-kp3+1,2] < 0.05) numsignificant5 <- numsignificant5 + 1
if (gqarr[mypoint-kp3+1,2] < 0.10) numsignificant10 <- numsignificant10 + 1
}
gqarr
}
bitmap(file='test0.png')
plot(x[,1], type='l', main='Actuals and Interpolation', ylab='value of Actuals and Interpolation (dots)', xlab='time or index')
points(x[,1]-mysum$resid)
grid()
dev.off()
bitmap(file='test1.png')
plot(mysum$resid, type='b', pch=19, main='Residuals', ylab='value of Residuals', xlab='time or index')
grid()
dev.off()
bitmap(file='test2.png')
hist(mysum$resid, main='Residual Histogram', xlab='values of Residuals')
grid()
dev.off()
bitmap(file='test3.png')
densityplot(~mysum$resid,col='black',main='Residual Density Plot', xlab='values of Residuals')
dev.off()
bitmap(file='test4.png')
qqnorm(mysum$resid, main='Residual Normal Q-Q Plot')
qqline(mysum$resid)
grid()
dev.off()
(myerror <- as.ts(mysum$resid))
bitmap(file='test5.png')
dum <- cbind(lag(myerror,k=1),myerror)
dum
dum1 <- dum[2:length(myerror),]
dum1
z <- as.data.frame(dum1)
z
plot(z,main=paste('Residual Lag plot, lowess, and regression line'), ylab='values of Residuals', xlab='lagged values of Residuals')
lines(lowess(z))
abline(lm(z))
grid()
dev.off()
bitmap(file='test6.png')
acf(mysum$resid, lag.max=length(mysum$resid)/2, main='Residual Autocorrelation Function')
grid()
dev.off()
bitmap(file='test7.png')
pacf(mysum$resid, lag.max=length(mysum$resid)/2, main='Residual Partial Autocorrelation Function')
grid()
dev.off()
bitmap(file='test8.png')
opar <- par(mfrow = c(2,2), oma = c(0, 0, 1.1, 0))
plot(mylm, las = 1, sub='Residual Diagnostics')
par(opar)
dev.off()
if (n > n25) {
bitmap(file='test9.png')
plot(kp3:nmkm3,gqarr[,2], main='Goldfeld-Quandt test',ylab='2-sided p-value',xlab='breakpoint')
grid()
dev.off()
}
load(file='createtable')
a<-table.start()
a<-table.row.start(a)
a<-table.element(a, 'Multiple Linear Regression - Estimated Regression Equation', 1, TRUE)
a<-table.row.end(a)
myeq <- colnames(x)[1]
myeq <- paste(myeq, '[t] = ', sep='')
for (i in 1:k){
if (mysum$coefficients[i,1] > 0) myeq <- paste(myeq, '+', '')
myeq <- paste(myeq, mysum$coefficients[i,1], sep=' ')
if (rownames(mysum$coefficients)[i] != '(Intercept)') {
myeq <- paste(myeq, rownames(mysum$coefficients)[i], sep='')
if (rownames(mysum$coefficients)[i] != 't') myeq <- paste(myeq, '[t]', sep='')
}
}
myeq <- paste(myeq, ' + e[t]')
a<-table.row.start(a)
a<-table.element(a, myeq)
a<-table.row.end(a)
a<-table.end(a)
table.save(a,file='mytable1.tab')
a<-table.start()
a<-table.row.start(a)
a<-table.element(a,hyperlink('ols1.htm','Multiple Linear Regression - Ordinary Least Squares',''), 6, TRUE)
a<-table.row.end(a)
a<-table.row.start(a)
a<-table.element(a,'Variable',header=TRUE)
a<-table.element(a,'Parameter',header=TRUE)
a<-table.element(a,'S.D.',header=TRUE)
a<-table.element(a,'T-STAT
H0: parameter = 0',header=TRUE)
a<-table.element(a,'2-tail p-value',header=TRUE)
a<-table.element(a,'1-tail p-value',header=TRUE)
a<-table.row.end(a)
for (i in 1:k){
a<-table.row.start(a)
a<-table.element(a,rownames(mysum$coefficients)[i],header=TRUE)
a<-table.element(a,mysum$coefficients[i,1])
a<-table.element(a, round(mysum$coefficients[i,2],6))
a<-table.element(a, round(mysum$coefficients[i,3],4))
a<-table.element(a, round(mysum$coefficients[i,4],6))
a<-table.element(a, round(mysum$coefficients[i,4]/2,6))
a<-table.row.end(a)
}
a<-table.end(a)
table.save(a,file='mytable2.tab')
a<-table.start()
a<-table.row.start(a)
a<-table.element(a, 'Multiple Linear Regression - Regression Statistics', 2, TRUE)
a<-table.row.end(a)
a<-table.row.start(a)
a<-table.element(a, 'Multiple R',1,TRUE)
a<-table.element(a, sqrt(mysum$r.squared))
a<-table.row.end(a)
a<-table.row.start(a)
a<-table.element(a, 'R-squared',1,TRUE)
a<-table.element(a, mysum$r.squared)
a<-table.row.end(a)
a<-table.row.start(a)
a<-table.element(a, 'Adjusted R-squared',1,TRUE)
a<-table.element(a, mysum$adj.r.squared)
a<-table.row.end(a)
a<-table.row.start(a)
a<-table.element(a, 'F-TEST (value)',1,TRUE)
a<-table.element(a, mysum$fstatistic[1])
a<-table.row.end(a)
a<-table.row.start(a)
a<-table.element(a, 'F-TEST (DF numerator)',1,TRUE)
a<-table.element(a, mysum$fstatistic[2])
a<-table.row.end(a)
a<-table.row.start(a)
a<-table.element(a, 'F-TEST (DF denominator)',1,TRUE)
a<-table.element(a, mysum$fstatistic[3])
a<-table.row.end(a)
a<-table.row.start(a)
a<-table.element(a, 'p-value',1,TRUE)
a<-table.element(a, 1-pf(mysum$fstatistic[1],mysum$fstatistic[2],mysum$fstatistic[3]))
a<-table.row.end(a)
a<-table.row.start(a)
a<-table.element(a, 'Multiple Linear Regression - Residual Statistics', 2, TRUE)
a<-table.row.end(a)
a<-table.row.start(a)
a<-table.element(a, 'Residual Standard Deviation',1,TRUE)
a<-table.element(a, mysum$sigma)
a<-table.row.end(a)
a<-table.row.start(a)
a<-table.element(a, 'Sum Squared Residuals',1,TRUE)
a<-table.element(a, sum(myerror*myerror))
a<-table.row.end(a)
a<-table.end(a)
table.save(a,file='mytable3.tab')
a<-table.start()
a<-table.row.start(a)
a<-table.element(a, 'Multiple Linear Regression - Actuals, Interpolation, and Residuals', 4, TRUE)
a<-table.row.end(a)
a<-table.row.start(a)
a<-table.element(a, 'Time or Index', 1, TRUE)
a<-table.element(a, 'Actuals', 1, TRUE)
a<-table.element(a, 'Interpolation
Forecast', 1, TRUE)
a<-table.element(a, 'Residuals
Prediction Error', 1, TRUE)
a<-table.row.end(a)
for (i in 1:n) {
a<-table.row.start(a)
a<-table.element(a,i, 1, TRUE)
a<-table.element(a,x[i])
a<-table.element(a,x[i]-mysum$resid[i])
a<-table.element(a,mysum$resid[i])
a<-table.row.end(a)
}
a<-table.end(a)
table.save(a,file='mytable4.tab')
if (n > n25) {
a<-table.start()
a<-table.row.start(a)
a<-table.element(a,'Goldfeld-Quandt test for Heteroskedasticity',4,TRUE)
a<-table.row.end(a)
a<-table.row.start(a)
a<-table.element(a,'p-values',header=TRUE)
a<-table.element(a,'Alternative Hypothesis',3,header=TRUE)
a<-table.row.end(a)
a<-table.row.start(a)
a<-table.element(a,'breakpoint index',header=TRUE)
a<-table.element(a,'greater',header=TRUE)
a<-table.element(a,'2-sided',header=TRUE)
a<-table.element(a,'less',header=TRUE)
a<-table.row.end(a)
for (mypoint in kp3:nmkm3) {
a<-table.row.start(a)
a<-table.element(a,mypoint,header=TRUE)
a<-table.element(a,gqarr[mypoint-kp3+1,1])
a<-table.element(a,gqarr[mypoint-kp3+1,2])
a<-table.element(a,gqarr[mypoint-kp3+1,3])
a<-table.row.end(a)
}
a<-table.end(a)
table.save(a,file='mytable5.tab')
a<-table.start()
a<-table.row.start(a)
a<-table.element(a,'Meta Analysis of Goldfeld-Quandt test for Heteroskedasticity',4,TRUE)
a<-table.row.end(a)
a<-table.row.start(a)
a<-table.element(a,'Description',header=TRUE)
a<-table.element(a,'# significant tests',header=TRUE)
a<-table.element(a,'% significant tests',header=TRUE)
a<-table.element(a,'OK/NOK',header=TRUE)
a<-table.row.end(a)
a<-table.row.start(a)
a<-table.element(a,'1% type I error level',header=TRUE)
a<-table.element(a,numsignificant1)
a<-table.element(a,numsignificant1/numgqtests)
if (numsignificant1/numgqtests < 0.01) dum <- 'OK' else dum <- 'NOK'
a<-table.element(a,dum)
a<-table.row.end(a)
a<-table.row.start(a)
a<-table.element(a,'5% type I error level',header=TRUE)
a<-table.element(a,numsignificant5)
a<-table.element(a,numsignificant5/numgqtests)
if (numsignificant5/numgqtests < 0.05) dum <- 'OK' else dum <- 'NOK'
a<-table.element(a,dum)
a<-table.row.end(a)
a<-table.row.start(a)
a<-table.element(a,'10% type I error level',header=TRUE)
a<-table.element(a,numsignificant10)
a<-table.element(a,numsignificant10/numgqtests)
if (numsignificant10/numgqtests < 0.1) dum <- 'OK' else dum <- 'NOK'
a<-table.element(a,dum)
a<-table.row.end(a)
a<-table.end(a)
table.save(a,file='mytable6.tab')
}